Graphical Timelines on German WikipediaSo far 276 timelines have been created on this Wikipedia. Last timeline added on Thursday, July 27, 200642 very basic, repetitive or bot created timelines not shown here. |
Monday, July 31, 2006index |
Feel feel to ask Erik Zachte, the author of EasyTimeline, for help or advice at his Wikipedia user page
See also Introduction to EasyTimeline / Syntax
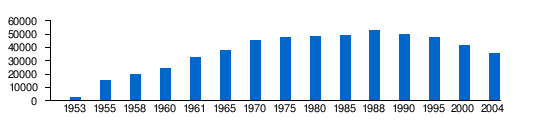
| Eisenhüttenstadt | next |
First version by 84.189.158.208 on Monday, December 19, 2005, last update on Monday, July 31, 2006
ImageSize  = width:550 height:120
PlotArea   = width:450 height:80 left:50 bottom:20
AlignBars  = late

DateFormat = yyyy
Period     = from:0 till:60000
TimeAxis   = orientation:vertical
ScaleMajor = unit:year increment:10000 start:0

PlotData=
  color:blue width:10
  bar:1953 from:start till:2400
  bar:1955 from:start till:15157
  bar:1958 from:start till:19629
  bar:1960 from:start till:24372
  bar:1961 from:start till:32970
  bar:1965 from:start till:38138
  bar:1970 from:start till:45410
  bar:1975 from:start till:47414
  bar:1980 from:start till:48253
  bar:1985 from:start till:48810
  bar:1988 from:start till:53048
  bar:1990 from:start till:50216
  bar:1995 from:start till:47376
  bar:2000 from:start till:41493
  bar:2004 from:start till:35884
TextData=
  pos:(20,110) fontsize:M text:
| Gambia | top next |

First version by Atamari on Wednesday, April 20, 2005, last update on Monday, June 5, 2006
ImageSize = width:275 height:50
PlotArea  = left:30 right:30 top:0 bottom:20
DateFormat = x.y
Period   = from:0 till:100
TimeAxis  = orientation:horizontal
ScaleMajor = unit:year increment:20 start:0
ScaleMinor = unit:year increment:2 start:0
Colors =
 id:grau value:gray(0.8)
PlotData =
 from:100.0 till:99.2 color:claret
 from:99.2 till:98.8 color:claret
 from:98.8 till:97.8 color:claret
 from:97.8 till:96.5 color:claret
 from:96.5 till:94.4 color:purple
 from:94.4 till:85.7 color:green
 from:85.7 till:76.2 color:white
 from:76.2 till:60.5 color:blue
 from:60.5 till:42.3 color:yellow
 from:42.3 till:0.0 color:red

TextData =
 pos:(5,5) text:%
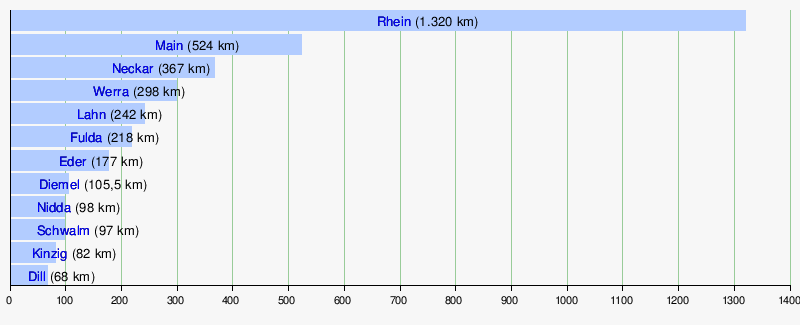
| Hessen | top next |
First version by HAH on Friday, June 16, 2006, last update on Friday, July 7, 2006
TimeAxis	= orientation:horizontal format:yyyy
ImageSize	= width:800 height:auto barincrement:25
PlotArea 	= left:10 right:10 top:10 bottom:40
AlignBars  	= justify

Colors =
  id:canvas        	value:rgb(0.97,0.97,0.97)

BackgroundColors = canvas:canvas

Period     = from:0 till:1400
ScaleMajor = unit:year increment:100 start:0 gridcolor:drabgreen

BarData=
  barset:Flüsse

PlotData=
  width:20 fontsize:M textcolor:black align:left color:skyblue shift:(0,-6)

  barset:Flüsse

  #from:start till:end width:20 color:drabgreen Text:Die_längsten_Flüsse_in_Hessen fontsize:15  align:center

  from:start till:1320 text:[[Rhein]] (1.320 km)
  from:start till:524  text:[[Main]] (524 km)
  from:start till:367  text:[[Neckar]] (367 km)
  from:start till:298  text:[[Werra]] (298 km)
  from:start till:242  text:[[Lahn (Fluss)|Lahn]] (242 km)
  from:start till:218  text:[[Fulda (Fluss)|Fulda]] (218 km)
  from:start till:177  text:[[Eder]] (177 km)
  from:start till:105.5 text:[[Diemel]] (105,5 km)
  from:start till:98   text:[[Nidda (Fluss)|Nidda]] (98 km)
  from:start till:97   text:[[Schwalm (Fluss in Hessen)|Schwalm]] (97 km)
  from:start till:82   text:[[Kinzig (Hessen)|Kinzig]] (82 km)
  from:start till:68   text:[[Dill (Fluss)|Dill]] (68 km)
| Apple Macintosh | top next |

First version by Achim Raschka on Sunday, June 4, 2006, last update on Friday, June 16, 2006
DateFormat=mm/dd/yyyy
Period = from:01/01/1984 till:04/01/2008
Define $now = 08/01/2006 # Please keep updated
Define $skip = at:end # Force a blank line
Define $dayunknown = 15 # what day to use if it's actually not known
Define $newworldstart = at:05/$dayunknown/1998 mark:(line,red)
Define $intelstart = at:01/10/2006 mark:(line,red)
ImageSize= width:800 height:auto barincrement:23
TimeAxis = orientation:horizontal
PlotArea = right:5 left:20 bottom:80 top:5
Legend = orientation:vertical position:bottom columns:4

Colors =
     id:bg         value:white
     id:classic2   value:rgb(1,0.9,0.9)
     id:classic    value:rgb(1,0.85,0.85) legend:All-in-one_/_Consumer
     id:lisa       value:rgb(1,1,0.6) legend:Derived_from_the_Lisa
     id:macii      value:rgb(0.8,1,0.8) legend:Macintosh_II_series
     id:portable2  value:rgb(0.9,0.9,1)
     id:portable   value:rgb(0.85,0.85,1) legend:Portable_computers
     id:edu        value:rgb(1,0.9,0.8) legend:Educational_models
     id:0402       value:rgb(0.8,0.9,1)
     id:040        value:rgb(0.75,0.85,1) legend:Workstations
     id:server2    value:rgb(0.8,1,0.9)
     id:server     value:rgb(0.75,1,0.85) legend:Servers
     id:line       value:rgb(0.2,0.2,0.2)
     id:lightline  value:rgb(0.8,0.8,0.8)
     id:header     value:rgb(0.8,0.8,0.9)
     id:lighttext  value:rgb(0.5,0.5,0.5)
     id:current    value:rgb(0.9,0.9,0.9) legend:Still_currently_produced

BackgroundColors = canvas:bg
ScaleMajor = gridcolor:lighttext unit:year increment:1 start:01/01/1984

BarData =
  Barset:oldnew
  Barset:classic
  Barset:macii
  Barset:portable

PlotData=
  width:15 textcolor:black

  barset:oldnew
    color:header textcolor:white width:20 shift:(-50,-5) fontsize:m from:start till:05/01/1998 text:"[[Old World ROM]]"
  barset:break
    $newworldstart
  barset:break
    color:header textcolor:white width:20 shift:(-50,-5) fontsize:m from:05/01/1998 till:01/10/2006 text:"[[New World ROM]]"
  barset:break
    $intelstart
  barset:break
    color:header textcolor:white width:20 shift:(-10,-5) fontsize:m from:01/10/2006 till:end text:"[[Extensible Firmware Interface|EFI]]"

  barset:classic
    shift:(5,-5) anchor:from fontsize:s
    color:classic from:01/24/1984 till:01/10/1985 text:"[[Macintosh 128K|128K]]"
    color:classic from:09/10/1984 till:04/14/1986 text:"[[Macintosh 512K|512K]]"
   barset:break
    color:classic from:01/16/1986 till:10/15/1990 text:"[[Macintosh Plus|Plus]]"
    color:classic2 from:04/14/1986 till:10/01/1987 text:"[[Macintosh 512Ke|512Ke]]"
    color:classic from:02/03/1987 till:08/$dayunknown/1989 text:"[[Macintosh SE|SE]]"
   barset:break
    $skip
    $skip
    color:classic2 from:08/$dayunknown/1989 till:10/15/1990 text:"[[Macintosh SE FDHD|FDHD]]"
   barset:break
    color:classic from:09/$dayunknown/1992 till:08/$dayunknown/1997 text:"[[Macintosh Performa|Performa]]*"
    color:classic from:01/19/1989 till:10/21/1991 text:"[[Macintosh SE/30|SE/30]]"
    color:classic from:10/15/1990 till:09/14/1992 text:"[[Macintosh Classic|Classic]]"
   barset:break
    color:classic from:05/$dayunknown/1998 till:03/$dayunknown/2003 text:"[[iMac]]"
    color:classic2 from:10/21/1991 till:09/13/1993 text:"[[Macintosh Classic II|Classic II]]"
    color:classic2 from:02/10/1993 till:05/16/1994 text:"[[Macintosh Color Classic|CC]]**"
   barset:break
    color:classic2 from:01/$dayunknown/2002 till:08/$dayunknown/2004 text:"[[iMac G4]]"
    color:classic from:10/$dayunknown/1993 till:04/$dayunknown/1994 text:"[[Macintosh TV|TV]]"
   barset:break
    color:classic from:08/$dayunknown/2004 till:01/10/2006 text:"[[iMac G5]]"
    color:classic from:01/$dayunknown/2005 till:02/28/2006 text:"[[Mac mini|mini]]"
   barset:break
    $newworldstart
    $newworldstart
    $newworldstart
   barset:break
    color:classic2 from:01/10/2006 till:$now text:"[[iMac Core Duo]]"
    color:classic2 from:02/28/2006 till:$now text:"[[Mac mini with Intel Core|mini Core]]"
   barset:break
    $intelstart
    at:02/28/2006 mark:(line,red)
    $intelstart
   barset:break
    color:current from:$now till:end
    color:current from:$now till:end

  barset:macii
    color:lisa from:01/01/1985 till:08/01/1986 text:"[[Macintosh XL|XL]]"
  barset:break
    $skip
    $skip
    color:macii from:03/02/1987 till:10/21/1993 text:"[[Macintosh II series]]"
  barset:break
    color:edu from:10/$dayunknown/1990 till:04/$dayunknown/1996 text:"[[Macintosh LC|LC]]"
    color:040 from:10/$dayunknown/1991 till:04/$dayunknown/1995 text:"[[Macintosh Quadra|Quadra / Centris]]"
    color:040 from:03/$dayunknown/1994 till:11/$dayunknown/1997 text:"[[Power Macintosh]]"
  barset:break
    $skip
    color:040 from:07/$dayunknown/1997 till:03/$dayunknown/1998 text:"[[Twentieth Anniversary Macintosh|TAM]]***"
    color:0402 from:11/$dayunknown/1997 till:01/$dayunknown/1999 text:"[[Power Macintosh G3|G3]]"
   barset:break
    $newworldstart
    $newworldstart
    at:01/$dayunknown/1999 mark:(line,red)
   barset:break
    $skip
    color:040 from:07/$dayunknown/2000 till:07/$dayunknown/2001 text:"[[Power Mac G4 Cube|Cube]]"
    color:040 from:01/$dayunknown/1999 till:08/$dayunknown/1999 text:"[[blue and white Power Macintosh G3|G3]]"
   barset:break
    color:edu from:04/$dayunknown/2002 till:$now text:"[[eMac]]"
    $skip
    color:0402 from:08/$dayunknown/1999 till:06/$dayunknown/2004 text:"[[Power Mac G4]]"
   barset:break
    $skip
    color:server from:05/$dayunknown/2002 till:01/$dayunknown/2004 text:"[[Xserve]]"
    color:040 from:06/$dayunknown/2003 till:$now text:"[[Power Mac G5]]"
   barset:break
    $skip
    color:server2 from:01/$dayunknown/2004 till:$now text:"[[Xserve G5]]"
   barset:break
    color:current from:$now till:end
    color:current from:$now till:end
    color:current from:$now till:end

  barset:portable
    color:portable from:09/$dayunknown/1989 till:10/$dayunknown/1991 text:"[[Macintosh Portable|Portable]]"
    color:portable from:10/$dayunknown/1992 till:02/$dayunknown/1997 text:"[[PowerBook Duo]]"
   barset:break
    color:portable2 from:10/$dayunknown/1991 till:05/16/1994 text:"[[PowerBook]]"
    color:portable from:07/$dayunknown/1999 till:05/$dayunknown/2001 text:"[[iBook|iBook]]"
   barset:break
    color:portable from:05/16/1994 till:08/$dayunknown/1995 text:"[[PowerBook 500|PB 5x0]]"
   barset:break
    color:portable2 from:08/$dayunknown/1995 till:11/01/1997 text:"[[PowerBook with PowerPC|PB PPC]]"
   barset:break
    color:portable from:11/$dayunknown/1997 till:05/$dayunknown/1999 text:"[[PowerBook G3|PB G3]]"
    color:portable2 from:05/$dayunknown/2001 till:10/$dayunknown/2003 text:"[[iBook (white)]]"
   barset:break
    color:portable2 from:05/$dayunknown/1999 till:01/$dayunknown/2001 text:"[[PowerBook G3 (Lombard/Pismo)|PB G3]]"
   barset:break
    at:05/$dayunknown/1999 mark:(line,red)
    color:portable from:10/$dayunknown/2003 till:05/16/2006 text:"[[iBook G4]]"
   barset:break
    color:portable from:01/$dayunknown/2001 till:01/$dayunknown/2003 text:"[[PowerBook G4|PB G4]]"
    $newworldstart
   barset:break
    color:portable2 from:01/$dayunknown/2003 till:02/$dayunknown/2006 text:"[[Aluminium PowerBook G4|Aluminium PB G4]]"
   barset:break
    at:02/14/2006 mark:(line,red)
    at:05/16/2006  mark:(line,red)
   barset:break
    color:portable from:02/14/2006 till:$now text:"[[MacBook Pro]]"
    color:portable2 from:05/16/2006 till:$now text:"[[MacBook]]"
   barset:break
    color:current from:$now till:end
    color:current from:$now till:end

TextData =
  fontsize:S
  textcolor:lighttext
  pos:(120,58)
  text:*Performas were rebranded low-end Macintosh models from other series. **Color Classic ***Twentieth Anniversary Macintosh
| Neckar | top next |

First version by Waelder on Monday, August 16, 2004, last update on Sunday, October 23, 2005
ImageSize  = width:400 height:720
PlotArea   = left:50 right:0 bottom:10 top:10
AlignBars  = early

DateFormat = yyyy
Period     = from:0 till:200000
TimeAxis   = orientation:vertical
ScaleMajor = unit:year increment:50000 start:0
ScaleMinor = unit:year increment:10000 start:0

# there is no automatic collision detection,
# so shift texts up or down manually to avoid overlap

Define $dx = 15 # shift text to right side of bar
Define $dy = -3 # shift text down

Colors =
 id:wasser   value:blue   legend:Neckar
 id:schleuse value:yellow legend:Schleuse

Legend = orientation:vertical position:bottom

PlotData=
 bar:Schleusen color:wasser width:25 mark:(line,schleuse) align:left fontsize:M

 from:0 till:200000
 at:6200   shift:($dx,$dy) color:wasser text:  6,2 km /98,50 m ü. [[Normalnull|NN]] Feudenheim Schleuse
 at:17700  shift:($dx,$dy) text: 17,7 km /101,20 m ü. [[Normalnull|NN]] Schwabenheim Schleuse
 at:26100  shift:($dx,$dy) text: 26,1 km /107,60 m ü. [[Normalnull|NN]] Heidelberg Schleuse
 at:30800  shift:($dx,$dy) text: 30,8 km /111,70 m ü. [[Normalnull|NN]] Neckargemünd Schleuse
 at:39300  shift:($dx,$dy) text: 39,3 km /116,40 m ü. [[Normalnull|NN]] Neckarsteinach Schleuse
 at:47700  shift:($dx,$dy) text: 47,7 km /121,70 m ü. [[Normalnull|NN]] Hirschhorn Schleuse
 at:61400  shift:($dx,$dy) text: 61,4 km /123,70 m ü. [[Normalnull|NN]] Rockenau Schleuse
 at:72200  shift:($dx,$dy) text: 72,2 km /132,40 m ü. [[Normalnull|NN]] Guttenbach Schleuse
 at:85900  shift:($dx,$dy) text: 85,9 km /134,60 m ü. [[Normalnull|NN]] Neckarzimmern Schleuse
 at:93800  shift:($dx,$dy) text: 93,8 km /142,90 m ü. [[Normalnull|NN]] Gundelsheim Schleuse
 at:103900 shift:($dx,$dy) text:103,9 km /150,90 m ü. [[Normalnull|NN]] Kochendorf Schleuse
 at:113600 shift:($dx,$dy) text:113,6 km /154,00 m ü. [[Normalnull|NN]] Heilbronn Schleuse
 at:117500 shift:($dx,$dy) text:117,5 km /161,30 m ü. [[Normalnull|NN]] Horkheim Schleuse
 at:125100 shift:($dx,$dy) text:125,1 km /163,70 m ü. [[Normalnull|NN]] Lauffen Schleuse
 at:136200 shift:($dx,$dy) text:136,2 km /170,00 m ü. [[Normalnull|NN]] Besigheim Schleuse
 at:143000 shift:($dx,$dy) text:143,0 km /182,20 m ü. [[Normalnull|NN]] Hessigheim Schleuse
 at:150100 shift:($dx,$dy) text:150,1 km /190,20 m ü. [[Normalnull|NN]] Pleidelsheim Schleuse
 at:157600 shift:($dx,$dy) text:157,6 km /194,20 m ü. [[Normalnull|NN]] Marbach Schleuse
 at:165000 shift:($dx,$dy) text:165,0 km /203,20 m ü. [[Normalnull|NN]] Poppenweiler Schleuse
 at:171400 shift:($dx,$dy) text:171,4 km /204,40 m ü. [[Normalnull|NN]] Aldingen Schleuse
 at:176200 shift:($dx,$dy) text:176,2 km /213,40 m ü. [[Normalnull|NN]] Hofen Schleuse
 at:182700 shift:($dx,$dy) text:182,7 km /215,00 m ü. [[Normalnull|NN]] Cannstatt Schleuse
 at:186700 shift:($dx,-5) text:186,7 km /222,40 m ü. [[Normalnull|NN]] Untertürkheim Schleuse
 at:189500 shift:($dx,$dy) text:189,5 km /231,00 m ü. [[Normalnull|NN]] Obertürkheim Schleuse
 at:194000 shift:($dx,-8) text:194,0 km /234,00 m ü. [[Normalnull|NN]] Esslingen Schleuse
 at:194800 shift:($dx,1) text:194,8 km /241,00 m ü. [[Normalnull|NN]] Oberesslingen Schleuse
 at:199500 shift:($dx,$dy) text:199,5 km /247,20 m ü. [[Normalnull|NN]] Deizisau Schleuse
| Die Linkspartei. | top next |

First version by 217.83.0.176 on Thursday, March 31, 2005, last update on Monday, July 31, 2006
ImageSize  = width:270 height:1320
PlotArea   = width:115 height:1300 left:40 bottom:10
Colors =
  id:red value:rgb(1,0,0)

DateFormat = yyyy
Period     = from:1989 till:2006
TimeAxis   = orientation:vertical
ScaleMajor = unit:year increment:1 start:1990
BackgroundColors = canvas:white
Define $dx = 20 # shift text to right side of bar

PlotData =
  bar:Chairmen color:red width:25 mark:(line,blue) align:left fontsize:S

  from:1990  till:1990 shift:($dx,0)  text:[[Bundestag]] 2,4%~[[Brandenburg]] 13,4%~[[Mecklenburg-Vorpommern]] 15,7%~[[Sachsen]] 10,2%~[[Sachsen-Anhalt]] 12,0%~[[Thüringen]] 9,7%
  from:1994  till:1994 shift:($dx,0)  text:[[Bundestag]] 4,4%~[[Europaparlament]] 4,7%~[[Brandenburg]] 18,7%~[[Mecklenburg-Vorpommern]] 22,7%~[[Sachsen]] 16,5%~[[Sachsen-Anhalt]] 19,9%~[[Thüringen]] 16,6%
  from:1995  till:1995 shift:($dx,0)  text:[[Berlin]] 14,6%~[[Bremen]] 2,4%
  from:1997  till:1997 shift:($dx,0)  text:[[Hamburg]] 0,7%
  from:1998  till:1998 shift:($dx,0)  text:[[Bundestag]] 5,1%~[[Mecklenburg-Vorpommern]] 24,4%~[[Sachsen-Anhalt]] 19,6%
  from:1999  till:1999 shift:($dx,0)  text:[[Europaparlament]] 5,8%~[[Berlin]] 17,7%~[[Brandenburg]] 23,3%~[[Sachsen]] 22,2%~[[Thüringen]] 21,4%~[[Saarland]] 0,8%~[[Bremen]] 2,9%
  from:2000  till:2000 shift:($dx,0)  text:[[Schleswig-Holstein]] 1,4%~[[Nordrhein-Westfalen]] 1,1%
  from:2001  till:2001 shift:($dx,0)  text:[[Berlin]] 22,6%
  from:2002  till:2002 shift:($dx,0)  text:[[Bundestag]] 4,0%~[[Sachsen-Anhalt]] 20,4%~[[Mecklenburg-Vorpommern]] 16,4%
  from:2003  till:2003 shift:($dx,0)  text:[[Niedersachsen]] 0,5%~[[Bremen]] 1,7%
  from:2004  till:2004 shift:($dx,0)  text:[[Europaparlament]] 6,1%~[[Saarland]] 2,3%~[[Thüringen]] 26,1%~[[Sachsen]] 23,6%~[[Brandenburg]] 28,0%
  from:2005  till:2005 shift:($dx,0)  text:[[Bundestag]] 8,7%~[[Schleswig-Holstein]] 0,8%~[[Nordrhein-Westfalen]] 0,9%
  from:2006  till:2006 shift:($dx,0)  text:[[Sachsen-Anhalt]] 25,2%
| Sonnensystem | top next |

First version by 213.7.179.103 on Wednesday, July 27, 2005, last update on Tuesday, September 13, 2005
ImageSize  = width:200 height:640
PlotArea   = width:140 height:600 left:50 bottom:20
AlignBars = justify

Period    = from:0 till:7500
TimeAxis  = orientation:vertical
ScaleMajor = unit:year increment:1000 start:0
ScaleMinor = unit:year increment:500 start:0

TextData =
  pos:(5,625)  textcolor:black fontsize:8 text:Mio. km

LineData=
  at:start color:yelloworange

PlotData=
  width:15 color:blue align:left shift:(15,-5)
  from:46 till:70 text:"Merkur"
  from:107 till:109 align:right shift:(-15,-5) text:"Venus"
  from:147 till:152 shift:(15,0) text:"Erde"
  from:207 till:249 align:right shift:(-15,0) text:"Mars"
  from:314 till:494 shift:(15,5) color:yellow text:"Asteroiden-~ gürtel"
  from:741 till:816 text:"Jupiter"
  from:1347 till:1507 text:"Saturn"
  from:2735 till:3004 text:"Uranus"
  from:4425 till:7375 color:brightgreen text:"Pluto"
  from:4456 till:4537 text:"Neptun"
| Wuppertal | top next |

First version by Atamari on Sunday, April 17, 2005, last update on Wednesday, February 15, 2006
ImageSize  = width:550 height:120
PlotArea   = width:450 height:80 left:50 bottom:20
AlignBars  = late

DateFormat = yyyy
Period     = from:0 till:500000
TimeAxis   = orientation:vertical
ScaleMajor = unit:year increment:100000 start:0

PlotData=
  color:blue width:10
  bar:1875 from:start till:167093
  bar:1900 from:start till:298884
  bar:1929 from:start till:414951
  bar:1933 from:start till:408602
  bar:1939 from:start till:401672
  bar:1946 from:start till:325846
  bar:1950 from:start till:363224
  bar:1956 from:start till:406225
  bar:1961 from:start till:420711
  bar:1965 from:start till:422461
  bar:1970 from:start till:418454
  bar:1975 from:start till:405369
  bar:1980 from:start till:393381
  bar:1985 from:start till:376579
  bar:1987 from:start till:365662
  bar:1990 from:start till:383660
  bar:1995 from:start till:381884
  bar:2000 from:start till:366434
  bar:2005 from:start till:360648

TextData=
  pos:(20,110) fontsize:M text:
| Koblenz | top next |

First version by Schaengel on Friday, July 22, 2005, last update on Saturday, May 13, 2006
ImageSize = width:1000 height:80
PlotArea = width:700 height:50 left:50 bottom:25

DateFormat = yyyy
Period = from:-100 till:2100
TimeAxis = orientation:horizontal
ScaleMajor = unit:year increment:100 start:-100

Define $dx = 25 # shift text to right side of bar

PlotData=
 bar:Leadors color:red width:15 mark: (line,white) align:left fontsize:S

 color:red from:-9 till:450 shift:(-40,15) text:Römisches Reich
 color:green from:450 till:843 shift:(-40,15) text:Fränkisches Reich
 color:red from:843 till:870 shift:(-30,30) text:Lotharingien
 color:green from:870 till:1018 shift:(-30,15) text:Ostfränk.R.
 color:red from:1018 till:1198 shift:(-30,30) text:Erzstift Trier
 color:green from:1198 till:1794 shift:(-30,15) text:Kurtrier
 color:red from:1794 till:1814 shift:(-30,30) text:Frankreich
 color:green from:1814 till:1945 shift:(-20,15) text:Preußen
 color:red from:1946 till:2010 shift:(-20,30) text:Rheinland-Pfalz
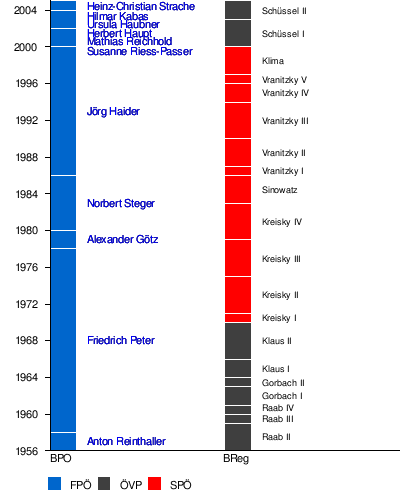
| Freiheitliche Partei Österreichs | top next |
First version by Friedrich.Kromberg on Tuesday, July 6, 2004, last update on Saturday, June 24, 2006
ImageSize  = width:400 height:500
PlotArea   = width:350  height:450 left:50 bottom:50
Legend    = columns:3 left:50 top:25 columnwidth:50

DateFormat = yyyy
Period     = from:1956 till:2005
TimeAxis   = orientation:vertical
ScaleMajor = unit:year increment:4 start:1956

# there is no automatic collision detection,
# so shift texts up or down manually to avoid overlap

Colors=
  id:FPÖ  value:blue    legend:FPÖ
  id:ÖVP  value:gray(0.25) legend:ÖVP
  id:SPÖ  value:red    legend:SPÖ

Define $dx = 25 # shift text to right side of bar
Define $dy = -4 # adjust height

PlotData=

  bar:BPO color:red width:25 mark:(line,white) align:left fontsize:S

  from:1956  till:1958 shift:($dx,$dy)    color:FPÖ    text:[[Anton Reinthaller]]
  from:1958  till:1978 shift:($dx,$dy)    color:FPÖ    text:[[Friedrich Peter]]
  from:1978  till:1980 shift:($dx,$dy)    color:FPÖ    text:[[Alexander Götz (Politiker)|Alexander Götz]]
  from:1980  till:1986 shift:($dx,$dy)    color:FPÖ    text:[[Norbert Steger]]
  from:1986  till:2000 shift:($dx,$dy)    color:FPÖ    text:[[Jörg Haider]]
  from:2000  till:2002 shift:($dx,-18)    color:FPÖ    text:[[Susanne Riess-Passer]]
  from:2002  till:2002 shift:($dx,-17)    color:FPÖ    text:[[Mathias Reichhold]]
  from:2002  till:2004 shift:($dx,-18)    color:FPÖ    text:[[Herbert Haupt]]
  from:2004  till:2005 shift:($dx,-23)    color:FPÖ    text:[[Ursula Haubner]]
  from:2005  till:2005 shift:($dx,-19)    color:FPÖ    text:[[Hilmar Kabas]]
  from:2005  till:end shift:($dx,-10)    color:FPÖ    text:[[Heinz-Christian Strache]]

  bar:BReg color:red width:25 mark:(line,white) align:left fontsize:7

  from:1956  till:1959 shift:($dx,-3)    color:ÖVP    text:Raab II
  from:1959  till:1960 shift:($dx,$dy)    color:ÖVP    text:Raab III
  from:1960  till:1961 shift:($dx,-2)    color:ÖVP    text:Raab IV
  from:1961  till:1963 shift:($dx,$dy)    color:ÖVP    text:Gorbach I
  from:1963  till:1964 shift:($dx,$dy)    color:ÖVP    text:Gorbach II
  from:1964  till:1966 shift:($dx,$dy)    color:ÖVP    text:Klaus I
  from:1966  till:1970 shift:($dx,$dy)    color:ÖVP    text:Klaus II
  from:1970  till:1971 shift:($dx,$dy)    color:SPÖ    text:Kreisky I
  from:1971  till:1975 shift:($dx,$dy)    color:SPÖ    text:Kreisky II
  from:1975  till:1979 shift:($dx,$dy)    color:SPÖ    text:Kreisky III
  from:1979  till:1983 shift:($dx,$dy)    color:SPÖ    text:Kreisky IV
  from:1983  till:1986 shift:($dx,$dy)    color:SPÖ    text:Sinowatz
  from:1986  till:1987 shift:($dx,$dy)    color:SPÖ    text:Vranitzky I
  from:1987  till:1990 shift:($dx,$dy)    color:SPÖ    text:Vranitzky II
  from:1990  till:1994 shift:($dx,$dy)    color:SPÖ    text:Vranitzky III
  from:1994  till:1996 shift:($dx,$dy)    color:SPÖ    text:Vranitzky IV
  from:1996  till:1997 shift:($dx,$dy)    color:SPÖ    text:Vranitzky V
  from:1997  till:2000 shift:($dx,$dy)    color:SPÖ    text:Klima
  from:2000  till:2003 shift:($dx,$dy)    color:ÖVP    text:Schüssel I
  from:2003  till:end shift:($dx,$dy)    color:ÖVP    text:Schüssel II
| Liberales Forum | top next |

Initial version by 80.109.117.16 on Saturday, January 7, 2006
ImageSize  = width:400 height:300
PlotArea   = width:350  height:250 left:50 bottom:50
Legend    = columns:3 left:50 top:25 columnwidth:50

DateFormat = yyyy
Period     = from:1993 till:2006
TimeAxis   = orientation:vertical
ScaleMajor = unit:year increment:2 start:1993

# there is no automatic collision detection,
# so shift texts up or down manually to avoid overlap

Colors=
  id:LiF  value:skyblue    legend:LiF
  id:SPÖ  value:red    legend:SPÖ
  id:ÖVP  value:gray(0.25) legend:ÖVP

Define $dx = 25 # shift text to right side of bar
Define $dy = -4 # adjust height

PlotData=


  bar:BS color:red width:25 mark:(line,white) align:left fontsize:S

  from:1993  till:2000 shift:($dx,$dy)    color:LiF    text:[[Heide Schmidt]]
  from:2000  till:2000 shift:($dx,$dy)    color:LiF    text:[[Christian Köck]]
  from:2000  till:2001 shift:($dx,$dy)    color:LiF    text:[[Friedhelm Frischenschlager]]
  from:2001  till:end  shift:($dx,$dy)    color:LiF    text:[[Alexander Zach]]

  bar:BReg color:red width:25 mark:(line,white) align:left fontsize:7

  from:1993  till:1994 shift:($dx,$dy)    color:SPÖ    text:Vranitzky III
  from:1994  till:1996 shift:($dx,$dy)    color:SPÖ    text:Vranitzky IV
  from:1996  till:1997 shift:($dx,$dy)    color:SPÖ    text:Vranitzky V
  from:1997  till:2000 shift:($dx,$dy)    color:SPÖ    text:Klima
  from:2000  till:2003 shift:($dx,$dy)    color:ÖVP    text:Schüssel I
  from:2003  till:end shift:($dx,$dy)     color:ÖVP    text:Schüssel II
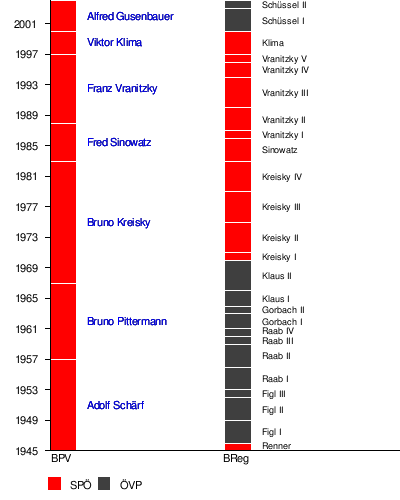
| Sozialdemokratische Partei Österreichs | top next |
Initial version by Friedrich.Kromberg on Tuesday, July 6, 2004
ImageSize  = width:400 height:500
PlotArea   = width:350  height:450 left:50 bottom:50
Legend    = columns:3 left:50 top:25 columnwidth:50

DateFormat = yyyy
Period     = from:1945 till:2004
TimeAxis   = orientation:vertical
ScaleMajor = unit:year increment:4 start:1945

# there is no automatic collision detection,
# so shift texts up or down manually to avoid overlap

Colors=
  id:SPÖ  value:red    legend:SPÖ
  id:ÖVP  value:gray(0.25) legend:ÖVP

Define $dx = 25 # shift text to right side of bar
Define $dy = -4 # adjust height

PlotData=


  bar:BPV color:red width:25 mark:(line,white) align:left fontsize:S

  from:1945  till:1957 shift:($dx,$dy)    color:SPÖ    text:[[Adolf Schärf]]
  from:1957  till:1967 shift:($dx,$dy)    color:SPÖ    text:[[Bruno Pittermann]]
  from:1967  till:1983 shift:($dx,$dy)    color:SPÖ    text:[[Bruno Kreisky]]
  from:1983  till:1988 shift:($dx,$dy)    color:SPÖ    text:[[Fred Sinowatz]]
  from:1988  till:1997 shift:($dx,$dy)    color:SPÖ    text:[[Franz Vranitzky]]
  from:1997  till:2000 shift:($dx,$dy)    color:SPÖ    text:[[Viktor Klima]]
  from:2000  till:end shift:($dx,$dy)    color:SPÖ    text:[[Alfred Gusenbauer]]

  bar:BReg color:red width:25 mark:(line,white) align:left fontsize:7

  from:1945  till:1946 shift:($dx,-2)    color:SPÖ    text:Renner
  from:1946  till:1949 shift:($dx,$dy)    color:ÖVP    text:Figl I
  from:1949  till:1952 shift:($dx,$dy)    color:ÖVP    text:Figl II
  from:1952  till:1953 shift:($dx,$dy)    color:ÖVP    text:Figl III
  from:1953  till:1956 shift:($dx,$dy)    color:ÖVP    text:Raab I
  from:1956  till:1959 shift:($dx,$dy)    color:ÖVP    text:Raab II
  from:1959  till:1960 shift:($dx,$dy)    color:ÖVP    text:Raab III
  from:1960  till:1961 shift:($dx,-2)    color:ÖVP    text:Raab IV
  from:1961  till:1963 shift:($dx,$dy)    color:ÖVP    text:Gorbach I
  from:1963  till:1964 shift:($dx,$dy)    color:ÖVP    text:Gorbach II
  from:1964  till:1966 shift:($dx,$dy)    color:ÖVP    text:Klaus I
  from:1966  till:1970 shift:($dx,$dy)    color:ÖVP    text:Klaus II
  from:1970  till:1971 shift:($dx,$dy)    color:SPÖ    text:Kreisky I
  from:1971  till:1975 shift:($dx,$dy)    color:SPÖ    text:Kreisky II
  from:1975  till:1979 shift:($dx,$dy)    color:SPÖ    text:Kreisky III
  from:1979  till:1983 shift:($dx,$dy)    color:SPÖ    text:Kreisky IV
  from:1983  till:1986 shift:($dx,$dy)    color:SPÖ    text:Sinowatz
  from:1986  till:1987 shift:($dx,$dy)    color:SPÖ    text:Vranitzky I
  from:1987  till:1990 shift:($dx,$dy)    color:SPÖ    text:Vranitzky II
  from:1990  till:1994 shift:($dx,$dy)    color:SPÖ    text:Vranitzky III
  from:1994  till:1996 shift:($dx,$dy)    color:SPÖ    text:Vranitzky IV
  from:1996  till:1997 shift:($dx,$dy)    color:SPÖ    text:Vranitzky V
  from:1997  till:2000 shift:($dx,$dy)    color:SPÖ    text:Klima
  from:2000  till:2003 shift:($dx,$dy)    color:ÖVP    text:Schüssel I
  from:2003  till:end shift:($dx,$dy)    color:ÖVP    text:Schüssel II
| Dark Wave | top next |

First version by Nergal on Thursday, January 19, 2006, last update on Tuesday, May 9, 2006
TimeAxis  = orientation:horizontal format:yyyy
ImageSize = width:820 height:340
PlotArea  = width:780 height:300 bottom:30 left:20

Colors =
  id:canvas value:rgb(0.97,0.97,0.97)
  id:grid   value:rgb(0.86,0.86,0.86)
  id:bars   value:gray(0.85)

BackgroundColors = canvas:canvas

Period     = from:1978 till:2006
ScaleMajor = unit:year increment:1 start:1978 gridcolor:grid

BarData=
  barset:genre

PlotData=

# set defaults
  width:25 fontsize:M textcolor:black align:left anchor:from shift:(10,-5) color:bars

  barset:genre

  from:1978 till:1994 text:"e l e c t r o   w a v e"
  from:1979 till:1984 text:"g o t h i c   p u n k"
  from:1980 till:1990 text:"c o l d   w a v e"
  from:1983 till:1996 text:"g o t h i c   r o c k"
  from:1985 till:2006 text:"n e o f o l k"
  from:1986 till:2006 text:"e t h e r e a l"
  from:1987 till:2006 text:"n e o k l a s s i k"
  from:1989 till:1994 text:"n e u e   d e u t s c h e   t o d e s k u n s t"
| Österreichische Volkspartei | top next |

First version by Friedrich.Kromberg on Tuesday, July 6, 2004, last update on Friday, September 16, 2005
ImageSize  = width:400 height:500
PlotArea   = width:350  height:450 left:50 bottom:50
Legend    = columns:3 left:50 top:25 columnwidth:50

DateFormat = yyyy
Period     = from:1945 till:2004
TimeAxis   = orientation:vertical
ScaleMajor = unit:year increment:4 start:1945

# there is no automatic collision detection,
# so shift texts up or down manually to avoid overlap

Colors=
  id:ÖVP  value:gray(0.25) legend:ÖVP
  id:SPÖ  value:red    legend:SPÖ
#  id:FPÖ  value:blue    legend:FPÖ

Define $dx = 25 # shift text to right side of bar
Define $dy = -4 # adjust height

PlotData=


  bar:BPO color:red width:25 mark:(line,white) align:left fontsize:S


  from:1945  till:1945 shift:($dx,$dy)    color:ÖVP    text:[[Leopold Kunschak]]
  from:1945  till:1952 shift:($dx,$dy)    color:ÖVP    text:[[Leopold Figl]]
  from:1952  till:1960 shift:($dx,$dy)    color:ÖVP    text:[[Julius Raab]]
  from:1960  till:1963 shift:($dx,$dy)    color:ÖVP    text:[[Alfons Gorbach]]
  from:1963  till:1970 shift:($dx,$dy)    color:ÖVP    text:[[Josef Klaus]]
  from:1970  till:1971 shift:($dx,$dy)    color:ÖVP    text:[[Hermann Withalm]]
  from:1971  till:1975 shift:($dx,$dy)    color:ÖVP    text:[[Karl Schleinzer]]
  from:1975  till:1979 shift:($dx,$dy)    color:ÖVP    text:[[Josef Taus]]
  from:1979  till:1989 shift:($dx,$dy)    color:ÖVP    text:[[Alois Mock]]
  from:1989  till:1991 shift:($dx,$dy)    color:ÖVP    text:[[Josef Riegler]]
  from:1991  till:1995 shift:($dx,$dy)    color:ÖVP    text:[[Erhard Busek]]
  from:1995  till:end shift:($dx,$dy)    color:ÖVP    text:[[Wolfgang Schüssel]]

  bar:BReg color:red width:25 mark:(line,white) align:left fontsize:7

  from:1945  till:1946 shift:($dx,-2)    color:SPÖ    text:Renner
  from:1946  till:1949 shift:($dx,$dy)    color:ÖVP    text:Figl I
  from:1949  till:1952 shift:($dx,$dy)    color:ÖVP    text:Figl II
  from:1952  till:1953 shift:($dx,$dy)    color:ÖVP    text:Figl III
  from:1953  till:1956 shift:($dx,$dy)    color:ÖVP    text:Raab I
  from:1956  till:1959 shift:($dx,$dy)    color:ÖVP    text:Raab II
  from:1959  till:1960 shift:($dx,$dy)    color:ÖVP    text:Raab III
  from:1960  till:1961 shift:($dx,-2)    color:ÖVP    text:Raab IV
  from:1961  till:1963 shift:($dx,$dy)    color:ÖVP    text:Gorbach I
  from:1963  till:1964 shift:($dx,$dy)    color:ÖVP    text:Gorbach II
  from:1964  till:1966 shift:($dx,$dy)    color:ÖVP    text:Klaus I
  from:1966  till:1970 shift:($dx,$dy)    color:ÖVP    text:Klaus II
  from:1970  till:1971 shift:($dx,$dy)    color:SPÖ    text:Kreisky I
  from:1971  till:1975 shift:($dx,$dy)    color:SPÖ    text:Kreisky II
  from:1975  till:1979 shift:($dx,$dy)    color:SPÖ    text:Kreisky III
  from:1979  till:1983 shift:($dx,$dy)    color:SPÖ    text:Kreisky IV
  from:1983  till:1986 shift:($dx,$dy)    color:SPÖ    text:Sinowatz
  from:1986  till:1987 shift:($dx,$dy)    color:SPÖ    text:Vranitzky I
  from:1987  till:1990 shift:($dx,$dy)    color:SPÖ    text:Vranitzky II
  from:1990  till:1994 shift:($dx,$dy)    color:SPÖ    text:Vranitzky III
  from:1994  till:1996 shift:($dx,$dy)    color:SPÖ    text:Vranitzky IV
  from:1996  till:1997 shift:($dx,$dy)    color:SPÖ    text:Vranitzky V
  from:1997  till:2000 shift:($dx,$dy)    color:SPÖ    text:Klima
  from:2000  till:2003 shift:($dx,$dy)    color:ÖVP    text:Schüssel I
  from:2003  till:end shift:($dx,$dy)    color:ÖVP    text:Schüssel II
| Nationaldemokratische Partei Deutschlands | top next |

First version by Denny on Friday, September 17, 2004, last update on Saturday, January 21, 2006
ImageSize  = width:265 height:500
PlotArea   = width:115 height:480 left:40 bottom:10
Colors =
  id:lightyellow value:rgb(1,1,0.8)

DateFormat = yyyy
Period     = from:1965 till:2005
TimeAxis   = orientation:vertical
ScaleMajor = unit:year increment:1 start:1965
BackgroundColors = canvas:white
Define $dx = 20 # shift text to right side of bar

PlotData =
  bar:Chairmen color:orange width:25 mark:(line,blue) align:left fontsize:S

  from:start till:1965 shift:($dx,-5) text:[[Bundestagswahl 1965]] 2,0%
  from:1966  till:1966 shift:($dx,0)  text:
  from:1967  till:1967 shift:($dx,0)  text:
  from:1968  till:1968 shift:($dx,0)  text:
  from:1969 till:1969 shift:($dx,-1) text:[[Bundestagswahl 1969]] 4,3%
  from:1970 till:1970 shift:($dx,0)  text:
  from:1971 till:1971 shift:($dx,0)  text:
  from:1972 till:1972 shift:($dx,0)  text:[[Bundestagswahl 1972]] 0,6%
  from:1976 till:1976 shift:($dx,0)  text:[[Bundestagswahl 1976]] 0,3%
  from:1980 till:1980 shift:($dx,0)  text:[[Bundestagswahl 1980]] 0,2%
  from:1983 till:1983 shift:($dx,0)  text:[[Bundestagswahl 1983]] 0,2%
  from:1987  till:1987 shift:($dx,-5) text:[[Bundestagswahl 1987]] 0,6%
  from:1990  till:1990 shift:($dx,0)  text:[[Bundestagswahl 1990]] 0,3%
  from:1998  till:1998 shift:($dx,0)  text:[[Bundestagswahl 1998]] 0,3%
  from:2002  till:2002 shift:($dx,0)  text:[[Bundestagswahl 2002]] 0,4%
  from:2005  till:2005 shift:($dx,0)  text:[[Bundestagswahl 2005]] 1,6%
| Theben (Ägypten) | top next |

First version by Schuppi on Tuesday, November 30, 2004, last update on Sunday, December 5, 2004
ImageSize  = width:600 height:465
PlotArea   = width:600 height:465 left:0 bottom:0
TimeAxis  = orientation:horizontal # dummy, required
Period    = from:0 till:600 # dummy, required
Define $s = fontsize:M
Colors =
  id:blue     value:blue
  id:green    value:green
  id:yellow   value:yellow
BackgroundColors = bars:blue
PlotData=
  bar:u18 from:start      till:523 color:yellow
          from:524        till:562 color:green
          from:563        till:600 color:blue
  bar:u17 from:start      till:511 color:yellow
          from:512        till:549 color:green
          from:550        till:600 color:blue
  bar:u16 from:start      till:485 color:yellow
          from:486        till:536 color:green
          from:537        till:600 color:blue
  bar:u15 from:start      till:472 color:yellow
          from:472        till:523 color:green
          from:524        till:587 color:blue
          from:588        till:600 color:green
  bar:u14 from:start      till:447 color:yellow
          from:447        till:511 color:green
          from:512        till:574 color:blue
          from:575        till:600 color:green
  bar:u13 from:start      till:434 color:yellow
          from:434        till:498 color:green
          from:499        till:549 color:blue
          from:550        till:600 color:green
  bar:u12 from:start      till:409 color:yellow
          from:410        till:491 color:green
          from:492        till:536 color:blue
          from:537        till:600 color:green
  bar:u11 from:start      till:383 color:yellow
          from:384        till:485 color:green
          from:486        till:523 color:blue
          from:524        till:600 color:green
  bar:u10 from:start      till:281 color:yellow
          from:282        till:485 color:green
          from:486        till:523 color:blue
          from:524        till:600 color:green
  bar:u9  from:start      till:255 color:yellow
          from:256        till:485 color:green
          from:486        till:523 color:blue
          from:524        till:600 color:green
  bar:u8  from:start      till:204 color:yellow
          from:205        till:472 color:green
          from:473        till:511 color:blue
          from:512        till:600 color:green
  bar:u7  from:start      till:191 color:yellow
          from:192        till:460 color:green
          from:461        till:498 color:blue
          from:499        till:600 color:green
  bar:u6  from:start      till:140 color:yellow
          from:141        till:447 color:green
          from:448        till:485 color:blue
          from:486        till:600 color:green
  bar:u5  from:start      till:140 color:yellow
          from:141        till:434 color:green
          from:435        till:472 color:blue
          from:473        till:600 color:green
  bar:u4  from:start      till:109 color:yellow
          from:110        till:409 color:green
          from:410        till:460 color:blue
          from:461        till:600 color:green
  bar:u3  from:start      till:89  color:yellow
          from:90         till:383 color:green
          from:384        till:434 color:blue
          from:435        till:600 color:green
  bar:u2  from:start      till:58  color:yellow
          from:59         till:358 color:green
          from:359        till:415 color:blue
          from:416        till:600 color:green
  bar:u1  from:start      till:25  color:yellow
          from:26         till:332 color:green
          from:333        till:396 color:blue
          from:397        till:600 color:green

TextData  =
  pos:(500,167)$s text:o [[Karnak-Tempel]]
  pos:(421,44)$s text:o [[Luxor-Tempel]]
  pos:(178,289)$s text:o [[Tal der Könige]]
  pos:(217,267)$s text:o [[Deir el-Bahari]]
  pos:(319,256)$s text:o [[Dra Abu el-Naga]]
  pos:(242,205)$s text:o [[Ramesseum]]
  pos:(178,225)$s text:o [[Deir el-Medina]]
  pos:(127,211)$s text:o [[Tal der Königinnen]]
  pos:(230,167)$s text:o [[Memnonkolosse]]
  pos:(242,244)$s text:o [[el-Asasif]]
  pos:(179,151)$s text:o [[Medinet Habu]]
  pos:(100,244)$s text:[[Schech Abd el-Korna]] o
  pos:(204,190)$s text:o [[Kurnet Murai]]
  pos:(383,233)$s text:o [[Qurna]]

TextData  =
  pos:(470,80) fontsize:XL text:[[Luxor]]
  pos:(460,60) fontsize:XL text:[[Theben-Ost]]
  pos:(500,360) fontsize:XL text:[[Nil]]->
  pos:(250,120) fontsize:XL text:[[Theben-West]]
| Dürre | top next |

First version by Kku on Sunday, April 17, 2005, last update on Monday, July 24, 2006
ImageSize = width:550 height:90
PlotArea = width:530 height:70 left:10 bottom:20

DateFormat = yyyy
Period = from:900 till:2005
TimeAxis = orientation:horizontal
ScaleMajor = unit:year increment:100 start:900

Define $dx = 25 # shift text to right side of bar

PlotData=
  bar:Leadors color:red width:15 mark: (line,white) align:left fontsize:S

  from:987 till:987 shift:(-30,5) text:[[987]]
  from:993 till:994 shift:(-30,15) text:[[993]]-[[994]]
  from:999 till:999 shift:(-30,25) text:[[999]]
  from:1000  till:1000 shift:(-30,35) text:[[1000]]
  from:1004  till:1005 shift:(-30,45) text:[[1004]]-1005
  from:1007  till:1007 shift:(-30,55) text:[[1007]]
  from:1056  till:1056 shift:(-30,5) text:[[1056]]
  from:1387  till:1387 shift:(-30,5) text:[[1387]]

  from:1473  till:1473 shift:(-30,8) text:[[1473]]
  from:1540 till:1540 shift:(-30,5) text:[[1540]]
  from:1676  till:1676 shift:(-30,5) text:[[1676]]
  from:1683  till:1683 shift:(-30,15) text:[[1683]]
  from:1718  till:1718 shift:(-30,25) text:[[1718]]
  from:1857  till:1857 shift:(-30,5) text:[[1857]]
  from:2003  till:2003  shift:(-30,5) text:[[2003]]
| Liberal-Demokratische Partei Deutschlands | top next |

First version by Sebastian Wallroth on Monday, January 24, 2005, last update on Tuesday, January 25, 2005
ImageSize  = width:250 height:380
PlotArea   = width:200 height:340 left:40 bottom:10
Colors     =
 id:lightgrey value:gray(0.9)
DateFormat = yyyy
Period     = from:1945 till:1990
TimeAxis   = orientation:vertical
ScaleMajor = unit:year increment:5 start:1945
ScaleMinor = unit:year increment:1 start:1945 gridcolor:lightgrey

TextData =
  pos:(5,375) fontsize:M
  text:Vorsitzende der LDPD, Zeitleiste

PlotData=
  bar:Leaders color:orange width:15 mark:(line,black) align:left fontsize:S

  from:start till:1945 shift:(15,-5)   text:Waldemar Koch
  from:1945  till:1948 shift:(15,-2)   text:Wilhelm Külz
  from:1948  till:1949 shift:(15,-4)   text:Arthur Lieutenant
  from:1949  till:1952 shift:(15,0)   text:Karl Hamann, Hermann Kastner
  from:1952  till:1960 shift:(15,0)   text:Hans Loch
  from:1960  till:1967 shift:(15,0)   text:Max Suhrbier
  from:1967  till:1989 shift:(15,0)   text:Manfred Gerlach
  from:1989  till:end shift:(15,-5)   text:Rainer Ortleb
| Geschichte Hamburgs | top next |

First version by Ctsu on Tuesday, June 7, 2005, last update on Saturday, July 29, 2006
ImageSize  = width:280 height:540
PlotArea   = left:40 right:10 bottom:10 top:10
TimeAxis   = orientation:vertical
DateFormat = yyyy
Period     = from:0600 till:2010
AlignBars  = early
ScaleMajor = unit:year increment:200 start:0600
Colors =
  id:blue1 value:rgb(0.2,0.2,0.4)
  id:blue2 value:rgb(0.35,0.35,0.7)
  id:blue3 value:rgb(0.5,0.5,1)
  id:blue4 value:rgb(0.65,0.65,1)
  id:blue5 value:rgb(0.8,0.8,1)

# there is no automatic collision detection,
# so shift texts up or down manually to avoid overlap
Define $dx = 20 # shift text to right side of bar

PlotData =
  bar:events width:20 shift:($dx,-4)

  from:0600 till:0810 color:blue1
  from:0810 till:1189 color:blue2
  from:1189 till:1529 color:blue3
  from:1529 till:1842 color:blue4
  from:1842 till:2010 color:blue5

  mark:(line,white)
  at:0600 text:"Besiedlung durch Sachsen
  at:0810 text:"[[Hammaburg]] (810)"
  at:1035 text:"Mariendom (1035)"
  at:1189 text:"Hafen- und Marktrecht (1189)"
  at:1383 text:"Hochaltar St. Petri (1383)" shift:($dx,-8)
  at:1401 text:"[[Störtebeker|Enthauptung Störtebekers]] (1401)"
  at:1529 text:"evangelische Kirchenordnung (1529)"
  at:1619 text:"eine der größten Städte Deutschlands (1619)"
  at:1712 text:"Hauptrezess (1712)"
  at:1806 text:"[[Hamburger Franzosenzeit|Franzosenzeit]] (1806-14)"
  at:1842 text:"[[Hamburger Brand|großer Brand]] (1842)"
  at:1871 text:"Bundesstaat (1871)"
  at:1943 text:"[[Operation Gomorrah|Bombennächte]] (1943)" shift:($dx,-8)
  at:1962 text:"[[Sturmflut 1962|Sturmflut]] (1962)"
| Holozän | top next |

First version by Geofriese on Wednesday, January 11, 2006, last update on Friday, January 13, 2006
ImageSize   = width:670 height:150
PlotArea    = width:580 height:125 left:70 bottom:25
AlignBars   = justify

Colors =
  id:eisen         value:rgb(0.8,0.9,0.8)
  id:bronze        value:rgb(1,0.7,0.2)
  id:neolith       value:rgb(0.6,0.9,0.6)
  id:jmesol        value:rgb(0.5,0.8,0.5)
  id:aemesol       value:rgb(0.4,0.7,0.4)
  id:subatlant     value:rgb(0.7,0.7,0.2)
  id:subbor        value:rgb(0.7,0.8,0.8)
  id:atlant        value:rgb(0.9,0.9,0.2)
  id:boreal        value:rgb(0.7,0.886,0.819)
  id:praebor       value:rgb(0.5,0.7,0.8)
  id:epoche        value:rgb(1,1,0.1)
  id:black         value:black
  id:white         value:white


Period      = from:-9610    till:1950
TimeAxis    = orientation:horizontal
ScaleMajor  = unit:year increment:2000  start:-8000
ScaleMinor  = unit:year increment:500   start:-9500

TextData =
  pos:(10,10)  textcolor:black fontsize:8 text:Jahre

PlotData =
  align:center textcolor:black fontsize:8 #>mark:(line,black) width:25<# shift:(0,-5)

  bar:Subepoche #Dapeng Zhou (2005): Jungquartäre Talgeschichte des mittleren Niederrheins
  from: -9610   till: -7270  color:epoche  mark:(line,black)     text:Alt-Holozän
  from: -7270   till: -3710  color:epoche                        text:Mittel-Holozän *
  from: -3710   till: -2200  color:atlant                        text:
  at:   -2200                              mark:(line,black)
  from: -2200   till:  -450  color:atlant                        text:
  from:  -450   till:  1950  color:epoche                        text:Jung-Holozän *

  bar:Klimastufe #Geozentrum Hannover Stand: 05.2004
  from:  -450  till:  1950  color:subatlant mark:(line,black)    text:[[Subatlantikum]]
  from: -3710  till:  -450  color:subbor    mark:(line,black)    text:Subboreal
  from: -7270  till: -3710  color:atlant    mark:(line,black)    text:[[Atlantikum]]
  from: -8690  till: -7270  color:boreal    mark:(line,black)    text:Boreal
  from: -9610  till: -8690  color:praebor   mark:(line,black)    text:[[Präboreal]]

  bar:Nordsee #Meyers Großes Taschenlexikon in 24 Bänden 1990 (aus Grafik)
  from:     0  till:  1950  color:subatlant  text:Dünkirchen Tr.
  from: -4000  till:     0  color:subbor     text:Meeresrückzug bzw. Stillstand
  from: -8690  till: -4000  color:atlant     text:Flandr. Transgression

  bar:Ostsee #Meyers Großes Taschenlexikon in 24 Bänden 1990
  from:   600  till:  1950  color:white    text:Myameer
  from: -2200  till:   600  color:eisen    text:Lymneameer
  from: -4800  till: -2200  color:atlant   text:Litorinameer
  from: -7500  till: -4800  color:boreal   text:[[Ancylussee]] *
  from: -9610  till: -7500  color:praebor  text:[[Yoldia-Meer]] *

  bar:Kulturstufe* #Geozentrum Hannover Stand: 05.2004
  from:     0  till:  1950  color:white             text: histor. Zeit
  from:  -800  till:     0  color:eisen             text:[[Eisenzeit]]
  from: -2200  till:  -800  color:bronze       text:[[Bronzezeit]]
  from: -3500  till: -2200  color:neolith      text:[[Neolithikum]]
  from: -4500  till: -3500  color:jmesol
  from: -9000  till: -4500  color:aemesol        text:[[Mesolithikum]]
| Tour de France 2004 | top next |

First version by Trash:Pet on Sunday, October 2, 2005, last update on Monday, July 3, 2006
ImageSize  = width:480 height:600
PlotArea   = left:25 right:0 bottom:20 top:10
DateFormat = yyyy
Period     = from:-1 till:20
TimeAxis   = orientation:vertical order:reverse
ScaleMajor = gridcolor:white unit:year increment:1 start:0

Colors =
  id:alggeel    value:rgb(1,1,0.4)
  id:bergrood   value:rgb(1,0.5,0.5)
  id:puntgroen  value:rgb(0.7,1,0.5)
  id:lichtgrijs value:rgb(0.95,0.95,0.95)

PlotData=

  bar:Gesamtwertung color:alggeel width:110 mark:(line,black) align:center fontsize:S shift:(0,2)
  # shift texts up or down manually to avoid overlap
  from:-1  till:1  text:[[Fabian Cancellara]]
  from:1  till:2  text:[[Thor Hushovd]]
  from:2  till:3  text:[[Robbie McEwen]]
  from:3  till:4  text:[[Lance Armstrong]]
  from:4  till:14  text:[[Thomas Voeckler]]
  from:14  till:20 text:[[Lance Armstrong]]

  bar:Sprintwertung color:puntgroen
  # shift texts up or down manually to avoid overlap
  from:-1  till:0  text:[[Fabian Cancellara]]
  from:0  till:2  text:[[Thor Hushovd]]
  from:2  till:5  text:[[Robbie McEwen]]
  from:5 till:7  text:[[Stuart O'Grady]]
  from:7  till:20  text:[[Robbie McEwen]]

  bar:Bergwertung color:bergrood
  # shift texts up or down manually to avoid overlap
  from:-1  till:0  text:Nicht vergeben
  from:0  till:9  text:[[Paolo Bettini]]
  from:9  till:20  text:[[Richard Virenque]]

  bar:Nachwuchswertung color:lichtgrijs
  # shift texts up or down manually to avoid overlap
  from:-1  till:3  text:[[Fabian Cancellara]]
  from:3  till:4  text:[[Matthias Kessler]]
  from:4  till:18  text:[[Thomas Voeckler]]
  from:18  till:20  text:[[Vladimir Karpets]]
| Nürtingen | top next |

First version by Valentin Dietrich on Saturday, October 1, 2005, last update on Monday, June 19, 2006
ImageSize	= width:250 height:800
PlotArea	= left:40 right:0 bottom:80 top:20
Legend		= columns:1 left:40 top:60

DateFormat	= yyyy
Period		= from:1819 till:2006
TimeAxis	= orientation:vertical format:yyyy

ScaleMajor	= unit:year increment:5 start:1819

Colors=
 id:FWV	value:blue	legend:Freie_Wählervereinigung
 id:SPD value:red	legend:SPD
 id:NSDAP value:rgb(0.54,0.27,0.07)	legend:NSDAP
 id:NO  value:black	legend:nicht_bekannt

PlotData=
 bar:OBs_Nuertingen color:NO width:20 fontsize:M align:left shift:(20,-5) mark:(line,white)

 from:start till:1828 fontsize:S text:Gottlob_Friedrich_Schickhardt
 from:1828 till:1846 text:Heinrich_Schickhardt
 from:1846 till:1868 text:Dr._Karl_Friedrich_Eßig
 from:1868 till:1896 text:Ferdinand_Schmid
 from:1896 till:1930 text:Matthäus_Baur
 from:1930 till:1939 text:Hermann_Weilenmann
 from:1939 till:1943 text:Dr._Walter_Klemm color:NSDAP
 from:1943 till:1945 text:August_Pfänder,_kommissarisch color:NSDAP
 from:1945 till:1948 text:Hermann_Weilenmann
 from:1948 till:1959 text:August_Pfänder
 from:1959 till:1979 text:Karl_Gonser
 from:1979 till:2004 text:Alfred_Bachofer color:FWV
 from:2004 till:end text:Otmar_Heirich color:SPD
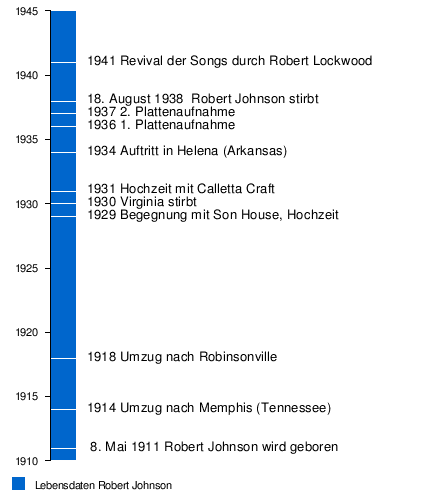
| Robert Johnson | top next |
First version by Necrophorus on Wednesday, June 2, 2004, last update on Monday, April 3, 2006
ImageSize = width:430 height:500
PlotArea = width:350 height:450 left:50 bottom:40
Legend = columns:1 left:15 top:25 columnwidth:50
AlignBars = early

DateFormat = yyyy
Period = from:1910 till:1945
TimeAxis = orientation:vertical
ScaleMajor = unit:year increment:5 start:1910

Colors=
  id:Basis  value:blue legend:Lebensdaten_Robert_Johnson

Define $left1 = shift:( 25,-3) align:left

PlotData=
  bar:Leaders width:25 mark:(line,white) align:left fontsize:M color:Basis

  from:start till:end # bar

  at:1911 $left1  text: 8. Mai 1911 Robert Johnson wird geboren
  at:1914 $left1  text:1914 Umzug nach Memphis (Tennessee)
  at:1918 $left1  text:1918 Umzug nach Robinsonville
  at:1929 $left1  text:1929 Begegnung mit Son House, Hochzeit
  at:1930 $left1  text:1930 Virginia stirbt
  at:1931 $left1  text:1931 Hochzeit mit Calletta Craft
  at:1934 $left1  text:1934 Auftritt in Helena (Arkansas)
  at:1936 $left1  text:1936 1. Plattenaufnahme
  at:1937 $left1  text:1937 2. Plattenaufnahme
  at:1938 $left1  text:18. August 1938  Robert Johnson stirbt
  at:1941 $left1  text:1941 "Revival" der Songs durch Robert Lockwood
| Allgemeines bürgerliches Gesetzbuch | top next |

First version by Friedrich.Kromberg on Saturday, July 3, 2004, last update on Thursday, November 18, 2004
DateFormat = yyyy
ImageSize  = width:800 height:240
PlotArea   = left:100 right:140 bottom:95 top:25
Legend     = columns:4 left:100 top:50 columnwidth:100

Colors     =
  id:canvas      value:rgb(0.97,0.97,0.97)
  id:grid1       value:rgb(0.80,0.80,0.80)
  id:grid2       value:rgb(0.86,0.86,0.86)
  id:grau        value:gray(0.7)
  id:einteilung  value:gray(0.25) # legend:Einteilung
  id:PersonenR   value:yellow legend:PersonenR
  id:FamilienR   value:red legend:FamilienR
  id:SachenR     value:green legend:SachenR
  id:ErbR        value:orange legend:ErbR
  id:SchuldR     value:blue legend:SchuldR


Period     = from:1 till:1502
TimeAxis   = orientation:horizontal format:yyyy
ScaleMajor = unit:year  increment:100 start:1 gridcolor:grid1
AlignBars  = justify

BackgroundColors = canvas:canvas bars:canvas

BarData=
  bar:1  text:"Rechtsgebiete"
  bar:2  text:"Einteilung ABGB"
  bar:3  text:
  barset:bs1
  bar:4  text:_
  bar:5  text:_

PlotData=
  width:12 fontsize:S mark:(line,white)

  bar:1 align:center color:red
  from:1      till:15     color:einteilung
  from:15     till:44     color:PersonenR
  from:44     till:285    color:FamilienR
  from:285    till:531    color:SachenR
  from:531    till:859    color:ErbR
  from:859    till:1342   color:SchuldR
  from:1342   till:end    color:einteilung


  bar:2 align:center shift:(0,-3)
  from:start  till:end color:grau # Hintergrund
  from:1      till:15     color:einteilung
  from:15     till:285    color:einteilung
  from:285    till:1342   color:einteilung
  from:1342   till:end    color:einteilung


#  bar:3 align:center shift:(0,-3)
#  from:start  till:end color:grau # Hintergrund
#  from:1      till:15     color:einteilung
#  from:15     till:44     color:einteilung
#  from:44     till:100    color:einteilung
#  from:100    till:137    color:grau
#  from:1342  till:end    color:einteilung

  barset:bs1
  fontsize:S textcolor:black align:left shift:(0,0)
  at:1    text:"Einleitung"  shift:(3,0)
  at:14   text:"I. Teil. Von dem Personenrechte"
  at:285  text:"II. Teil. Von dem Sachenrechte"
  at:1342 text:"III. Teil. Von den~gemeinschaftlichen Bestimmungen~der Personen- und Sachenrechte"

  bar:4
  bar:5
| Österreichisches Bundesheer | top next |

First version by Friedrich.Kromberg ? on Sunday, July 4, 2004, last update on Monday, May 15, 2006
ImageSize  = width:420 height:350
PlotArea   = width:330  height:250 left:50 bottom:70
Legend    = columns:1 left:52 top:40 columnwidth:100

DateFormat = yyyy
Period     = from:1 till:8000
TimeAxis   = orientation:vertical
ScaleMajor = unit:year increment:1000 start:1000
Colors=
  id:Ausland  value:blue legend:Vergleichsstaaten
  id:AT       value:red  legend:Österreich

PlotData=
  width:25 mark:(line,white) align:left fontsize:7

  color:Ausland
  bar:China from:1 till:1909
  bar:USA   from:1 till:4885
  bar:Ru    from:1 till:6795
  bar:D     from:1 till:4037
  bar:F     from:1 till:4865
  bar:UK    from:1 till:3484
  bar:A     from:1 till:4281 color:AT
  bar:CH    from:1 till:4484

TextData=
  pos:(140,310) text:"Aktivstand: Soldaten pro 1 Mio. Bürger"
| Österreichisches Bundesheer | top next |

First version by Friedrich.Kromberg ? on Sunday, July 4, 2004, last update on Monday, May 15, 2006
ImageSize  = width:420 height:350
PlotArea   = width:330  height:250 left:50 bottom:70
Legend     = columns:1 left:52 top:40 columnwidth:100

DateFormat = yyyy
Period     = from:1 till:1000
TimeAxis   = orientation:vertical
ScaleMajor = unit:year increment:100 start:100

Colors=
  id:Ausland  value:blue legend:Vergleichsstaaten
  id:AT  value:red    legend:Österreich

PlotData=
  width:25 mark:(line,white) align:left fontsize:7

  color:Ausland
  bar:China from:1 till:8
  bar:USA   from:1 till:870
  bar:Ru    from:1 till:306
  bar:D     from:1 till:291
  bar:F     from:1 till:488
  bar:UK    from:1 till:572
  bar:A     from:1 till:183 color:AT
  bar:CH    from:1 till:378

TextData=
  pos:(205,310) text:"Ausgaben in US-$ pro Bürger und"
| Österreichisches Bundesheer | top next |

First version by Friedrich.Kromberg ? on Sunday, July 4, 2004, last update on Monday, May 15, 2006
ImageSize  = width:500 height:540
PlotArea   = left:50 right:0 top:20 bottom:70
Legend     = columns:3 left:52 top:45 columnwidth:50

DateFormat = yyyy
Period     = from:1956 till:2006
TimeAxis   = orientation:vertical
ScaleMajor = unit:year increment:2 start:1956

# there is no automatic collision detection,
# so shift texts up or down manually to avoid overlap

Colors=
  id:ÖVP        value:gray(0.25)          legend:ÖVP
  id:SPÖ        value:red                 legend:SPÖ
  id:FPÖ        value:blue                legend:FPÖ
  id:parteilos  value:rgb(0.75,0.75,0.75) legend:parteilos
  id:BH         value:green              #legend:

Define $dx = 25 # shift text to right side of bar

PlotData=

  color:red width:25 mark:(line,white) align:left fontsize:7 shift:($dx,0)

  bar:BMfLV

  from:1956  till:1961 color:ÖVP       text:[[Ferdinand Graf]]
  from:1961  till:1964 color:ÖVP       text:[[Karl Schleinzer]]
  from:1964  till:1970 color:ÖVP       text:[[Georg Prader]]
  from:1970  till:1971 color:parteilos text:[[Johann Freihsler]]
  from:1971  till:1977 color:parteilos text:[[Karl Lütgendorf]]
  from:1977  till:1983 color:SPÖ       text:[[Otto Rösch]]
  from:1983  till:1986 color:FPÖ       text:[[Friedhelm Frischenschlager]]
  from:1986  till:1987 color:FPÖ       text:[[Helmut Krünes]]
  from:1987  till:1990 color:ÖVP       text:[[Robert Lichal]]
  from:1990  till:2000 color:ÖVP       text:[[Werner Fasslabend]]
  from:2000  till:2003 color:FPÖ       text:[[Herbert Scheibner]]
  from:2003  till:end  color:ÖVP       text:[[Günther Platter]]


  bar:Ranghöchster_Offizier

  from:1956  till:1970 color:BH text:[[Ranghöchste_Offiziere_des_BH_seit_1956|Erwin Fussenegger]]
  from:1970  till:1971 color:BH text:[[Ranghöchste_Offiziere_des_BH_seit_1956|Otto Seitz]]
  from:1971  till:1977 color:BH text:[[Ranghöchste_Offiziere_des_BH_seit_1956|Anton Leeb]]
  from:1977  till:1981 color:BH text:[[Ranghöchste_Offiziere_des_BH_seit_1956|Hubert Wingelbauer]]
  from:1981  till:1986 color:BH text:[[Ranghöchste_Offiziere_des_BH_seit_1956|Heinz Scharff]]
  from:1986  till:1990 color:BH text:[[Ranghöchste_Offiziere_des_BH_seit_1956|Othmar Tauschitz]]
  from:1990  till:1999 color:BH text:[[Ranghöchste_Offiziere_des_BH_seit_1956|Karl Majcen]]
  from:1999  till:2002 color:BH text:[[Ranghöchste_Offiziere_des_BH_seit_1956|Horst Pleiner]]
  from:2002  till:end  color:BH text:[[Roland Ertl]]
| Weinsberg | top next |

Initial version by Rosenzweig on Sunday, January 8, 2006
ImageSize  = width:830 height:200
PlotArea   = width:760 height:170 left:40 bottom:20
AlignBars  = late

DateFormat = yyyy
Period     = from:0 till:12000
TimeAxis   = orientation:vertical
ScaleMajor = unit:year increment:1000 start:0

PlotData=
  color:blue width:9
  bar:1525 from:start till:1200
  bar:1620 from:start till:1600
  bar:1640 from:start till:540
  bar:1670 from:start till:1060
  bar:1800 from:start till:1450
  bar:1810 from:start till:1634
  bar:1820 from:start till:1770
  bar:1830 from:start till:1904
  bar:1840 from:start till:2039
  bar:1845 from:start till:2148
  bar:1858 from:start till:2080
  bar:1900 from:start till:2479
  bar:1907 from:start till:3097
  bar:1920 from:start till:3389
  bar:1930 from:start till:3600
  bar:1939 from:start till:4555
  bar:1947 from:start till:5665
  bar:1952 from:start till:5837
  bar:1955 from:start till:8249
  bar:1960 from:start till:6979
  bar:1965 from:start till:6993
  bar:1970 from:start till:7392
  bar:1975 from:start till:8287
  bar:1980 from:start till:8799
  bar:1985 from:start till:9155
  bar:1990 from:start till:10009
  bar:1995 from:start till:11070
  bar:2000 from:start till:11350
  bar:2004 from:start till:11819

TextData=
  pos:(10,100) fontsize:S text:
| Abendländisches Schisma | top next |

First version by Gugganij on Wednesday, August 17, 2005, last update on Tuesday, April 18, 2006
ImageSize = width:600 height:180
PlotArea = width:460 height:109 left:80 bottom:71
AlignBars = justify

Colors =
  id:avignon value:rgb(0.6,1,1) legend:Avignon
  id:rome value:rgb(0.6,1,0.6) legend:Rom
  id:pisan value:rgb(1,1,0.6) legend:Pisa
  id:black value:black

Period = from:1378 till:1418
TimeAxis = orientation:horizontal
ScaleMajor = unit:year increment:10 start:1378
ScaleMinor = unit:year increment:1 start:1378

BarData =
  bar:title text:
  bar:Avignon text:
  bar:Rome text:
  bar:Pisan text:

PlotData =
  bar:title from:start till:end text:"Päpste des Abendländischen Schismas" align:center width:15 color:white fontsize:L

  align:center textcolor:black fontsize:S mark:(line,black) width:25 shift:(0,-5)


  bar:Avignon color:avignon
  from:1378.7 till:1394.7 text:[[Clemens VII. (Gegenpapst)|Clemens VII]]
  from:1394.7 till:1417.6 text:[[Benedikt XIII. (Gegenpapst)|Benedikt XIII]]

  bar:Rome color:rome
  from:1378.3 till:1389.8 text:[[Urban VI.|Urban VI]]
  from:1389.8 till:1404.8 text:[[Bonifatius IX.|Bonifatius IX]]
  from:1404.8 till:1406.9 text:"[[Innozenz VII.|Innozenz]]~[[Innozenz VII.|VII]]" shift:(0,1)
  from:1406.9 till:1415.5 text:"[[Gregor XII. (Papst)|Gregor XII]]" shift:(2,-5)

  bar:Pisan color:pisan
  from:1409.5 till:1410.3 text:"[[Alexander V. (Gegenpapst)|Alexander V]]" shift:(-31,-5)
  from:1410.3 till:1415.5 text:"[[Johannes XXIII. (Gegenpapst)|Johannes]]~[[Johannes XXIII. (Gegenpapst)|XXIII]]" shift:(0,1)

TextData =
  fontsize:8
  pos:(10,107) text:"[[Gregor XI.|Gregor XI]]"
  pos:(545,107) text:"[[Martin V.|Martin V]]"

Legend = orientation:horizontal position:bottom
| Lindlar | top next |

First version by JensD on Monday, June 27, 2005, last update on Friday, August 26, 2005
ImageSize  = width:550 height:120
PlotArea   = width:450 height:80 left:50 bottom:20
AlignBars  = late

DateFormat = yyyy
Period     = from:0 till:30000
TimeAxis   = orientation:vertical
ScaleMajor = unit:year increment:10000 start:0

PlotData=
  color:blue width:10
  bar:1816 from:start till:5050
  bar:1825 from:start till:5406
  bar:1828 from:start till:5430
  bar:1890 from:start till:6292
  bar:1922 from:start till:6670
  bar:1938 from:start till:6939
  bar:1946 from:start till:10339
  bar:1958 from:start till:11069
  bar:1968 from:start till:12837
  bar:1974 from:start till:13831
  bar:1990 from:start till:19307
  bar:1992 from:start till:19800
  bar:1995 from:start till:20945
  bar:1999 from:start till:21750
  bar:2002 from:start till:22581
  bar:2003 from:start till:22646
  bar:2004 from:start till:22714

TextData=
  pos:(20,110) fontsize:M text:
| Banjul | top next |

First version by Atamari on Sunday, April 17, 2005, last update on Tuesday, July 11, 2006
ImageSize  = width:238 height:120
PlotArea = width:80% height:70% left:20% bottom:20%
AlignBars  = late

DateFormat = yyyy
Period     = from:0 till:50000
TimeAxis   = orientation:vertical
ScaleMajor = increment:10000 start:0

PlotData=
  color:drabgreen
  bar:1963 from:start till:27809
  bar:1973 from:start till:39476
  bar:1983 from:start till:44188
  bar:1993 from:start till:42326
  bar:2003 from:start till:34828
# bar:2005 from:start till:34589 auskommentiert
  bar:2006 from:start till:34388

TextData=
  pos:(100,110) fontsize:M text:Einwohnerentwicklung
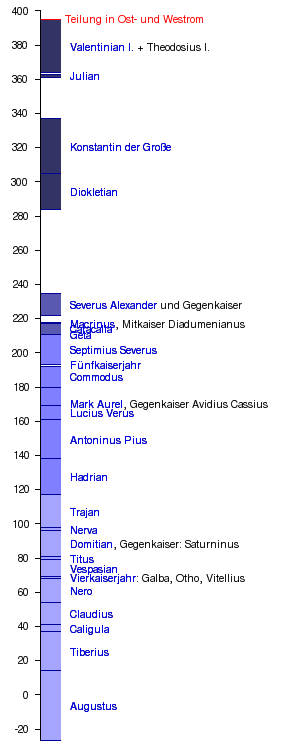
| Römische Kaiserzeit | top next |
Initial version by Thire on Saturday, May 27, 2006
ImageSize	= width:300 height:750
PlotArea	= width:250 height:730 left:40 bottom:10

DateFormat	= yyyy
Period		= from:-27 till:400
TimeAxis	= orientation:vertical format:yyyy

ScaleMajor	= unit:year increment:20 start:-20

Colors =
  id:blue4 value:rgb(0.2,0.2,0.4)
  id:blue3 value:rgb(0.35,0.35,0.7)
  id:blue2 value:rgb(0.5,0.5,1)
  id:blue1 value:rgb(0.65,0.65,1)

PlotData=
 bar:Prinzipat color:blue4 width:20 fontsize:S align:left shift:(20,-5) mark:(line,darkblue)

 color:blue1
 from:start till:14 text:[[Augustus]]
 from:14 till:37 text:[[Tiberius]]
 from:37 till:41 text:[[Caligula]]
 from:41 till:54 text:[[Claudius]]
 from:54 till:68 text:[[Nero]]
 from:68 till:69 text:"[[Vierkaiserjahr]]: Galba, Otho, Vitellius"
 from:69 till:79 text:[[Vespasian]]
 from:79 till:81 text:[[Titus]]
 from:81 till:96 text:"[[Domitian]], Gegenkaiser: Saturninus"
 from:96 till:98 text:[[Nerva]]
 from:98 till:117 text:[[Trajan]]
 color:blue2
 from:117 till:138 text:[[Hadrian (Kaiser)|Hadrian]]
 from:138 till:161 text:[[Antoninus_Pius]]
 from:161 till:169 text:[[Lucius_Verus]]
 from:161 till:180 text:"[[Mark_Aurel]], Gegenkaiser Avidius Cassius"
 from:180 till:192 text:[[Commodus]]
 from:193 till:193 text:[[Fünfkaiserjahr]]
 from:193 till:211 text:[[Septimius Severus]]
 color:blue3
 from:211 till:211 text:[[Geta]]
 from:211 till:217 text:[[Caracalla]]
 from:217 till:218 text:"[[Macrinus]], Mitkaiser Diadumenianus"
 from:222 till:235 text:[[Severus Alexander]] und Gegenkaiser

 color:blue4
 from:284 till:305 text:[[Diokletian]]
 from:305 till:337 text:[[Konstantin der Große]]
 from:361 till:363 text:[[Julian Apostata|Julian]]
 from:364 till:395 text:[[Valentinian I.]]_+_[[Theodosius I.]]
 at:395 mark:(line,red) shift:(15,-4) textcolor:red text:"Teilung in Ost- und Westrom"
| Viktorianisches Zeitalter | top next |

First version by Phrood on Saturday, March 4, 2006, last update on Saturday, April 8, 2006
ImageSize  = width:770 height:130
PlotArea   = width:745 height:50 left:25 bottom:65
Legend     = columns:3 left:350 top:30 columnwidth:130

DateFormat = dd/mm/yyyy
Period     = from:01/01/1835 till:01/12/1902
TimeAxis   = orientation:horizontal
ScaleMajor = unit:year increment:5 start:1835

Colors=
  id:Tory  value:blue   legend:Tory/konservativ
  id:Whig  value:red    legend:Whig/liberal
  id:Peel  value:green  legend:Peelit,_Koalition_mit_Whigs

PlotData=
  bar:Leadors color:red width:15 mark: (line,white) align:left fontsize:S

  color:Whig  from:01/04/1835 till:01/09/1841 shift:(-24,14) text:[[William Lamb, 2. Viscount Melbourne|Melbourne]]
  color:Tory  from:01/09/1841 till:01/07/1846 shift:(-10,14) text:[[Robert Peel|Peel]]
  color:Whig  from:01/07/1846 till:01/02/1852 shift:(-16,14) text:[[John Russell, 1. Earl Russell|Russell]]
  color:Tory  from:01/02/1852 till:01/12/1852 shift:(-18,30) text:[[Edward Geoffrey Smith Stanley, 14. Earl of Derby|Derby]]
  color:Peel  from:01/12/1852 till:01/02/1855 shift:(-23,14) text:[[George Hamilton-Gordon, 4. Earl of Aberdeen|Aberdeen]]
  color:Whig  from:01/02/1855 till:01/02/1858 shift:(-26,30) text:[[Henry John Temple, 3. Viscount Palmerston|Palmerston]]
  color:Tory  from:01/02/1858 till:01/06/1859 shift:(-16,14) text:[[Edward Geoffrey Smith Stanley, 14. Earl of Derby|Derby]]
  color:Whig  from:01/06/1859 till:01/10/1865 shift:(-23,14) text:[[Henry John Temple, 3. Viscount Palmerston|Palmerston]]
  color:Whig  from:01/10/1865 till:01/06/1866 shift:(-25,30) text:[[John Russell, 1. Earl Russell|Russell]]
  color:Tory  from:01/06/1866 till:01/02/1868 shift:(-14,14) text:[[Edward Geoffrey Smith Stanley, 14. Earl of Derby|Derby]]
  color:Tory  from:01/02/1868 till:01/12/1868 shift:(-11,30) text:[[Benjamin Disraeli|Disraeli]]
  color:Whig  from:01/12/1868 till:01/02/1874 shift:(-23,14) text:[[William Ewart Gladstone|Gladstone]]
  color:Tory  from:01/02/1874 till:01/04/1880 shift:(-17,14) text:[[Benjamin Disraeli|Disraeli]]
  color:Whig  from:01/04/1880 till:01/06/1885 shift:(-26,14) text:[[William Ewart Gladstone|Gladstone]]
  color:Tory  from:01/06/1885 till:01/02/1886 shift:(-23,30) text:[[Robert Arthur Talbot Gascoyne-Cecil, 3. Marquess of Salisbury|Salisbury]]
  color:Whig  from:01/02/1886 till:01/08/1886 shift:(-08,14) text:[[William Ewart Gladstone|Glad.]]
  color:Tory  from:01/08/1886 till:01/08/1892 shift:(-12,14) text:[[Robert Arthur Talbot Gascoyne-Cecil, 3. Marquess of Salisbury|Salisbury]]
  color:Whig  from:01/08/1892 till:01/03/1894 shift:(-25,30) text:[[William Ewart Gladstone|Gladstone]]
  color:Whig  from:01/03/1894 till:01/06/1895 shift:(-18,14) text:[[Archibald Philip Primrose, 5. Earl of Rosebery|Rosebery]]
  color:Tory  from:01/06/1895 till:01/07/1902 shift:(-11,14) text:[[Robert Arthur Talbot Gascoyne-Cecil, 3. Marquess of Salisbury|Salisbury]]
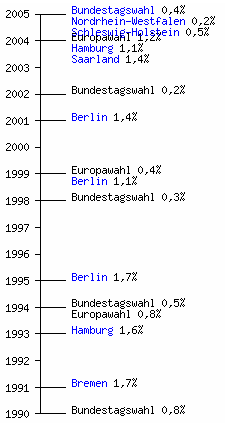
| DIE GRAUEN - Graue Panther | top next |
First version by Antifaschist 666 on Thursday, April 28, 2005, last update on Monday, September 26, 2005
ImageSize  = width:225 height:420
PlotArea   = width:65 height:400 left:40 bottom:10
Colors =
  id:lightyellow value:rgb(1,1,0.8)

DateFormat = yyyy
Period     = from:1990 till:2005
TimeAxis   = orientation:vertical
ScaleMajor = unit:year increment:1 start:1990
BackgroundColors = canvas:white

Define $dx = 20 # shift text to right side of bar

PlotData =
  bar:Chairmen color:orange width:25 mark:(line,black) align:left fontsize:S
  from:1990 till:1990 shift:($dx,0)  text:Bundestagswahl 0,8%
  from:1991 till:1991 shift:($dx,0)  text:[[Bremen]] 1,7%
  from:1993 till:1993 shift:($dx,0)  text:[[Hamburg]] 1,6%
  from:1994 till:1994 shift:($dx,0)  text:Bundestagswahl 0,5%~Europawahl 0,8%
  from:1995 till:1995 shift:($dx,0)  text:[[Berlin]] 1,7%
  from:1998  till:1998 shift:($dx,0)  text:Bundestagswahl 0,3%
  from:1999  till:1999 shift:($dx,0)  text:Europawahl 0,4%~[[Berlin]] 1,1%
  from:2001  till:2001 shift:($dx,0)  text:[[Berlin]] 1,4%
  from:2002  till:2002 shift:($dx,0)  text:Bundestagswahl 0,2%
  from:2004  till:2004 shift:($dx,0)  text:Europawahl 1,2%~[[Hamburg]] 1,1%~[[Saarland]] 1,4%
  from:2005 till:2005 shift:($dx,0) text:[[Bundestagswahl]] 0,4%~[[Nordrhein-Westfalen]] 0,2%~[[Schleswig-Holstein]] 0,5%
| Template:Zeitleiste Deutsche Bundeskanzler | top next |

First version by Eloquence on Monday, May 31, 2004, last update on Wednesday, April 5, 2006
ImageSize = width:230 height:600
PlotArea  = left:50 right:0 bottom:40 top:10
Legend    = columns:2 left:15 top:25 columnwidth:50

DateFormat = dd/mm/yyyy
Period     = from:15/09/1949 till:30/06/2006
TimeAxis   = orientation:vertical format:yyyy
ScaleMajor = unit:year increment:4 start:1950

Colors=
  id:CDU  value:gray(0.25) legend:CDU
  id:SPD  value:red    legend:SPD

PlotData=
  bar:Leaders width:25 mark:(line,white) align:left fontsize:S

  from:start till:16/10/1963 shift:(25,0)  color:CDU  text:[[Konrad_Adenauer]]
  from:16/10/1963  till:01/12/1966 shift:(25,0)  color:CDU  text:[[Ludwig_Erhard]]
  from:01/12/1966  till:21/10/1969 shift:(25,0)  color:CDU  text:[[Kurt_Georg_Kiesinger]]
  from:21/10/1969  till:07/05/1974 shift:(25,0)  color:SPD  text:[[Willy Brandt]]
  from:16/05/1974  till:01/10/1982 shift:(25,0)  color:SPD  text:[[Helmut Schmidt]]
  from:01/10/1982  till:27/10/1998 shift:(25,0)  color:CDU  text:[[Helmut Kohl]]
  from:27/10/1998  till:22/11/2005 shift:(25,0)  color:SPD  text:[[Gerhard Schröder|Gerhard Schröder]]
  from:22/11/2005  till:end shift:(25,0)  color:CDU  text:[[Angela Merkel]]
| Template:Zeitleiste Hochsprung-Weltrekord Frauen | top next |

First version by Triebtäter on Monday, May 31, 2004, last update on Sunday, September 4, 2005
ImageSize = width:220 height:1000
PlotArea  = width:35  height:950 left:50 bottom:40
Legend    = columns:2 left:15 top:25 columnwidth:50
AlignBars = early

DateFormat = yyyy
Period     = from:1920 till:2004
TimeAxis   = orientation:vertical
ScaleMajor = unit:year increment:5 start:1920

Colors=
  id:Basis  value:red legend:Entwicklung_des_Weltrekords

PlotData=
  bar:Leaders width:25 mark:(line,white) align:left fontsize:XS shift:(22,-4)

  from:1922 till:end color:Basis
  at:1922               text:[[Nancy_Vorhees]]_1,46_m
  at:1926               text:[[Phyllis_Green]]_1,55_m
  at:1929               text:[[Carolina_Gisoll]]_1,60_m
  at:1932               text:[[Jean_Shiley]]_1,65_m
  at:1939               text:[[Dorothy_Adams]]_1,66_m
  at:1943               text:[[Fanny_Blankers-Koen]]_1,71_m
  at:1956               text:[[Mildred Singleton]]_1,76_m
  at:1958               text:[[Iolanda_Balas]]_1,80_m
  at:1960 shift:(22,-8) text:Iolanda_Balas_1,85_m
  at:1961 shift:(22,-7) text:Iolanda_Balas_1,90_m
  at:1961 shift:(22,0)  text:Iolanda_Balas_1,91_m
  at:1971               text:[[Ilona_Gusenbauer]]_1,92_m
  at:1972               text:[[Jordanka_Blagojewa]]_1,94_m
  at:1974               text:[[Rosemarie_Ackermann]]_1,95_m
  at:1976 shift:(22,-8) text:Rosemarie_Ackermann_1,96_m
  at:1977 shift:(22,-8) text:Rosemarie_Ackermann_1,97_m
  at:1977 shift:(22,-1) text:Rosemarie_Ackermann_2,00_m
  at:1978 shift:(22,-2) text:[[Sara_Simeoni]]_2,01_m
  at:1982 shift:(22,-6) text:[[Ulrike_Meyfarth]]_2,02_m
  at:1983 shift:(22,-8) text:Ulrike_Meyfarth_2,03_m
  at:1983 shift:(22,-1) text:[[Tamara_Bykowa]]_2,04_m
  at:1984 shift:(22,-5) text:Tamara_Bykowa_2,05_m
  at:1984 shift:(22,2)  text:[[Ludmilla_Andonowa]]_2,07_m
  at:1986               text:[[Stefka_Kostadinowa]]_2,08_m
  at:1987               text:Stefka_Kostadinowa_2,09_m
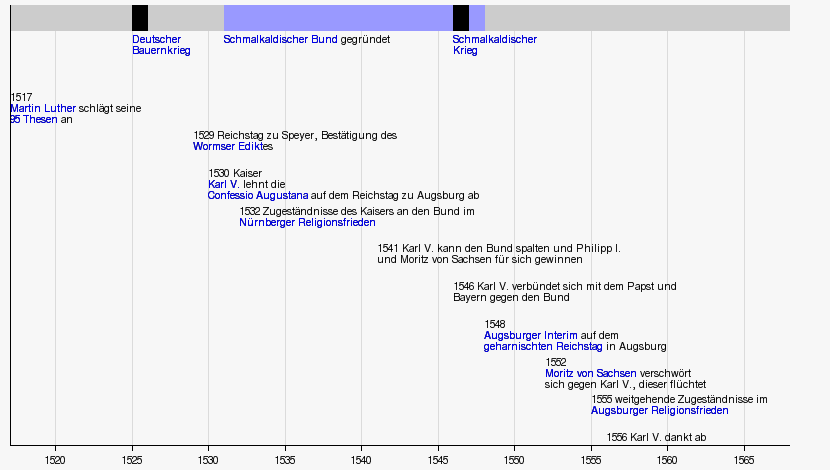
| Template:Zeitleiste Schmalkaldischer Bund | top next |
First version by Sansculotte on Wednesday, June 2, 2004, last update on Monday, June 26, 2006
ImageSize  = width:830 height:auto barincrement:40
PlotArea   = left:10 right:40 top:5 bottom:25

Colors     =
  id:canvas value:rgb(0.97,0.97,0.97)
  id:grid1  value:rgb(0.86,0.86,0.86)
  id:grey   value:gray(0.8)
  id:ch1    value:rgb(0.6,0.6,1)
  id:ch2    value:rgb(0.6,0.6,0.5)

BackgroundColors = canvas:canvas bars:canvas

Period     = from:1517 till:1568
TimeAxis   = orientation:horizontal format:yyyy
ScaleMajor = unit:year increment:5 start:1520 gridcolor:grid1
DateFormat = yyyy
AlignBars  = justify

BarData =
  bar:Perioden
  barset:Ereignisse

PlotData=

  width:25 fontsize:S textcolor:black anchor:from align:left shift:(0,-25)

  bar:Perioden
  from:start till:end color:grey
  from:1525  till:1526 color:black text:"[[Deutscher~Bauernkrieg]]"
  from:1531  till:1548 color:ch1   text:"[[Schmalkaldischer Bund]] gegründet"
  from:1546  till:1547 color:black text:"[[Schmalkaldischer~Krieg]]"

  fontsize:S shift:(-2,18) align:left
  shift:(0,-8)  # shift all texts 11 pixels to left to center year figures on actual event time
                # and 12 pixels down to put them below bar

  barset:Ereignisse
  barset:skip
  at:1517 text:"1517 ~[[Martin Luther]] schlägt seine ~[[95 Thesen]] an"
  at:1529 text:"1529 Reichstag zu Speyer, Bestätigung des ~[[Wormser Edikt]]es"
  at:1530 text:"1530 Kaiser ~[[Karl V. (HRR)|Karl V.]] lehnt die ~[[Confessio Augustana]] auf dem Reichstag zu Augsburg ab"
  at:1532 text:"1532 Zugeständnisse des Kaisers an den Bund im ~[[Nürnberger Religionsfrieden|Nürnberger Religionsfrieden]]"
  at:1541 text:"1541 Karl V. kann den Bund spalten und Philipp I. ~und Moritz von Sachsen für sich gewinnen"
  at:1546 text:"1546 Karl V. verbündet sich mit dem Papst und ~Bayern gegen den Bund"
  at:1548 text:"1548 ~[[Augsburger Interim]] auf dem ~[[Geharnischter Reichstag|geharnischten Reichstag]] in Augsburg"
  at:1552 text:"1552 ~[[Moritz (Sachsen)|Moritz von Sachsen]] verschwört ~sich gegen Karl V., dieser flüchtet "
  at:1555 text:"1555 weitgehende Zugeständnisse im ~[[Augsburger Religionsfrieden]]"
  at:1556 text:"1556 Karl V. dankt ab"
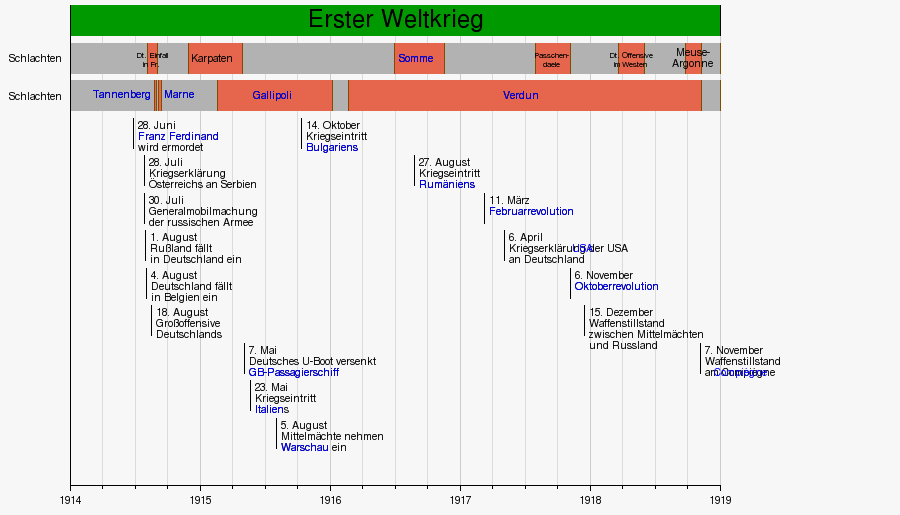
| Template:Zeitleiste Erster Weltkrieg | top next |
First version by Eloquence on Wednesday, June 2, 2004, last update on Wednesday, January 4, 2006
DateFormat = dd/mm/yyyy
ImageSize  = width:900 height:auto barincrement:40
PlotArea   = left:70 right:180 bottom:30 top:5
AlignBars  = justify

Colors     =
  id:canvas   value:rgb(0.97,0.97,0.97)
  id:grid1    value:rgb(0.80,0.80,0.80)
  id:grid2    value:rgb(0.86,0.86,0.86)
  id:schlacht value:rgb(0.9,0.4,0.3)
  id:brown    value:rgb(0.5,0.3,0.0)
  id:grau     value:gray(0.7)

Period     = from:01/01/1914 till:01/01/1919
TimeAxis   = orientation:horizontal format:yyyy
ScaleMajor = unit:year  increment:1 start:1914 gridcolor:grid1
ScaleMinor = unit:month increment:3 start:1914 gridcolor:grid2

BackgroundColors = canvas:canvas bars:canvas

BarData=
  bar:title
  bar:Schlachten  text:"Schlachten"
  bar:Schlachten2 text:"Schlachten"
  barset:Ereignisse
  bar:dummy

PlotData=
  width:30 fontsize:S
  bar:title from:start till:end text:"Erster Weltkrieg" fontsize:XL anchor:middle align:center shift:(0,-7) mark:(line,black)

  mark:(line,brown)

  bar:Schlachten align:center color:schlacht shift:(-4,-4)
  from:start      till:end color:grau # Hintergrund
  from:07/08/1914 till:04/09/1914 text: "Dt. Einfall~in Fr." fontsize:XS shift:(0,0)
  from:01/12/1914 till:30/04/1915 text: "Karpaten"
  from:01/07/1916 till:18/11/1916 text: "[[Schlacht an der Somme|Somme]]"
  from:31/07/1917 till:06/11/1917 text: "Passchen-~daele" fontsize:XS shift:(0,0)
  from:21/03/1918 till:03/06/1918 text: "Dt. Offensive~im Westen" fontsize:XS shift:(0,0)
  from:26/09/1918 till:11/11/1918 text: "Meuse-~Argonne" shift:(0,2)

  bar:Schlachten2 align:center color:schlacht
  from:start      till:end color:grau # Hintergrund
  from:26/08/1914 till:31/08/1914 text: "[[Schlacht bei Tannenberg (1914)|Tannenberg]]" align:right shift:(-3,-3)
  from:06/09/1914 till:15/09/1914 text: "[[Marneschlacht|Marne]]" align:left shift:(5,-3)
  from:19/02/1915 till:09/01/1916 text: "[[Schlacht von Gallipoli|Gallipoli]]"
  from:21/02/1916 till:11/11/1918 text: "[[Schlacht um Verdun|Verdun]]"

  mark:(line,black) shift:(5,4) fontsize:S textcolor:black align:left

  barset:Ereignisse
  at:28/06/1914 text:"28._Juni~[[Franz Ferdinand von Österreich-Este|Franz Ferdinand]]~wird ermordet"
  at:28/07/1914 text:"28._Juli~Kriegserklärung~Österreichs an Serbien"
  at:30/07/1914 text:"30._Juli~Generalmobilmachung~der russischen Armee"
  at:01/08/1914 text:"1._August~Rußland fällt~in Deutschland ein"
  at:04/08/1914 text:"4._August~Deutschland fällt~in Belgien ein"
  at:18/08/1914 text:"18._August~Großoffensive~Deutschlands"
  at:07/05/1915 text:"7._Mai~Deutsches U-Boot versenkt~[[RMS Lusitania|GB-Passagierschiff]]"
  at:23/05/1915 text:"23._Mai~Kriegseintritt~[[Italien]]s"
  at:05/08/1915 text:"5._August~Mittelmächte nehmen~[[Warschau]] ein"
  barset:break
  at:14/10/1915 text:"14._Oktober~Kriegseintritt~[[Bulgarien|Bulgariens]]"
  at:27/08/1916 text:"27._August~Kriegseintritt~[[Rumänien|Rumäniens]]"
  at:11/03/1917 text:"11._März~[[Februarrevolution 1917|Februarrevolution]]"
  at:06/05/1917 text:"6._April~Kriegserklärung der [[USA]]~an Deutschland"
  at:06/11/1917 text:"6._November~[[Oktoberrevolution]]"
  at:15/12/1917 text:"15._Dezember~Waffenstillstand~zwischen Mittelmächten~und Russland"
  at:07/11/1918 text:"7._November~Waffenstillstand~am [[Compiègne]]"
| Template:Zeitleiste Bundespräsidenten BRD | top next |

First version by Eloquence on Wednesday, June 2, 2004, last update on Friday, January 27, 2006
ImageSize	= width:250 height:600
PlotArea	= left:40 right:0 bottom:80 top:20
Legend		= columns:1 left:40 top:60

DateFormat	= dd/mm/yyyy
Period		= from:07/09/1949 till:30/06/2009
TimeAxis	= orientation:vertical format:yyyy

ScaleMajor	= unit:year increment:5 start:1950

Colors=
 id:CDU	value:black	legend:CDU
 id:SPD value:red	legend:SPD
 id:FDP value:yellow	legend:FDP

PlotData=
 bar:Bundespraes color:CDU width:20 fontsize:M align:left shift:(20,-5) mark:(line,white)

 from:start till:12/09/1949 fontsize:S text:[[Karl Arnold (Politiker)|Karl_Arnold]]_(kommissarisch)
 from:12/09/1949 till:12/09/1959 text:[[Theodor_Heuss]] color:FDP
 from:12/09/1959 till:30/06/1969 text:[[Heinrich_Lübke|Heinrich_Lübke]]
 from:01/07/1969 till:30/06/1974 text:[[Gustav_Heinemann]] color:SPD
 from:01/07/1974 till:30/06/1979 text:[[Walter_Scheel]] color:FDP
 from:01/07/1979 till:30/06/1984 text:[[Karl_Carstens]]
 from:01/07/1984 till:30/06/1994 text:[[Richard_von_Weizsäcker|Richard_von_Weizsäcker]]
 from:01/07/1994 till:30/06/1999 text:[[Roman_Herzog]]
 from:01/07/1999 till:30/06/2004 text:[[Johannes_Rau]] color:SPD
 from:01/07/2004 till:end text:[[Horst_Köhler|Horst_Köhler]]
| Template:Zeitleiste US-Präsidenten | top next |

First version by EBB on Friday, June 4, 2004, last update on Friday, June 17, 2005
ImageSize = width:250 height:1000
PlotArea  = width:30 height:840 left:45 bottom:150
Legend    = columns:1 left:40 top:100
AlignBars = early

DateFormat = yyyy
Period     = from:1789 till:2005
TimeAxis   = orientation:vertical
ScaleMajor = unit:year increment:5 start:1790

Colors=

  id:Dem  value:blue      legend:Demokrat
  id:Rep  value:red       legend:Republikaner
  id:Fed  value:yellow    legend:Föderalist
  id:DR   value:green     legend:Demokraten-Republikaner
  id:Wh   value:pink      legend:Whig
  id:np   value:gray(0.8) legend:parteilos

PlotData=
  bar:Leaders width:25 mark:(line,white) align:left fontsize:XS shift:(25,-5) anchor:middle

  from:start till:1797 color:np   text:"1789-1797_[[George Washington]]"
  from:1797  till:1801 color:Fed  text:"1797-1801_[[John Adams]]"
  from:1801  till:1809 color:DR   text:"1801-1809_[[Thomas Jefferson]]"
  from:1809  till:1817 color:DR   text:"1809-1817_[[James Madison]]"
  from:1817  till:1825 color:DR   text:"1817-1825_[[James Monroe]]"
  from:1825  till:1829 color:DR   text:"1825-1829_[[John Quincy Adams]]"
  from:1829  till:1837 color:Dem  text:"1829-1837_[[Andrew Jackson]]"
  from:1837  till:1841 color:Dem  text:"1837-1841_[[Martin Van Buren]]"    shift:(25,-7)
  from:1841  till:1841 color:Wh   text:"1841-1841_[[William H. Harrison]]"
  from:1841  till:1845 color:Wh   text:"1841-1845_[[John Tyler]]"          shift:(25,-3)
  from:1845  till:1849 color:Dem  text:"1845-1849_[[James K. Polk]]"
  from:1849  till:1850 color:Wh   text:"1849-1850_[[Zachary Taylor]]"      shift:(25,-6)
  from:1850  till:1853 color:Wh   text:"1850-1853_[[Millard Fillmore]]"    shift:(25,-3)
  from:1853  till:1857 color:Dem  text:"1853-1857_[[Franklin Pierce]]"
  from:1857  till:1861 color:Dem  text:"1857-1861_[[James Buchanan]]"
  from:1861  till:1865 color:Rep  text:"1861-1865_[[Abraham Lincoln]]"
  from:1865  till:1869 color:Rep  text:"1865-1869_[[Andrew Johnson]]"
  from:1869  till:1877 color:Rep  text:"1869-1877_[[Ulysses S. Grant]]"
  from:1877  till:1881 color:Rep  text:"1877-1881_[[Rutherford B. Hayes]]" shift:(25,-8)
  from:1881  till:1881 color:Rep  text:"1881-1881_[[James A. Garfield]]"
  from:1881  till:1885 color:Rep  text:"1881-1885_[[Chester A. Arthur]]"   shift:(25,-2)
  from:1885  till:1889 color:Dem  text:"1885-1889_[[Grover Cleveland]]"
  from:1889  till:1893 color:Rep  text:"1889-1893_[[Benjamin Harrison]]"
  from:1893  till:1897 color:Dem  text:"1893-1897_[[Grover Cleveland]]"
  from:1897  till:1901 color:Rep  text:"1897-1901_[[William McKinley]]"
  from:1901  till:1909 color:Rep  text:"1901-1909_[[Theodore Roosevelt]]"
  from:1909  till:1913 color:Rep  text:"1909-1913_[[William H. Taft]]"
  from:1913  till:1921 color:Dem  text:"1913-1921_[[Woodrow Wilson]]"
  from:1921  till:1923 color:Rep  text:"1921-1923_[[Warren G. Harding]]"
  from:1923  till:1929 color:Rep  text:"1923-1929_[[Calvin Coolidge]]"
  from:1929  till:1933 color:Rep  text:"1929-1933_[[Herbert Hoover]]"
  from:1933  till:1945 color:Dem  text:"1933-1945_[[Franklin D. Roosevelt]]"
  from:1945  till:1953 color:Dem  text:"1945-1953_[[Harry Truman]]"
  from:1953  till:1961 color:Rep  text:"1953-1961_[[Dwight D. Eisenhower]]"
  from:1961  till:1963 color:Dem  text:"1961-1963_[[John F. Kennedy]]"
  from:1963  till:1969 color:Dem  text:"1963-1969_[[Lyndon B. Johnson]]"
  from:1969  till:1974 color:Rep  text:"1969-1974_[[Richard Nixon]]"
  from:1974  till:1977 color:Rep  text:"1974-1977_[[Gerald Ford]]"
  from:1977  till:1981 color:Dem  text:"1977-1981_[[Jimmy Carter]]"
  from:1981  till:1989 color:Rep  text:"1981-1989_[[Ronald Reagan]]"
  from:1989  till:1993 color:Rep  text:"1989-1993_[[George H. W. Bush|George Bush]]"
  from:1993  till:2001 color:Dem  text:"1993-2001_[[Bill Clinton]]"
  from:2001  till:end  color:Rep  text:"2001-heute_[[George W. Bush]]"
| Template:Zeitleiste Bundestagspräsidenten | top next |

First version by Triebtäter on Saturday, June 5, 2004, last update on Tuesday, October 18, 2005
ImageSize  = width:250 height:600
PlotArea   = left:40 right:0 bottom:80 top:20
Legend     = columns:1 left:40 top:60

DateFormat = dd/mm/yyyy
Period     = from:07/09/1949 till:05/07/2006
TimeAxis   = orientation:vertical format:yyyy

ScaleMajor = unit:year increment:4 start:1950

Colors=
 id:CDU	value:gray(0.3)	legend:CDU/CSU
 id:SPD value:red	legend:SPD

PlotData=
 bar:Bundestagspraes color:CDU width:20 fontsize:M align:left shift:(20,-5) mark:(line,white)

 from:start till:18/10/1950 text:[[Erich_Köhler|Erich_Köhler]] color:CDU
 from:19/10/1950 till:29/10/1954 text:[[Hermann_Ehlers]]
 from:16/11/1954 till:31/01/1969 text:[[Eugen_Gerstenmaier]]
 from:05/02/1969 till:13/12/1972 text:[[Kai-Uwe_von_Hassel]]
 from:13/12/1972 till:14/12/1976 text:[[Annemarie_Renger]] color:SPD
 from:14/12/1976 till:31/05/1979 text:[[Karl_Carstens]]
 from:31/05/1979 till:29/03/1983 text:[[Richard_Stücklen|Richard_Stücklen]]
 from:29/03/1983 till:25/10/1984 text:[[Rainer_Barzel]]
 from:05/11/1984 till:11/11/1988 text:[[Philipp_Jenninger]]
 from:25/11/1988 till:26/10/1998 text:[[Rita_Süssmuth|Rita_Süssmuth]]
 from:26/10/1998 till:18/10/2005 text:[[Wolfgang_Thierse]] color:SPD
 from:18/10/2005 till:end text:[[Norbert_Lammert]] color:CDU
| Template:Zeitleiste Reichskanzler Weimar | top next |

First version by HenHei on Tuesday, June 8, 2004, last update on Monday, August 30, 2004
ImageSize	= width:230 height:620
PlotArea	= left:39 right:10 bottom:80 top:20
Legend		= columns:2 left:40 top:60 columnwidth:90

DateFormat	= dd/mm/yyyy
Period		= from:13/02/1919 till:30/01/1933
TimeAxis	= orientation:vertical format:yyyy

ScaleMajor	= unit:year increment:1 start:01/01/1920

Colors=
 id:SPD	value:red	legend:SPD
 id:DVP value:yellow	legend:DVP
 id:Wahl value:green    legend:Wahlen_zum_Reichstag
 id:Z value:black	legend:Zentrum
 id:NA value:gray(0.5)	legend:Parteilos

LineData=
 tillpos:59
 #at:19/01/1919 color:Wahl #eigentl. Wahl zur Nationalversammlung
 at:06/06/1920  color:Wahl
 at:04/05/1924  color:Wahl
 at:07/12/1924  color:Wahl
 at:20/05/1928  color:Wahl
 at:14/09/1930  color:Wahl
 at:31/07/1932  color:Wahl
 at:06/11/1932  color:Wahl
 #at:05/03/1933 color:Wahl

PlotData=
 bar:Reichskanzler color:SPD width:20 fontsize:M align:left shift:(20,-5) mark:(line,white)

 from:start till:20/06/1919 text:[[Philipp_Scheidemann]]~(Ministerpräsident)
 from:21/06/1919 till:26/03/1920 text:[[Gustav_Bauer]]
 from:27/03/1920 till:08/06/1920 text:[[Hermann_Müller|Hermann_Müller]]
 color:Z
 from:25/06/1920 till:04/05/1921 text:[[Konstantin_Fehrenbach]]
 from:10/05/1921 till:14/11/1922 text:Dr._[[Joseph_Wirth]]
 from:22/11/1922 till:12/08/1923 text:Dr._[[Wilhelm_Cuno]] color:NA
 from:13/08/1923 till:23/11/1923 text:Dr._[[Gustav_Stresemann]] color:DVP
 from:30/11/1923 till:15/01/1925 text:Dr._[[Wilhelm_Marx]]
 from:15/01/1925 till:16/05/1926 text:Dr._[[Hans_Luther]] color:NA
 from:16/05/1926 till:28/06/1928 text:Dr._[[Wilhelm_Marx]]
 from:28/06/1928 till:30/03/1930 text:[[Hermann_Müller|Hermann_Müller]] color:SPD
 from:30/03/1930 till:31/05/1932 text:Dr._[[Heinrich_Brüning|Heinrich Brüning]]
 color:NA
 from:01/06/1932 till:01/12/1932 text:[[Franz_von_Papen]] shift:(20,-8)
 from:02/12/1932 till:28/01/1933 text:[[Kurt_von_Schleicher]] shift:(20,-9)
 at:30/01/1933 text:[[Adolf_Hitler]] shift:(20,0)
| Template:Zeitleiste Stratigraphie | top next |
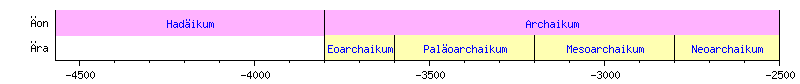
First version by Fristu ? on Tuesday, June 8, 2004, last update on Wednesday, October 12, 2005
ImageSize  = width:800 height:85
PlotArea   = left:55 right:20 top:10 bottom:25
AlignBars  = early

Colors =
  id:epoch  value:rgb(0.7,0.7,1) # light yellow
  id:period value:rgb(1,0.7,0.7) # light red
  id:age    value:rgb(0.7,1,0.7) # light green
  id:era    value:rgb(1,1,0.7)   # light blue
  id:eon    value:rgb(1,0.7,1)   # light purple
  id:black  value:black

Period      = from:-4570 till:-2500
TimeAxis    = orientation:horizontal
ScaleMajor  = unit:year increment:500 start:-4500
ScaleMinor  = unit:year increment:100 start:-4500

Define $markred = text:"*" textcolor:red shift:(0,3) fontsize:10

PlotData=
  align:center textcolor:black fontsize:8 mark:(line,black) width:25 shift:(0,-5)

  bar:Äon color:eon

  from:-3800   till: -2500   text:[[Archaikum]]
  from:-4570   till: -3800   text:[[Hadäikum|Hadäikum]]

  bar:Ära color:era
  fontsize:7
  from: -2800  till: -2500  text:[[Neoarchaikum]]
  from: -3200  till: -2800  text:[[Mesoarchaikum]]
  from: -3600  till: -3200  text:[[Paläoarchaikum|Paläoarchaikum]]
  from: -3800  till: -3600  text:[[Eoarchaikum]]
| Template:Zeitleiste Stratigraphie | top next |

First version by Fristu ? on Tuesday, June 8, 2004, last update on Wednesday, October 12, 2005
ImageSize  = width:810 height:110
PlotArea   = left:55 right:30 top:10 bottom:25
AlignBars  = justify

Colors =
  id:epoch  value:rgb(0.7,0.7,1) # light yellow
  id:period value:rgb(1,0.7,0.7) # light red
  id:age    value:rgb(0.7,1,0.7) # light green
  id:era    value:rgb(1,1,0.7)   # light blue
  id:eon    value:rgb(1,0.7,1)   # light purple
  id:black  value:black

Period      = from:-2500 till:-542
TimeAxis    = orientation:horizontal
ScaleMajor  = unit:year increment:500 start:-2500
ScaleMinor  = unit:year increment:100 start:-2500

Define $markred = text:"*" textcolor:red shift:(0,3) fontsize:10

PlotData=
  align:center textcolor:black fontsize:8 mark:(line,black) width:25 shift:(0,-5)

  bar:Äon color:eon

  from:-2500   till:  -542   text:[[Proterozoikum]]

  bar:Ära color:era
  fontsize:7
  from: -1000  till:  -542  text:[[Neoproterozoikum]]
  from: -1600  till: -1000  text:[[Mesoproterozoikum]]
  from: -2500  till: -1600  text:[[Paläoproterozoikum|Paläoproterozoikum]]

  bar:Periode color:period
  fontsize:6
  from:  -630  till:  -542  text:[[Ediacarium]]
  from:  -850  till:  -630  text:[[Cryogenium]]
  from: -1000  till:  -850  text:[[Tonium]]
  from: -1200  till: -1000  text:[[Stenium]]
  from: -1400  till: -1200  text:[[Ectasium]]
  from: -1600  till: -1400  text:[[Calymmium]]
  from: -1800  till: -1600  text:[[Statherium]]
  from: -2050  till: -1800  text:[[Orosirium]]
  from: -2300  till: -2050  text:[[Rhyacium]]
  from: -2500  till: -2300  text:[[Siderium]]
| Template:Zeitleiste Stratigraphie | top next |

First version by Fristu ? on Tuesday, June 8, 2004, last update on Wednesday, October 12, 2005
ImageSize  = width:800 height:110
PlotArea   = left:55 right:20 top:10 bottom:25
AlignBars  = justify

Colors =
  id:epoch  value:rgb(0.7,0.7,1) # light yellow
  id:period value:rgb(1,0.7,0.7) # light red
  id:age    value:rgb(0.7,1,0.7) # light green
  id:era    value:rgb(1,1,0.7)   # light blue
  id:eon    value:rgb(1,0.7,1)   # light purple
  id:black  value:black

Period      = from:-542 till:0
TimeAxis    = orientation:horizontal
ScaleMajor  = unit:year increment:50 start:-500
ScaleMinor  = unit:year increment:10 start:-540

Define $markred = text:"*" textcolor:red shift:(0,3) fontsize:10

PlotData=
  align:center textcolor:black fontsize:8 mark:(line,black) width:25 shift:(0,-5)

  bar:Äon color:eon

  from:  -542  till:     0  text:[[Phanerozoikum]]

  bar:Ära color:era
  fontsize:7
  from:  -65  till:     0  text:[[Känozoikum|Känozoikum]]
  from: -251  till:   -65  text:[[Mesozoikum]]
  from: -542  till:  -251  text:[[Paläozoikum|Paläozoikum]]

  bar:Periode color:period
  fontsize:6
  from:  -23  till:    0  text:[[Neogen]]
  from:  -65  till:  -23  text:[[Paläogen|Paläogen]]
  from: -145  till:  -65  text:[[Kreide (Geologie)|Kreide]]
  from: -200  till: -145  text:[[Jura (Geologie)|Jura]]
  from: -251  till: -200  text:[[Trias (Geologie)|Trias]]
  from: -299  till: -251  text:[[Perm]]
  from: -359  till: -299  text:[[Karbon]]
  from: -416  till: -359  text:[[Devon]]
  from: -444  till: -416  text:[[Silur]]
  from: -488  till: -444  text:[[Ordovicium]]
  from: -542  till: -488  text:[[Kambrium]]
| Template:Zeitleiste Phanerozoikum | top next |

First version by Fristu on Tuesday, June 8, 2004, last update on Wednesday, October 12, 2005
ImageSize  = width:200 height:400
PlotArea   = width:140 height:380 left:50 bottom:10
AlignBars  = early

Colors =
  id:Neogen   value:rgb(1,1,0.7)     # light blue
  id:Paläogen value:rgb(1,1,0.6)     # light blu
  id:Kreide   value:rgb(0.7,1,0.7)   # light green
  id:Jura     value:rgb(0.7,0.7,1)   # hellbl
  id:Trias    value:rgb(0.7,0.5,0.9) # gleb
  id:Perm     value:rgb(0.5,0.7,0.7) #
  id:Karbon   value:rgb(0.7,0.7,0.7) # grau
  id:Devon    value:rgb(1,0.5,0.5)   # orange
  id:Silur    value:rgb(0.9,0.7,1)   # gelbgrün
  id:Ordov    value:rgb(0.8,0.7,1)   # hellgrün
  id:Kambr    value:rgb(0.4,0.7,0.7) # d'grün
  id:Ediaca   value:rgb(1,0.7,0.7)   # rosa

 # id:epoch  value:rgb(0.7,0.7,1) # light yellow
 # id:period value:rgb(1,0.7,0.7) # light red
 # id:age    value:rgb(0.7,1,0.7) # light green
 # id:era    value:rgb(1,1,0.7)   # light blue
 # id:eon    value:rgb(1,0.7,1)   # light purple
  id:black  value:black

Period      = from:-600 till:0
TimeAxis    = orientation:vertical
ScaleMajor  = unit:year increment:100 start:-600
ScaleMinor  = unit:year increment:10 start:-590

#Define $markred = text:"*" textcolor:red shift:(0,3) fontsize:10
Define $kuerzel = align:right shift:(75,-5)

PlotData=
  align:center textcolor:black fontsize:8 mark:(line,black) width:110 shift:(0,-5)

  bar:System  width:90

  at:   -65  text:K/T $kuerzel
  at:  -250  text:P/T $kuerzel
  at:  -542  text:E/K $kuerzel
  from: -24 till:    0  text:[[Neogen]]     color:neogen
  from: -65 till: -24   text:[[Paläogen|Paläogen]]   color:Paläogen
  from:-142 till: -65   text:[[Kreide]]     color:Kreide
  from:-205 till:-142   text:[[Jura]]       color:Jura
  from:-250 till:-205   text:[[Trias]]      color:Trias
  from:-292 till:-250   text:[[Perm]]       color:Perm
  from:-354 till:-292   text:[[Karbon]]     color:Karbon
  from:-417 till:-354   text:[[Devon]]      color:Devon
  from:-440 till:-417   text:[[Silur]]      color:Silur
  from:-495 till:-440   text:[[Ordovizium]] color:Ordov
  from:-542 till:-495   text:[[Kambrium]]   color:kambr
  from:-590 till:-542   text:[[Ediacarium]] color:Ediaca
| Template:Zeitleiste Enzyklopädien | top next |

First version by JakobVoss on Wednesday, June 16, 2004, last update on Friday, September 3, 2004
ImageSize = width:170 height:800
PlotArea  = width:35  height:750 left:50 bottom:40
#Legend    = columns:2 left:10 top:25 columnwidth:50
AlignBars = early

DateFormat = yyyy
Period     = from:1700 till:2004
TimeAxis   = orientation:vertical
ScaleMajor = unit:year increment:50 start:1700

Colors=
  id:Basis  value:red # legend:...
  id:red    value:rgb(1,0,0)
  id:grau   value:gray(0.9)
PlotData=
  bar:Leaders width:25 align:left fontsize:S shift:(22,-4)
  from:start till:end color:grau
# from:1922   till:end color:Basis

# at:1559 text:"Cyclopaedia - Ringelberg"
# at:1559 text:"Encyclopaedia seu orbis disciplinarum tam sacrarum quam prophanarum epistemon
[[Paul Scalich]]"
# at:1630 text:"Encyclopaedia Cursus Philosophici
[[Johann Heinrich Alsted|Alsted]]"
  mark:(line,red)
  at:1704 text:[[Lexicon~technicum]]
  at:1728 text:[[Cyclopaedia]]
  at:1768 text:"[[Encyclopaedia~Britannica]]" mark:(line,white) shift:(22,0)
  at:1778 text:"[[Frankfurter~Enzyklopädie]]" shift:(22,6)

  mark:(line,white)
  from:1751 till:1772 color:Basis text:"[[Encyclopédie]]" shift:(22,-10)
  from:1812 till:1820 color:Basis text:"[[Brockhaus]]~2.Aufl" shift:(22,4)
  from:1851 till:1852 color:Basis text:"[[Meyers~Konversations-~lexikon]]" shift:(22,5)

  at:1993 text:[[Microsoft~Encarta]] (USA)
  at:2001 text:[[Wikipedia]]
| Template:Zeitleiste Führer der Sowjetunion | top next |

First version by Nerd on Monday, June 21, 2004, last update on Sunday, June 11, 2006
ImageSize  = width:180 height:550
PlotArea   = width:50 height:530 left:50 bottom:10

DateFormat = yyyy
Period     = from:1919 till:1991
TimeAxis   = orientation:vertical
ScaleMajor = unit:year increment:5 start:1920

# there is no automatic collision detection,
# so shift texts up or down manually to avoid overlap

Define $dx = 25 # shift text to right side of bar

PlotData=
  bar:Leaders color:red width:25 mark:(line,white) align:left fontsize:S

  from:start till:1922 shift:($dx,15)   text:Wladimir~Iljitsch~[[Wladimir Iljitsch Lenin|Lenin]]
  from:1922  till:1953 shift:($dx,5)    text:Josef~[[Josef Stalin|Stalin]]
  from:1953  till:1964 shift:($dx,5)    text:Nikita~[[Nikita Chruschtschow|Chruschtschow]]
  from:1964  till:1982 shift:($dx,5)    text:Leonid~[[Leonid Breschnew|Breschnew]]
  from:1982  till:1984 shift:($dx,-12)  text:Juri~[[Juri Wladimirowitsch Andropow|Andropow]]
  from:1984  till:1985 shift:($dx,4)    text:Konstantin~[[Konstantin Tschernenko|Tschernenko]]
  from:1985  till:end  shift:($dx,10)   text:Michail~[[Michail Sergejewitsch Gorbatschow|Gorbatschow]]
| Template:Zeitleiste Erdaufbau | top next |
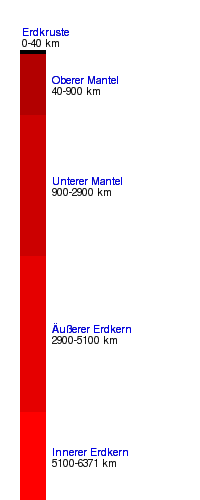
First version by JakobVoss on Friday, June 25, 2004, last update on Tuesday, January 10, 2006
ImageSize = width:200 height:500
PlotArea  = left:10% bottom:0% right:0% top:10%

DateFormat = yyyy
Period     = from:0 till:6371
TimeAxis   = orientation:vertical order:reverse

Colors=
  id:c1 value:rgb(1,0,0)
  id:c2 value:rgb(0.9,0,0)
  id:c3 value:rgb(0.8,0,0)
  id:c4 value:rgb(0.7,0,0)
  id:c5 value:rgb(0.6,0,0)
  id:c6 value:rgb(0,0,0)

PlotData =
  bar:Leaders width:25 align:left fontsize:S shift:(20,0)

  from:5100 till:6371 color:c1  text:"[[Erdkern|Innerer Erdkern]]~5100-6371 km"
  from:2900 till:5100 color:c2  text:"[[Äußerer Erdkern|Äußerer Erdkern]]~2900-5100 km"
  from:900  till:2900 color:c3  text:"[[Erdmantel|Unterer Mantel]]~900-2900 km"
  from:40  till:900  color:c4  text:"[[Erdmantel|Oberer Mantel]]~40-900 km"
  from:0    till:40   color:c6  text:"[[Erdkruste]]~0-40 km" shift:(-10,16)
| Österreichische Südbahn | top next |
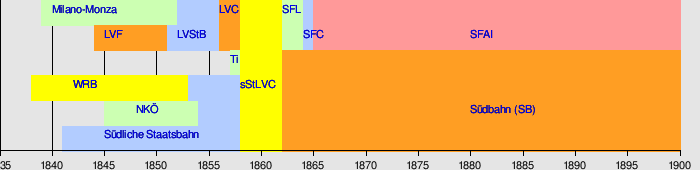
First version by Blieb on Sunday, March 5, 2006, last update on Monday, March 6, 2006
ImageSize  = width:700 height:170
PlotArea   = width:680 height:150 left:0 bottom:20
TimeAxis  = orientation:horizontal # dummy, required
Period    = from:1835 till:1900 # dummy, required
Define $s = fontsize:M
Colors =
  id:red        value:coral
  id:blue       value:skyblue
  id:green      value:limegreen
  id:yellow     value:yellow
  id:lightgrey  value:gray(0.9)
BackgroundColors = bars:lightgrey canvas:lightgrey
AlignBars=justify
DateFormat = yyyy
ScaleMajor = gridcolor:black unit:year increment:5 start:1835
PlotData=
  bar:MM        from:1839       till:1852 color:green
                at:1840         text:"[[Milano-Monza]]"
                from:1852       till:1856 color:blue
                from:1856       till:1858 color:orange
                at:1856         text:"[[Lombardisch-Venetianische & Centralitalienische Eisenbahngesellschaft|LVC]]"
                from:1858       till:1862 color:yellow
                from:1862       till:1864 color:green
                from:1864       till:1865 color:blue
                from:1865       till:1900 color:red
                at:1862         text:"[[Societa delle strade ferrate della Lombardia|SFL]]"
  bar:LVF       from:1844       till:1858 color:orange
                at:1845         text:"[[Lombardisch-Venetianische Ferdinands Eisenbahn-Gesellschaft|LVF]]"
                from:1851       till:1856 color:blue
                from:1856       till:1858 color:orange
                from:1858       till:1862 color:yellow
                from:1862       till:1864 color:green
                from:1864       till:1865 color:blue
                at:1864         text:"[[Societa delle strade ferrate dell' Italia Centrale|SFC]]"
                at:1880         text:"[[Societa delle strade ferrate dell' Alta Italia|SFAI]]"
                at:1852         text:"[[Lombardisch-Venetianische Staatsbahn|LVStB]]"
                from:1865       till:1900 color:red
  bar:Ti        from:1857       till:1858 color:green
                from:1858       till:1862 color:yellow
                from:1862       till:1900 color:orange
                at:1857         text:"[[Tiroler Staatsbahn|Ti]]"
  bar:WRB       from:1838       till:1853 color:yellow
                from:1853       till:1858 color:blue
                from:1858       till:1862 color:yellow
                from:1862       till:1900 color:orange
                at:1842         text:"[[Wien Raaberbahn|WRB]]"
                at:1858         text:"[[k.k. priv. südliche Staats-, lombardisch-ventianische & centralitalienische Eisenbahn-Gesellschaft|sStLVC]]"
  bar:NKÖ       from:1845       till:1854 color:green
                from:1854       till:1858 color:blue
                from:1858       till:1862 color:yellow
                from:1862       till:1900 color:orange
                at:1848         text:"[[Eisenbahn-Gesellschaft Wr. Neustadt-Katzelsdorf-Ödenburg|NKÖ]]"
                at:1880         text:"[[Südbahn-Gesellschaft|Südbahn (SB)]]"
  bar:SStB      from:1841       till:1858 color:blue
                from:1858       till:1862 color:yellow
                from:1862       till:1900 color:orange
                at:1845         text:"[[Südliche Staatsbahn]]"
| Template:Zeitleiste Tour de France Sieger | top next |
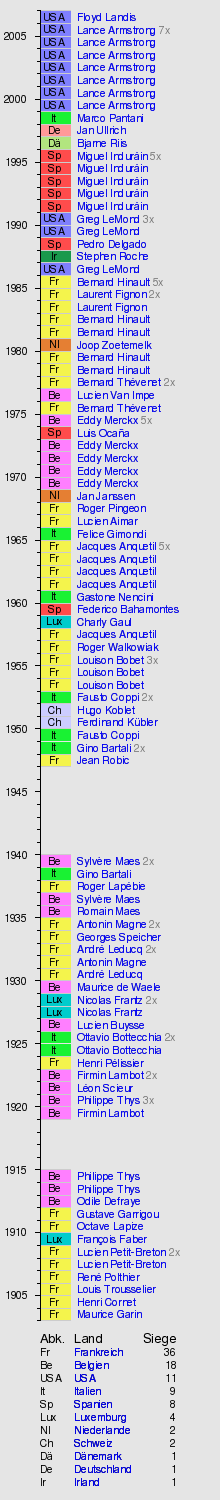
First version by Erik Zachte on Sunday, June 27, 2004, last update on Sunday, July 23, 2006
Preset     = TimeVertical_OneBar_UnitYear
ImageSize  = width:220 height:1500
PlotArea   = bottom:180 left:40
Period     = from:1903 till:2007
ScaleMajor = start:1905 increment:5
ScaleMinor = start:1903 increment:1

Colors =
  id:canvas      value:gray(0.9)
  id:Frankreich  value:rgb(0.96,0.96,0.3)     legend:Frankreich_(36)
  id:Belgien     value:rgb(1,0.5,1)     legend:Belgien_(18)
  id:USA         value:rgb(0.5,0.5,1)   legend:USA_(10)
  id:Italien     value:rgb(0.1,0.95,0.2)     legend:Italien_(9)
  id:Spanien     value:rgb(1,0.3,0.3)   legend:Spanien_(8)
  id:Luxemburg   value:rgb(0,0.8,0.8)   legend:Luxemburg_(4)
  id:Niederlande value:rgb(0.9,0.5,0.2)   legend:Niederlande_(2)
  id:Schweiz     value:rgb(0.8,0.8,1)   legend:Schweiz_(2)
  id:Dänemark    value:rgb(0.7,0.9,0.5)   legend:Dänemark_(1)
  id:Deutschland value:rgb(1,0.6,0.6)   legend:Deutschland_(1)
  id:Irland      value:rgb(0.1,0.6,0.3)   legend:Irland_(1)

  id:linemark    value:gray(0.8)
  id:linemark2   value:gray(0.9)
  id:grau        value:gray(0.5)

BackgroundColors = canvas:canvas

PlotData =
  mark:(line,linemark) anchor:from textcolor:grau shift:(22,2)

  from:1903 till:1904 text:"[[Maurice Garin]]" color:Frankreich
  from:1904 till:1905 text:"[[Henri Cornet]]" color:Frankreich
  from:1905 till:1906 text:"[[Louis Trousselier]]" color:Frankreich
  from:1906 till:1907 text:"[[René Polthier]]" color:Frankreich
  from:1907 till:1908 text:"[[Lucien Petit-Breton]]" color:Frankreich
  from:1908 till:1909 text:"[[Lucien Petit-Breton]] 2x" color:Frankreich
  from:1909 till:1910 text:"[[François Faber]]" color:Luxemburg
  from:1910 till:1911 text:"[[Octave Lapize]]" color:Frankreich
  from:1911 till:1912 text:"[[Gustave Garrigou]]" color:Frankreich
  from:1912 till:1913 text:"[[Odile Defraye]]" color:Belgien
  from:1913 till:1914 text:"[[Philippe Thys]]" color:Belgien
  from:1914 till:1915 text:"[[Philippe Thys]]" color:Belgien
  from:1919 till:1920 text:"[[Firmin Lambot]]" color:Belgien
  from:1920 till:1921 text:"[[Philippe Thys]] 3x" color:Belgien
  from:1921 till:1922 text:"[[Léon Scieur]]" color:Belgien
  from:1922 till:1923 text:"[[Firmin Lambot]] 2x" color:Belgien
  from:1923 till:1924 text:"[[Henri Pélissier]]" color:Frankreich
  from:1924 till:1925 text:"[[Ottavio Bottecchia]]" color:Italien
  from:1925 till:1926 text:"[[Ottavio Bottecchia]] 2x" color:Italien mark:(line,linemark2)
  from:1926 till:1927 text:"[[Lucien Buysse]]" color:Belgien
  from:1927 till:1928 text:"[[Nicolas Frantz]]" color:Luxemburg
  from:1928 till:1929 text:"[[Nicolas Frantz]] 2x" color:Luxemburg
  from:1929 till:1930 text:"[[Maurice de Waele]]" color:Belgien
  from:1930 till:1931 text:"[[André Leducq]]" color:Frankreich
  from:1931 till:1932 text:"[[Antonin Magne]]" color:Frankreich
  from:1932 till:1933 text:"[[André Leducq]] 2x" color:Frankreich
  from:1933 till:1934 text:"[[Georges Speicher]]" color:Frankreich
  from:1934 till:1935 text:"[[Antonin Magne]] 2x" color:Frankreich
  from:1935 till:1936 text:"[[Romain Maes]]" color:Belgien
  from:1936 till:1937 text:"[[Sylvère Maes]]" color:Belgien
  from:1937 till:1938 text:"[[Roger Lapébie]]" color:Frankreich
  from:1938 till:1939 text:"[[Gino Bartali]]" color:Italien
  from:1939 till:1940 text:"[[Sylvère Maes]] 2x" color:Belgien
  from:1947 till:1948 text:"[[Jean Robic]]" color:Frankreich
  from:1948 till:1949 text:"[[Gino Bartali]] 2x" color:Italien
  from:1949 till:1950 text:"[[Fausto Coppi]]" color:Italien mark:(line,linemark2)
  from:1950 till:1951 text:"[[Ferdinand Kübler]]" color:Schweiz
  from:1951 till:1952 text:"[[Hugo Koblet]]" color:Schweiz
  from:1952 till:1953 text:"[[Fausto Coppi]] 2x" color:Italien
  from:1953 till:1954 text:"[[Louison Bobet]]" color:Frankreich
  from:1954 till:1955 text:"[[Louison Bobet]]" color:Frankreich
  from:1955 till:1956 text:"[[Louison Bobet]] 3x" color:Frankreich
  from:1956 till:1957 text:"[[Roger Walkowiak]]" color:Frankreich
  from:1957 till:1958 text:"[[Jacques Anquetil]]" color:Frankreich
  from:1958 till:1959 text:"[[Charly Gaul]]" color:Luxemburg
  from:1959 till:1960 text:"[[Federico Bahamontes]]" color:Spanien
  from:1960 till:1961 text:"[[Gastone Nencini]]" color:Italien
  from:1961 till:1962 text:"[[Jacques Anquetil]]" color:Frankreich
  from:1962 till:1963 text:"[[Jacques Anquetil]]" color:Frankreich
  from:1963 till:1964 text:"[[Jacques Anquetil]]" color:Frankreich
  from:1964 till:1965 text:"[[Jacques Anquetil]] 5x" color:Frankreich
  from:1965 till:1966 text:"[[Felice Gimondi]]" color:Italien
  from:1966 till:1967 text:"[[Lucien Aimar]]" color:Frankreich
  from:1967 till:1968 text:"[[Roger Pingeon]]" color:Frankreich
  from:1968 till:1969 text:"[[Jan Janssen]]" color:Niederlande
  from:1969 till:1970 text:"[[Eddy Merckx]]" color:Belgien
  from:1970 till:1971 text:"[[Eddy Merckx]]" color:Belgien
  from:1971 till:1972 text:"[[Eddy Merckx]]" color:Belgien
  from:1972 till:1973 text:"[[Eddy Merckx]]" color:Belgien
  from:1973 till:1974 text:"[[Luis Ocana|Luis Ocaña]]" color:Spanien
  from:1974 till:1975 text:"[[Eddy Merckx]] 5x" color:Belgien
  from:1975 till:1976 text:"[[Bernard Thévenet]]" color:Frankreich
  from:1976 till:1977 text:"[[Lucien Van Impe]]" color:Belgien
  from:1977 till:1978 text:"[[Bernard Thévenet]] 2x" color:Frankreich
  from:1978 till:1979 text:"[[Bernard Hinault]]" color:Frankreich
  from:1979 till:1980 text:"[[Bernard Hinault]]" color:Frankreich
  from:1980 till:1981 text:"[[Joop Zoetemelk]]" color:Niederlande
  from:1981 till:1982 text:"[[Bernard Hinault]]" color:Frankreich
  from:1982 till:1983 text:"[[Bernard Hinault]]" color:Frankreich
  from:1983 till:1984 text:"[[Laurent Fignon]]" color:Frankreich
  from:1984 till:1985 text:"[[Laurent Fignon]] 2x" color:Frankreich
  from:1985 till:1986 text:"[[Bernard Hinault]] 5x" color:Frankreich
  from:1986 till:1987 text:"[[Greg LeMond]]" color:USA
  from:1987 till:1988 text:"[[Stephen Roche]]" color:Irland
  from:1988 till:1989 text:"[[Pedro Delgado]]" color:Spanien
  from:1989 till:1990 text:"[[Greg LeMond]]" color:USA
  from:1990 till:1991 text:"[[Greg LeMond]] 3x" color:USA
  from:1991 till:1992 text:"[[Miguel Induráin]]" color:Spanien
  from:1992 till:1993 text:"[[Miguel Induráin]]" color:Spanien
  from:1993 till:1994 text:"[[Miguel Induráin]]" color:Spanien
  from:1994 till:1995 text:"[[Miguel Induráin]]" color:Spanien
  from:1995 till:1996 text:"[[Miguel Induráin]] 5x" color:Spanien
  from:1996 till:1997 text:"[[Bjarne Riis]]" color:Dänemark
  from:1997 till:1998 text:"[[Jan Ullrich]]" color:Deutschland
  from:1998 till:1999 text:"[[Marco Pantani]]" color:Italien
  from:1999 till:2000 text:"[[Lance Armstrong]]" color:USA
  from:2000 till:2001 text:"[[Lance Armstrong]]" color:USA
  from:2001 till:2002 text:"[[Lance Armstrong]]" color:USA
  from:2002 till:2003 text:"[[Lance Armstrong]]" color:USA
  from:2003 till:2004 text:"[[Lance Armstrong]]" color:USA
  from:2004 till:2005 text:"[[Lance Armstrong]]" color:USA
  from:2005 till:2006 text:"[[Lance Armstrong]] 7x" color:USA
  from:2006 till:2007 text:"[[Floyd Landis]]" color:USA

  shift:(0,-4) anchor:middle align:center width:30 textcolor:black

  from:1903 till:1904 text:Fr  color:Frankreich
  from:1904 till:1905 text:Fr  color:Frankreich
  from:1905 till:1906 text:Fr  color:Frankreich
  from:1906 till:1907 text:Fr  color:Frankreich
  from:1907 till:1908 text:Fr  color:Frankreich
  from:1908 till:1909 text:Fr  color:Frankreich
  from:1909 till:1910 text:Lux color:Luxemburg
  from:1910 till:1911 text:Fr  color:Frankreich
  from:1911 till:1912 text:Fr  color:Frankreich
  from:1912 till:1913 text:Be  color:Belgien
  from:1913 till:1914 text:Be  color:Belgien
  from:1914 till:1915 text:Be  color:Belgien
  from:1919 till:1920 text:Be  color:Belgien
  from:1920 till:1921 text:Be  color:Belgien
  from:1921 till:1922 text:Be  color:Belgien
  from:1922 till:1923 text:Be  color:Belgien
  from:1923 till:1924 text:Fr  color:Frankreich
  from:1924 till:1925 text:It  color:Italien
  from:1925 till:1926 text:It  color:Italien mark:(line,linemark2)
  from:1926 till:1927 text:Be  color:Belgien
  from:1927 till:1928 text:Lux color:Luxemburg
  from:1928 till:1929 text:Lux color:Luxemburg
  from:1929 till:1930 text:Be  color:Belgien
  from:1930 till:1931 text:Fr  color:Frankreich
  from:1931 till:1932 text:Fr  color:Frankreich
  from:1932 till:1933 text:Fr  color:Frankreich
  from:1933 till:1934 text:Fr  color:Frankreich
  from:1934 till:1935 text:Fr  color:Frankreich
  from:1935 till:1936 text:Be  color:Belgien
  from:1936 till:1937 text:Be  color:Belgien
  from:1937 till:1938 text:Fr  color:Frankreich
  from:1938 till:1939 text:It  color:Italien
  from:1939 till:1940 text:Be  color:Belgien
  from:1947 till:1948 text:Fr  color:Frankreich
  from:1948 till:1949 text:It  color:Italien
  from:1949 till:1950 text:It  color:Italien mark:(line,linemark2)
  from:1950 till:1951 text:Ch  color:Schweiz
  from:1951 till:1952 text:Ch  color:Schweiz
  from:1952 till:1953 text:It  color:Italien
  from:1953 till:1954 text:Fr  color:Frankreich
  from:1954 till:1955 text:Fr  color:Frankreich
  from:1955 till:1956 text:Fr  color:Frankreich
  from:1956 till:1957 text:Fr  color:Frankreich
  from:1957 till:1958 text:Fr  color:Frankreich
  from:1958 till:1959 text:Lux color:Luxemburg
  from:1959 till:1960 text:Sp  color:Spanien
  from:1960 till:1961 text:It  color:Italien
  from:1961 till:1962 text:Fr  color:Frankreich
  from:1962 till:1963 text:Fr  color:Frankreich
  from:1963 till:1964 text:Fr  color:Frankreich
  from:1964 till:1965 text:Fr  color:Frankreich
  from:1965 till:1966 text:It  color:Italien
  from:1966 till:1967 text:Fr  color:Frankreich
  from:1967 till:1968 text:Fr  color:Frankreich
  from:1968 till:1969 text:Nl  color:Niederlande
  from:1969 till:1970 text:Be  color:Belgien
  from:1970 till:1971 text:Be  color:Belgien
  from:1971 till:1972 text:Be  color:Belgien
  from:1972 till:1973 text:Be  color:Belgien
  from:1973 till:1974 text:Sp  color:Spanien
  from:1974 till:1975 text:Be  color:Belgien
  from:1975 till:1976 text:Fr  color:Frankreich
  from:1976 till:1977 text:Be  color:Belgien
  from:1977 till:1978 text:Fr  color:Frankreich
  from:1978 till:1979 text:Fr  color:Frankreich
  from:1979 till:1980 text:Fr  color:Frankreich
  from:1980 till:1981 text:Nl  color:Niederlande
  from:1981 till:1982 text:Fr  color:Frankreich
  from:1982 till:1983 text:Fr  color:Frankreich
  from:1983 till:1984 text:Fr  color:Frankreich
  from:1984 till:1985 text:Fr  color:Frankreich
  from:1985 till:1986 text:Fr  color:Frankreich
  from:1986 till:1987 text:USA color:USA
  from:1987 till:1988 text:Ir  color:Irland
  from:1988 till:1989 text:Sp  color:Spanien
  from:1989 till:1990 text:USA color:USA
  from:1990 till:1991 text:USA color:USA
  from:1991 till:1992 text:Sp  color:Spanien
  from:1992 till:1993 text:Sp  color:Spanien
  from:1993 till:1994 text:Sp  color:Spanien
  from:1994 till:1995 text:Sp  color:Spanien
  from:1995 till:1996 text:Sp  color:Spanien
  from:1996 till:1997 text:Dä  color:Dänemark
  from:1997 till:1998 text:De  color:Deutschland
  from:1998 till:1999 text:It  color:Italien
  from:1999 till:2000 text:USA color:USA
  from:2000 till:2001 text:USA color:USA
  from:2001 till:2002 text:USA color:USA
  from:2002 till:2003 text:USA color:USA
  from:2003 till:2004 text:USA color:USA
  from:2004 till:2005 text:USA color:USA
  from:2005 till:2006 text:USA color:USA
  from:2006 till:2007 text:USA color:USA

TextData =
  pos:(40,170) tabs:(0-left,35-left,140-right)
  text:^Abk.^Land^Siege fontsize:M
  text:^Fr^[[Frankreich]]^36
  text:^Be^[[Belgien]]^18
  text:^USA^[[USA]]^11
  text:^It^[[Italien]]^9
  text:^Sp^[[Spanien]]^8
  text:^Lux^[[Luxemburg]]^4
  text:^Nl^[[Niederlande]]^2
  text:^Ch^[[Schweiz]]^2
  text:^Dä^[[Dänemark]]^1
  text:^De^[[Deutschland]]^1
  text:^Ir^[[Irland]]^1
| Template:Zeitleiste Schweizer Geschichte | top next |
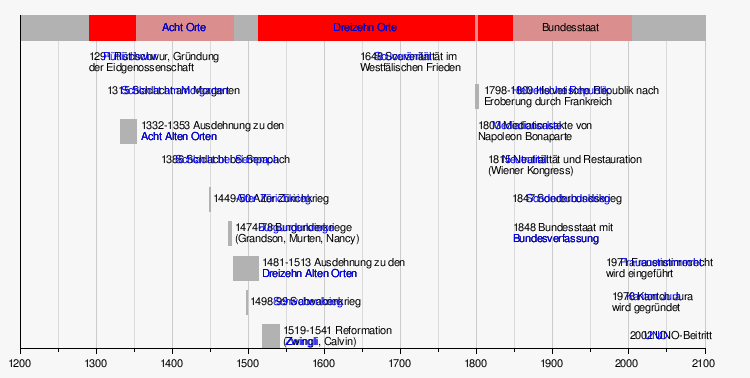
First version by Filzstift on Thursday, July 1, 2004, last update on Tuesday, May 30, 2006
DateFormat = yyyy
ImageSize  = width:750 height:auto barincrement:37
PlotArea   = left:20 right:45 bottom:30 top:15

Colors     =
  id:canvas      value:rgb(0.97,0.97,0.97)
  id:grid1       value:rgb(0.80,0.80,0.80)
  id:grid2       value:rgb(0.86,0.86,0.86)
  id:Timeperiod  value:red
  id:Timeperiod2 value:rgb(0.86,0.56,0.56)
  id:grau        value:gray(0.7)

Period     = from:1200 till:2100
TimeAxis   = orientation:horizontal format:yyyy
ScaleMajor = unit:year  increment:100 start:1200 gridcolor:grid1
ScaleMinor = unit:year  increment:50  start:1200 gridcolor:grid2
AlignBars  = justify

BackgroundColors = canvas:canvas bars:canvas

BarData=
  bar:Timeperiod
  barset:Timeperiod2

PlotData=
  width:25 fontsize:S textcolor:black align:center

  bar:Timeperiod color:Timeperiod shift:(0,-3)
  from:start      till:end color:grau # Hintergrund
  from:1291 till:1353 text: " "
  from:1353 till:1481 text: "[[Die Acht Alten Orte|Acht Orte]]" color:Timeperiod2
  from:1513 till:1798 text: "[[Die Dreizehn Alten Orte|Dreizehn Orte]]"
  from:1798 till:1803 text: " " color:Timeperiod2
  from:1803 till:1848 text: " "
  from:1848 till:2004 text: "Bundesstaat" color:Timeperiod2

  width:24 fontsize:S textcolor:black anchor:from align:left color:grau
  barset:Timeperiod2
  at:1291             text:"1291 [[Rütli-Schwur|Rütlischwur]], Gründung~der Eidgenossenschaft" shift:(0,2)
  at:1315             text:"1315 [[Schlacht am Morgarten]]" shift:(0,2)
  from:1332 till:1353 text: "1332-1353 Ausdehnung zu den~[[Die Acht Alten Orte|Acht Alten Orten]]" shift:(21,2)
  at:1386             text:"1386 [[Schlacht bei Sempach]]" shift:(0,2)
  from:1449 till:1450 text: "1449-50 [[Alter Zürichkrieg|Alter Zürichkrieg]]" shift:(4,-3)
  from:1474 till:1478 text: "1474-78 [[Burgunderkriege]]~(Grandson, Murten, Nancy)" shift:(7,2)
  from:1481 till:1513 text: "1481-1513 Ausdehnung zu den~[[Die Dreizehn Alte Orte|Dreizehn Alten Orten]]" shift:(29,2)
  from:1498 till:1499 text: "1498-99 [[Schwabenkrieg]]" shift:(4,-3)
  from:1519 till:1541 text: "1519-1541 Reformation~([[Ulrich Zwingli|Zwingli]], [[Johannes Calvin|Calvin]])" shift:(21,2)
  barset:break
  at:1648             text:"1648 [[Souveränität|Souveränität]] im~Westfälischen Frieden" shift:(0,2)
  from:1798 till:1803 text: "1798-1803 [[Helvetische Republik]] nach ~Eroberung durch Frankreich" shift:(9,2)
  at:1803             text:"1803 [[Mediationsakte]] von~Napoleon Bonaparte" shift:(0,2)
  at:1815             text:"1815 [[Neutralität|Neutralität]] und Restauration~(Wiener Kongress)" shift:(0,2)
  at:1847             text:"1847 [[Sonderbundskrieg]]" shift:(0,-3)
  at:1848             text:"1848 Bundesstaat mit~[[Bundesverfassung (Schweiz)|Bundesverfassung]]" shift:(0,2)
  at:1971             text:"1971 [[Frauenstimmrecht (Schweiz)|Frauenstimmrecht]] ~wird eingeführt" shift:(0,2)
  at:1978             text:"1978 [[Kanton Jura]]~wird gegründet" shift:(0,2)
  at:2002             text:"2002 [[UNO]]-Beitritt" shift:(0,-3)
| Template:Zeitleiste Computergeschichte | top next |

First version by Filzstift on Thursday, July 1, 2004, last update on Thursday, June 1, 2006
Preset    = TimeHorizontal_AutoPlaceBars_UnitYear
ImageSize = width:800 barincrement:16
PlotArea  = left:30 right:45 bottom:40

Colors     =
  id:canvas  value:rgb(0.97,0.97,0.97)
  id:grid1   value:gray(0.7)
  id:grid2   value:gray(0.88)
  id:black   value:rgb(0,0,0)
  id:section value:rgb(0.8,0.8,0)
  id:mark1   value:rgb(0.7,0,0)
  id:years   value:gray(0.5)

BackgroundColors = canvas:canvas

Period     = from:1940 till:2010
ScaleMajor = unit:year increment:10 start:1940 gridcolor:grid1
ScaleMinor = unit:year increment:1 start:1940 gridcolor:grid2
AlignBars  = justify

BarData=

  bar:title
# bar:periods
  bar:dummy0 # empty bar functions as separator
  bar:section1
  barset:quotes
  bar:dummy1
  bar:section2
  barset:first_use
  bar:dummy2
  bar:section3
  barset:hardware_systems
  bar:dummy3
  bar:section4
  barset:operating_systems
  bar:dummy4
  bar:section5
  barset:sys_dev_software
  bar:dummy5
  bar:section6
  barset:applications
  bar:dummy6


# explanation: attribute 'barset' instead of 'bar' means consecutive data lines are automatically placed on new bar
#              data lines are lines containing at: or from: & till: attributes
#              'barset:break' means 'reset barcounter' = next line will be placed at first bar in barset
#              'barset:skip'  means 'increment barcounter' = skip one bar for next data line (to allow extra space
#                                                                              for text containing line break = ~)
PlotData =

  mark:(line,black)
  width:16
  fontsize:S


# bar:periods
# from:1964 till:1972 text:"3. Generation" width:16"

# at:1975 text"[[Microsoft]] gegründet"
# at:1976 text"[[Apple]] Computer gegründet"
# at:1983 text"[[Borland]] gegründet"


  fontsize:M
  width:16
  color:section
  mark:(line,section)
  shift:(5,-6)

  bar:title    from:start till:end text:"Computergeschichte" fontsize:XL anchor:middle align:center width:25 color:canvas mark:(line,canvas)
  bar:section1 from:start till:end text:"Voraussagungen"
  bar:section2 from:start till:end text:"Erfindungen"
  bar:section3 from:start till:end text:"Hardware"
  bar:section4 from:start till:end text:"Betriebssysteme"
  bar:section5 from:start till:end text:"Programmiersprachen"
  bar:section6 from:start till:end text:"Anwendungen"

  shift:(5,-5)
  fontsize:S
  mark:(line,mark1)

  width:8
  barset:quotes
  at:1943 text:"„Ich denke, es besteht weltweit ein Markt für vielleicht fünf Computer.“ [[Thomas J. Watson]], Chairman von [[IBM]]"
  at:1949 text:"„Künftige Computer werden voraussichtlich leichter als 1,5 Tonnen sein.“"
  at:1965 text:"[[Mooresches Gesetz]]: Komplexität der Prozessoren wird jedes Jahr verdoppelt,~1975 revidiert: Komplexität wird alle zwei Jahre verdoppelt. [[Gordon Moore]]"
#  barset:skip
  shift:(5,-5)
  at:1977 text:"„Es gibt keinen Sinn, einen Computer zu Hause~zu haben.“ (Ken Olson, Chairman von [[Digital Equipment Corporation|DEC]])" shift:(8,-12)


  fontsize:S
  barset:first_use
  shift:(5,-5)
  at:1940 text:"[[Fernschreiber]]"
  at:1947 text:"([[Transistor]])"
  at:1948 text:"[[RAM|Random Access Memory]]"
  at:1948 text:"[[Magnettrommelspeicher]]"
  at:1949 text:"[[Register (Computer)|Register]]"
  at:1953 text:"[[Kernspeicher|Magnetkernspeicher]]"
  at:1956 text:"[[Festplatte]]"
  at:1957 text:"[[Matrixdrucker]]"
  at:1958 text:"[[Integrierter Schaltkreis]]"
  at:1962 text:"[[Spooling]],~[[Interrupt]]e,~[[Virtueller Speicher]]~[[Paging]]~([[ATLAS]])"
  barset:skip
  barset:break
  at:1963 text:"[[Maus (EDV)|Maus]]"
  at:1965 text:"[[Time Sharing]]"
  at:1965 text:"[[Fuzzy Logik]]"
  at:1965 text:"[[Paketvermittlung]]"
  at:1969 text:"[[ARPANET]], Vorläufer~des [[Internet]]"
  barset:skip
  at:1969 text:"[[RS-232]]"
  at:1970 text:"Dynamisches [[RAM]]"
  at:1971 text:"[[Diskette]]"
  at:1971 text:"[[Mikroprozessor]]~(4004)"
  barset:skip
  at:1972 text:"[[Spielkonsole]]~([[Pong]])"
  barset:skip
  at:1973 text:"[[TCP/IP]] 1982 ??"
  at:1973 text:"[[Ethernet]]"
  at:1975 text:"[[single Board~Computer]]"
  barset:break
  at:1976 text:"[[Laserdrucker]]"
  at:1976 text:"[[Supercomputer]]~([[Cray]])"
  barset:skip
  at:1979 text:"[[Compact Disc]]"
  at:1981 text:"[[WIMP]] ([[GUI]])"
  at:1981 text:"[[Color Graphics Adapter|CGA]]-Grafikkarte"
  at:1982 text:"[[MIDI]]"
  at:1982 text:"[[RISC]]"
  at:1982 text:"Laptop"
  barset:skip
  barset:skip
  at:1983 text:"Mathematischer~[[Koprozessor]]"
  barset:skip
  at:1983 text:"PC-Festplatte"
  at:1984 text:"[[GNU|GNU Projekt]]"
  at:1984 text:"[[Domain Name System|DNS]] (Domain~Name Server)"
  barset:skip
  at:1984 text:"[[Advanced Technology Attachment|IDE]]-Schnittstelle"
  at:1985 text:"[[Expanded Memory]]"
  at:1985 text:"[[Postscript]]"
  barset:break
  at:1985 text:"[[Enhanced Graphics Adapter|EGA]]-Grafikkarte"
  at:1985 text:"[[CD-ROM]]"
  at:1986 text:"[[SCSI]]"
  at:1987 text:"Paralelles Rechnen~([[Connection Machine]])"
  barset:skip
  barset:skip
  at:1987 text:"[[VGA]]-Grafikkarte"
  at:1987 text:"PC-[[Soundkarte]] (AD-LIB)"
  at:1988 text:"Optische Chips"
  at:1988 text:"[[Extended Industry Standard Architecture|EISA]]-Bus"
  at:1989 text:"[[Advanced Technology Attachment|ATA]]-Schnittstelle"
  at:1990 text:"[[SVGA]]-Grafikkarte,~[[VESA]]-Treiber"
  barset:skip
  at:1991 text:"[[Industry Standard Architecture|ISA]]-Bus"
  at:1992 text:"CD-I"
  at:1994 text:"[[Desoxyribonukleinsäure|DNA]]-Computer"

# major or well known operating systems selection based on
# http://en.wikipedia.org/wiki/Timeline_of_computing_500_BC-1949

  barset:hardware_systems

  at:1940 text:"Model I~Relaisrechner"
  barset:skip
  at:1941 text:"[[Atanasoff~Berry Computer]]"
  barset:skip
  at:1941 text:"[[Zuse Z3|Z3]]"
  at:1943 text:"[[Harvard Mark I]]"
  at:1943 text:"Relay Interpolator"
  at:1943 text:"[[Colossus]]"
  at:1946 text:"[[ENIAC]]"
  barset:break
  at:1962 text:"[[ATLAS]]"
  at:1964 text:"[[IBM 360]]"
  at:1964 text:"DEC [[PDP-8]]"
  at:1965 text:"[[CDC 6600]]~1. Supercomputer"
  barset:skip
  at:1971 text:"Taschen-~rechner~TI"
  barset:skip
  at:1971 text:"([[Intel_4004|4004]])"
  at:1972 text:"Wissenschaft-~licher Rechner~HP"
  barset:skip
  at:1972 text:"([[Intel_8008|8008]])"
  at:1972 text:"1. 32-bit~ Supermini"
  barset:skip
  at:1974 text:"([[Intel_8080|8080]])"
  at:1974 text:"([[Intel_8080|MC 6800]])"
  at:1974 text:"[[Altair 8800]]~Personal~Computer"
  barset:skip
  barset:break
  at:1976 text:"([[Zilog Z80|Z80]])"
  at:1976 text:"([[MOS Technologies 6502|6502]])"
  at:1976 text:"[[Cray|Cray-1]]"
  at:1977 text:"Apple II"
  at:1977 text:"[[TRS-80]]"
  at:1978 text:"(8086)"
  at:1979 text:"[[Commodore PET|PET]]"
  at:1979 text:"(68000)"
  at:1980 text:"[[Commodore VIC-20|VIC-20]]"
  at:1980 text:"[[ZX80]]"
  at:1981 text:"[[8010]]~'Star'"
  barset:skip
  at:1981 text:"[[ZX81]]"
  at:1981 text:"IBM PC"
  at:1982 text:"[[BBC~Micro]]"
  barset:skip
  at:1982 text:"[[Commodore 64|C64]]"
  barset:break
  at:1982 text:"(80286)"
  at:1982 text:"Compaq~Portable"
  barset:skip
  at:1982 text:"[[ZX Spectrum]]"
  at:1983 text:"[[Lisa]]"
  at:1983 text:"IBM XT"
  at:1983 text:"IBM PC junior"
  at:1983 text:"[[Apple Macintosh|Macintosh]]"
  at:1984 text:"LaserJet Drucker"
  at:1984 text:"IBM AT"
  at:1985 text:"[[A1000|Amiga 1000]]"
  at:1985 text:"[[Atari ST]]"
  at:1986 text:"Amstrad 1512"
  at:1987 text:"Acorn Archimedes"
  at:1987 text:"[[Connection Machine]]"
  at:1987 text:"IBM [[PS/2]]"
  barset:break
  at:1989 text:"(80486)"
  at:1993 text:"(66 MHz Pentium)"
  at:1998 text:"iMac"
  at:1999 text:"PowerMac"
  at:2000 text:"(1 GHz Pentium)"
  at:2003 text:"[[PowerPC 970|PowerPC G5]]
  at:2003 text:"[[Athlon 64]]

# major or well known operating systems selection based on
# http://en.wikipedia.org/wiki/Operating_systems_timeline

  barset:operating_systems

  at:1965 text:"[[OS/360]]"
  at:1967 text:"[[CP/CMS]]"
  at:1969 text:"[[Airline Control Program|ACP]]"
  at:1969 text:"[[Unix]]"
  at:1972 text:"[[VM/CMS]]"
  at:1974 text:"[[MVS]]"
  at:1976 text:"[[CP/M|CP/M]]"
  at:1978 text:"[[Apple DOS|Apple DOS 3.1]]"
  at:1978 text:"[[Virtual Memory System|VMS]]"
  at:1980 text:"[[OS-9]]"
  at:1981 text:"[[MS-DOS]]"
  at:1982 text:"[[SunOS]]"
  at:1983 text:"[[Apple Lisa|Lisa OS]]"
  barset:break
  at:1984 text:"[[Mac OS|Macintosh OS]]"
  at:1985 text:"[[AmigaOS]]"
  at:1985 text:"[[TOS|Atari TOS]]"
  at:1985 text:"[[Windows|Windows 1.0]]"
  at:1986 text:"[[AIX operating system|AIX]]"
  at:1986 text:"[[Apple IIgs|GS-OS]]"
  at:1986 text:"[[HP-UX]]"
  at:1987 text:"[[IRIX]]"
  at:1987 text:"[[Minix]]"
  at:1987 text:"[[OS/2]]"
  at:1987 text:"[[Windows|Windows 2.0]]"
  at:1988 text:"[[OS/400]]"
  at:1989 text:"[[NEXTSTEP|NeXTSTEP]]"
  at:1989 text:"[[RISC OS]]"
  at:1989 text:"[[SCO UNIX|SCO Unix]]"
  at:1990 text:"[[BeOS]]"
  at:1990 text:"[[OSF/1]]"
  at:1991 text:"[[Linux]]"
  barset:break
  at:1992 text:"[[Solaris]]"
  at:1992 text:"[[Windows|Windows 3.1]]"
  at:1993 text:"[[Windows|Windows NT 3.1]]"
  at:1994 text:"[[Red Hat Linux]]"
  at:1995 text:"[[OpenBSD]]"
  at:1995 text:"[[OS/390]]"
  at:1995 text:"[[Windows 95]]"
  at:1996 text:"[[Debian|Debian GNU/Linux]]"
  at:1997 text:"[[Mac OS|Mac OS 7.6]]"
  at:1998 text:"[[Windows 98]]"
  at:1999 text:"[[Mac OS|Mac OS 8]]"
  at:2000 text:"[[Mac OS|Mac OS 9]]"
  at:2000 text:"[[Windows ME]]"
  at:2000 text:"[[Windows 2000]]"
  at:2001 text:"[[Mac OS X]]"
  at:2001 text:"[[Windows XP]]"
  at:2001 text:"[[Z/OS|z/OS]]"
  at:2003 text:"[[Windows~Server~2003]]" shift:(5,1)

# major or well known programming languages & dev tools selection based on
# http://en.wikipedia.org/wiki/Timeline_of_programming_languages
# generally only first versions are listed

  barset:sys_dev_software
  at:1945 text:"[[Plankalkül]]"
  at:1952 text:"[[A-0]]"
  at:1954 text:"[[Mark I Autocode|Mark I]]"
  at:1954 text:"[[FORTRAN]]"
  at:1958 text:"[[ALGOL|Algol 58]]"
  at:1959 text:"[[LISP]]"
  at:1960 text:"[[COBOL]]"
  at:1962 text:"[[APL (Programmiersprache)|APL]]"
  barset:break
  at:1962 text:"[[Simula]]"
  at:1964 text:"[[PLI|PL/I]]"
  at:1964 text:"[[BASIC|BASIC]]"
  at:1968 text:"[[Logo|Logo]]"
  at:1971 text:"[[Pascal (Programmiersprache)|Pascal]]"
  at:1972 text:"[[Smalltalk|Smalltalk]]"
  at:1972 text:"[[C (Programmiersprache)|C]]"
  at:1972 text:"[[Prolog|PROLOG]]"
  barset:break
  at:1978 text:"[[VISICALC]]"
  at:1979 text:"[[REXX]]"
  at:1979 text:"[[DBASE]]-II"
  at:1983 text:"[[Ada|Ada]]"
  at:1983 text:"[[C-Plusplus|C++]]"
  barset:skip
  at:1983 text:"[[Turbo~Pascal]]"
  barset:break
  at:1985 text:"[[PARADOX]]"
  at:1985 text:"[[PostScript]]"
  at:1986 text:"[[Eiffel (Programmiersprache)|Eiffel]]"
  at:1987 text:"[[HyperCard|HyperTalk]]"
  at:1987 text:"[[SQL|SQL]]"
  at:1987 text:"[[Perl]]"
  at:1991 text:"[[Python (Programmiersprache)|Python]]"
  at:1991 text:"[[Visual Basic]]"
  barset:break
  at:1993 text:"[[AppleScript]]"
  at:1995 text:"[[Delphi (Programmiersprache)|Delphi]]"
  at:1995 text:"[[JavaScript]]"
  at:1995 text:"[[Java (Programmiersprache)|Java]]"
  at:1997 text:"[[PHP]]"
  at:2000 text:"[[D (Programmiersprache)|D]]"
  at:2000 text:"[[C-Sharp|C#]]"
  at:2001 text:"[[Kylix|KYLIX]]"

  barset:applications
  at:1951 text:"[[Elektronische Musik]]"
  at:1960 text:"[[Compiler]]"
  at:1962 text:"[[Computerspiel|Game]] (Space War)"
  at:1965 text:"Schwarzes Brett"
  at:1965 text:"[[E-Mail]] (1971 ?)"
  at:1965 text:"[[CDC 6600|Supercomputer]]"
  at:1968 text:"Interaktive Computer~(Maus, Fenster, Hypertext,~Bildschirmtextverarbeitung)"
  barset:skip
  barset:skip
  barset:break
  at:1969 text:"[[Netzwerk]] (ARPANET)"
  at:1970 text:"Flugdatenprozessor ?"
  at:1972 text:"[[Arcade|Arcade-Konsole]] (Pong)"
  at:1977 text:"[[Tabellenkalkulation]] (Visicalc)"
  at:1979 text:"[[Usenet]]"
  at:1984 text:"[[WYSIWYG]]-Textverarbeitung"
  at:1989 text:"[[World Wide Web]]"

# extra years
  mark:(line,grid1)
  bar:dummy1
  shift:(2,-8)
  fontsize:XS
  textcolor:years
  at:1940 text:40
  at:1950 text:50
  at:1960 text:60
  at:1970 text:70
  at:1980 text:80
  at:1990 text:90
  shift:(-10,-8)
  at:2000 text:2000
  bar:dummy2
  shift:(2,-8)
  at:1940 text:40
  at:1950 text:50
  at:1960 text:60
  at:1970 text:70
  at:1980 text:80
  at:1990 text:90
  shift:(-10,-8)
  at:2000 text:2000
  bar:dummy3
  shift:(2,-8)
  at:1940 text:40
  at:1950 text:50
  at:1960 text:60
  at:1970 text:70
  at:1980 text:80
  at:1990 text:90
  shift:(-10,-8)
  at:2000 text:2000
  bar:dummy4
  shift:(2,-8)
  at:1940 text:40
  at:1950 text:50
  at:1960 text:60
  at:1970 text:70
  at:1980 text:80
  at:1990 text:90
  shift:(-10,-8)
  at:2000 text:2000
  bar:dummy5
  shift:(2,-8)
  at:1940 text:40
  at:1950 text:50
  at:1960 text:60
  at:1970 text:70
  at:1980 text:80
  at:1990 text:90
  shift:(-10,-8)
  at:2000 text:2000

TextData =
  textcolor:black fontsize:XS
  pos:(30,2)  text:"Erzeugt mit [[meta:EasyTimeline|EasyTimeline]]"
  pos:(620,2) text:"Quelle [[en:Template:Timeline_History_of_Computing|En-Wikipedia]]"
| Template:Zeitleiste Wehrpflichtdauer BRD | top next |

First version by Tkarcher on Friday, July 2, 2004, last update on Sunday, January 30, 2005
# Zeitleiste der Wehrpflicht-Dauer in der BRD von 1957 bis heute
# Quellen:
# http://www.bundeswehr.de/forces/grundlagen/wehrpflicht/wd_geschichte.php
# http://www.bmfsfj.de/Politikbereiche/zivildienst,did=11656,render=renderPrint.html

ImageSize  = width:600 height:70
PlotArea   = width:460 height:50 left:140 bottom:20
AlignBars  = justify

DateFormat = yyyy
Period     = from:1957 till:2005
TimeAxis   = orientation:horizontal
ScaleMajor = unit:year increment:10 start:1960
ScaleMinor = unit:year increment:2 start:1958

PlotData=
  textcolor:white

  bar:Grundwehrdienst color:green mark:(line,white) shift:(0,-4) width:20 align:center

  from:start till:1962 text:12
  from:1962  till:1973 text:18
  from:1973  till:1990 text:15
  from:1990  till:1996 text:12
  from:1996  till:2002 text:10
  from:2002  till:end  text:9

  bar:Ersatz-/Zivildienst color:red shift:(0,-4) mark:(line,white) width:20 align:center

  from:1961  till:1962 text:15
  from:1962  till:1973 text:18
  from:1973  till:1984 text:16
  from:1984  till:1990 text:20
  from:1990  till:1996 text:15
  from:1996  till:2000 text:13
  from:2000  till:2002 text:11
  from:2002  till:2004 text:10
  from:2004  till:end  text:9
| Template:Zeitleiste Deutsche Innenminister | top next |

First version by Manu on Monday, July 5, 2004, last update on Sunday, November 27, 2005
ImageSize	= width:260 height:450
PlotArea	= left:40 right:0 bottom:50 top:10
Legend          = columns:3 left:40 top:40 columnwidth:50

DateFormat	= dd/mm/yyyy
Period		= from:20/09/1949 till:31/12/2007
TimeAxis	= orientation:vertical format:yyyy

ScaleMajor	= unit:year increment:4 start:1950

Colors=
 id:CDU	value:black	legend:CDU
 id:CSU value:blue      legend:CSU
 id:SPD value:red	legend:SPD
 id:FDP value:yellow	legend:FDP
 id:grau value:gray(0.8) # yellow bar and white lines are difficult to see

PlotData=
 bar:Innenminister color:CDU width:20 fontsize:M align:left shift:(20,-5) mark:(line,grau)

 from:start till:11/10/1950 text:[[Gustav_Heinemann]] color:CDU
 from:11/10/1950 till:20/10/1953 text:[[Robert_Lehr]] color:CDU
 from:20/10/1953 till:13/11/1961 text:[[Gerhard_Schröder%20(CDU)|Gerhard_Schröder]] color:CDU
 from:14/11/1961 till:25/10/1965 text:[[Hermann_Höcherl]] color:CSU
 from:26/10/1965 till:02/04/1968 text:[[Paul_Lücke]] color:CDU
 from:02/04/1968 till:21/10/1969 text:[[Ernst_Benda]] color:CDU
 from:22/10/1969 till:16/05/1974 text:[[Hans-Dietrich_Genscher]] color:FDP
 from:16/05/1974 till:08/06/1978 text:[[Werner_Maihofer]] color:FDP
 from:08/06/1978 till:17/09/1982 text:[[Gerhart_Baum]] color:FDP
 from:17/09/1982 till:01/10/1982 text:[[Jürgen_Schmude]] color:SPD
 from:04/10/1982 till:21/04/1989 text:[[Friedrich_Zimmermann]] color:CSU
 from:21/04/1989 till:26/11/1991 text:[[Wolfgang_Schäuble]] color:CDU
 from:26/11/1991 till:07/07/1993 text:[[Rudolf_Seiters]] color:CDU
 from:07/07/1993 till:26/10/1998 text:[[Manfred_Kanther]] color:CDU
 from:27/10/1998 till:22/11/2005 text:[[Otto_Schily]] color:SPD
 from:22/11/2005 till:end text:[[Wolfgang_Schäuble]] color:CDU
| Template:Zeitleiste Bundespräsidenten (Österreich) | top next |

First version by 143.50.221.194 on Tuesday, July 6, 2004, last update on Monday, June 12, 2006
ImageSize  = width:230 height:500
PlotArea   = left:50 right:0 top:15 bottom:40
Legend     = columns:3 left:15 top:25 columnwidth:50

DateFormat = yyyy
Period     = from:1945 till:2006
TimeAxis   = orientation:vertical
ScaleMajor = unit:year increment:6 start:1945

# there is no automatic collision detection,
# so shift texts up or down manually to avoid overlap

Colors=
  id:ÖVP  value:gray(0.25) legend:ÖVP
  id:SPÖ  value:red        legend:SPÖ

Define $dx = 25 # shift text to right side of bar

PlotData=

  bar:BPräs color:red width:25 mark:(line,white) align:left fontsize:7 shift:($dx,0)

  from:1945  till:1951 color:SPÖ text:[[Karl Renner]]
  from:1951  till:1957 color:SPÖ text:[[Theodor Körner%20(Bundespräsident)|Theodor Körner]]
  from:1957  till:1965 color:SPÖ text:[[Adolf Schärf|Adolf Schärf]]
  from:1965  till:1974 color:SPÖ text:[[Franz Jonas]]
  from:1974  till:1986 color:SPÖ text:[[Rudolf Kirchschläger|Rudolf Kirchschläger]]
  from:1986  till:1992 color:ÖVP text:[[Kurt Waldheim]]
  from:1992  till:2004 color:ÖVP text:[[Thomas Klestil]]
  from:2004  till:end  color:SPÖ text:[[Heinz Fischer]]
| Template:Zeitleiste Bundeskanzler (Österreich) | top next |

First version by Gugganij on Tuesday, July 6, 2004, last update on Tuesday, May 16, 2006
ImageSize  = width:220 height:500
PlotArea   = left:50 right:10 top:10 bottom:40
Legend     = columns:3 left:15 top:25 columnwidth:50

DateFormat = yyyy
Period     = from:1945 till:2006
TimeAxis   = orientation:vertical
ScaleMajor = unit:year increment:6 start:1945

# there is no automatic collision detection,
# so shift texts up or down manually to avoid overlap

Colors=
  id:ÖVP  value:gray(0.25) legend:ÖVP
  id:SPÖ  value:red        legend:SPÖ

Define $dx = 25 # shift text to right side of bar

PlotData=

  bar:BdKzl color:red width:25 mark:(line,white) align:left fontsize:S shift:($dx,-4)

  from:1945  till:1946 color:SPÖ text:[[Karl Renner]]
  from:1946  till:1953 color:ÖVP text:[[Leopold Figl]]
  from:1953  till:1961 color:ÖVP text:[[Julius Raab]]
  from:1961  till:1964 color:ÖVP text:[[Alfons Gorbach]]
  from:1964  till:1970 color:ÖVP text:[[Josef Klaus]]
  from:1970  till:1983 color:SPÖ text:[[Bruno Kreisky]]
  from:1983  till:1986 color:SPÖ text:[[Fred Sinowatz]]
  from:1986  till:1997 color:SPÖ text:[[Franz Vranitzky]]
  from:1997  till:2000 color:SPÖ text:[[Viktor Klima]]
  from:2000  till:end  color:ÖVP text:[[Wolfgang Schüssel|Wolfgang Schüssel]]
| Template:Zeitleiste Bundesregierungen (Österreich) | top next |

First version by Gugganij on Tuesday, July 6, 2004, last update on Monday, June 12, 2006
ImageSize  = width:600 height:500
PlotArea   = width:530  height:450 left:50 bottom:40
Legend    = columns:4 left:15 top:25 columnwidth:50

DateFormat = yyyy
Period     = from:1945 till:2006
TimeAxis   = orientation:vertical
ScaleMajor = unit:year increment:4 start:1945

# there is no automatic collision detection,
# so shift texts up or down manually to avoid overlap

Colors=
  id:ÖVP  value:gray(0.25) legend:ÖVP
  id:SPÖ  value:red    legend:SPÖ
  id:FPÖ  value:blue    legend:FPÖ
  id:BZÖ  value:orange    legend:BZÖ

Define $dx = 25 # shift text to right side of bar
Define $dy = -4 # adjust height

PlotData=


  bar:Bundesregierung color:red width:25 mark:(line,white) align:left fontsize:7

  from:1945  till:1946 shift:($dx,-2)    color:SPÖ    text:Renner
  from:1946  till:1949 shift:($dx,$dy)    color:ÖVP    text:Figl I
  from:1949  till:1952 shift:($dx,$dy)    color:ÖVP    text:Figl II
  from:1952  till:1953 shift:($dx,$dy)    color:ÖVP    text:Figl III
  from:1953  till:1956 shift:($dx,$dy)    color:ÖVP    text:Raab I
  from:1956  till:1959 shift:($dx,$dy)    color:ÖVP    text:Raab II
  from:1959  till:1960 shift:($dx,$dy)    color:ÖVP    text:Raab III
  from:1960  till:1961 shift:($dx,-2)    color:ÖVP    text:Raab IV
  from:1961  till:1963 shift:($dx,$dy)    color:ÖVP    text:Gorbach I
  from:1963  till:1964 shift:($dx,$dy)    color:ÖVP    text:Gorbach II
  from:1964  till:1966 shift:($dx,$dy)    color:ÖVP    text:Klaus I
  from:1966  till:1970 shift:($dx,$dy)    color:ÖVP    text:Klaus II
  from:1970  till:1971 shift:($dx,$dy)    color:SPÖ    text:Kreisky I
  from:1971  till:1975 shift:($dx,$dy)    color:SPÖ    text:Kreisky II
  from:1975  till:1979 shift:($dx,$dy)    color:SPÖ    text:Kreisky III
  from:1979  till:1983 shift:($dx,$dy)    color:SPÖ    text:Kreisky IV
  from:1983  till:1986 shift:($dx,$dy)    color:SPÖ    text:Sinowatz
  from:1986  till:1987 shift:($dx,$dy)    color:SPÖ    text:Vranitzky I
  from:1987  till:1990 shift:($dx,$dy)    color:SPÖ    text:Vranitzky II
  from:1990  till:1994 shift:($dx,$dy)    color:SPÖ    text:Vranitzky III
  from:1994  till:1996 shift:($dx,$dy)    color:SPÖ    text:Vranitzky IV
  from:1996  till:1997 shift:($dx,$dy)    color:SPÖ    text:Vranitzky V
  from:1997  till:2000 shift:($dx,$dy)    color:SPÖ    text:Klima
  from:2000  till:2003 shift:($dx,$dy)    color:ÖVP    text:Schüssel I
  from:2003  till:end shift:($dx,$dy)    color:ÖVP    text:Schüssel II

  bar:Bundeskanzler

  from:1945 till:1946 shift:($dx,-2) color:SPÖ text:"[[Karl Renner]]" shift:(25,0)
  from:1946 till:1953 shift:($dx,$dy) color:ÖVP text:[[Leopold Figl]]
  from:1953 till:1961 shift:($dx,$dy) color:ÖVP text:[[Julius Raab]]
  from:1961 till:1964 shift:($dx,$dy) color:ÖVP text:[[Alfons Gorbach]]
  from:1964 till:1970 shift:($dx,$dy) color:ÖVP text:[[Josef Klaus]]
  from:1970 till:1983 shift:($dx,$dy) color:SPÖ text:[[Bruno Kreisky]]
  from:1983 till:1986 shift:($dx,$dy) color:SPÖ text:[[Fred Sinowatz]]
  from:1986 till:1997 shift:($dx,$dy) color:SPÖ text:[[Franz Vranitzky]]
  from:1997 till:2000 shift:($dx,$dy) color:SPÖ text:[[Viktor Klima]]
  from:2000 till:end  shift:($dx,$dy) color:ÖVP text:[[Wolfgang Schüssel|Wolfgang Schüssel]]


  bar:Vizekanzler color:red width:25 mark:(line,white) align:left fontsize:S

  from:1945  till:1957 shift:($dx,1)    color:SPÖ    text:[[Adolf Schärf|Adolf Schärf]]
  from:1957  till:1966 shift:($dx,1)    color:SPÖ    text:[[Bruno Pittermann]]
  from:1966  till:1968 shift:($dx,1)    color:ÖVP    text:[[Fritz Bock]]
  from:1968  till:1970 shift:($dx,1)    color:ÖVP    text:[[Hermann Withalm]]
  from:1970  till:1976 shift:($dx,1)    color:SPÖ    text:[[Rudolf Häuser|Rudolf Häuser]]
  from:1976  till:1981 shift:($dx,1)    color:SPÖ    text:[[Hannes Androsch]]
  from:1981  till:1983 shift:($dx,1)    color:SPÖ    text:[[Fred Sinowatz]]
  from:1983  till:1987 shift:($dx,1)    color:FPÖ    text:[[Norbert Steger]]
  from:1987  till:1989 shift:($dx,1)    color:ÖVP    text:[[Alois Mock]]
  from:1989  till:1991 shift:($dx,1)    color:ÖVP    text:[[Josef Riegler]]
  from:1991  till:1995 shift:($dx,1)    color:ÖVP    text:[[Erhard Busek]]
  from:1995  till:2000 shift:($dx,1)    color:ÖVP    text:[[Wolfgang Schüssel|Wolfgang Schüssel]]
  from:2000  till:2003 shift:($dx,-6)    color:FPÖ    text:[[Susanne Riess-Passer]]
  from:2003  till:2003 shift:($dx,-7)    color:FPÖ    text:[[Herbert Haupt]]
  from:2003  till:2005 shift:($dx,$dy)    color:FPÖ    text:[[Hubert Gorbach]]
  from:2005  till:end  shift:($dx,-5)    color:BZÖ    text:[[Hubert Gorbach]]
| Template:Zeitleiste Vizekanzler (Österreich) | top next |

First version by Gugganij on Tuesday, July 6, 2004, last update on Tuesday, May 16, 2006
ImageSize  = width:600 height:500
PlotArea   = width:530  height:450 left:50 bottom:40
Legend    = columns:3 left:15 top:25 columnwidth:50

DateFormat = yyyy
Period     = from:1945 till:2006
TimeAxis   = orientation:vertical
ScaleMajor = unit:year increment:4 start:1945

# there is no automatic collision detection,
# so shift texts up or down manually to avoid overlap

Colors=
  id:ÖVP  value:gray(0.25) legend:ÖVP
  id:SPÖ  value:red    legend:SPÖ
  id:FPÖ  value:blue    legend:FPÖ

Define $dx = 25 # shift text to right side of bar
Define $dy = -4 # adjust height

PlotData=


  bar:VK color:red width:25 mark:(line,white) align:left fontsize:S

  from:1945  till:1957 shift:($dx,1)    color:SPÖ    text:[[Adolf Schärf|Adolf Schärf]]
  from:1957  till:1966 shift:($dx,1)    color:SPÖ    text:[[Bruno Pittermann]]
  from:1966  till:1968 shift:($dx,1)    color:ÖVP    text:[[Fritz Bock]]
  from:1968  till:1970 shift:($dx,1)    color:ÖVP    text:[[Hermann Withalm]]
  from:1970  till:1976 shift:($dx,1)    color:SPÖ    text:[[Rudolf Häuser|Rudolf Häuser]]
  from:1976  till:1981 shift:($dx,1)    color:SPÖ    text:[[Hannes Androsch]]
  from:1981  till:1983 shift:($dx,1)    color:SPÖ    text:[[Fred Sinowatz]]
  from:1983  till:1987 shift:($dx,1)    color:FPÖ    text:[[Norbert Steger]]
  from:1987  till:1989 shift:($dx,1)    color:ÖVP    text:[[Alois Mock]]
  from:1989  till:1991 shift:($dx,1)    color:ÖVP    text:[[Josef Riegler]]
  from:1991  till:1995 shift:($dx,1)    color:ÖVP    text:[[Erhard Busek]]
  from:1995  till:2000 shift:($dx,1)    color:ÖVP    text:[[Wolfgang Schüssel|Wolfgang Schüssel]]
  from:2000  till:2003 shift:($dx,$dy)    color:FPÖ    text:[[Susanne Riess-Passer]]
  from:2003  till:2003 shift:($dx,$dy)    color:FPÖ    text:[[Herbert Haupt]]
  from:2003  till:end  shift:($dx,1)    color:FPÖ    text:[[Hubert Gorbach]]

  bar:BReg color:red width:25 mark:(line,white) align:left fontsize:7

  from:1945  till:1946 shift:($dx,-2)    color:SPÖ    text:Renner
  from:1946  till:1949 shift:($dx,$dy)    color:ÖVP    text:Figl I
  from:1949  till:1952 shift:($dx,$dy)    color:ÖVP    text:Figl II
  from:1952  till:1953 shift:($dx,$dy)    color:ÖVP    text:Figl III
  from:1953  till:1956 shift:($dx,$dy)    color:ÖVP    text:Raab I
  from:1956  till:1959 shift:($dx,$dy)    color:ÖVP    text:Raab II
  from:1959  till:1960 shift:($dx,$dy)    color:ÖVP    text:Raab III
  from:1960  till:1961 shift:($dx,-2)    color:ÖVP    text:Raab IV
  from:1961  till:1963 shift:($dx,$dy)    color:ÖVP    text:Gorbach I
  from:1963  till:1964 shift:($dx,$dy)    color:ÖVP    text:Gorbach II
  from:1964  till:1966 shift:($dx,$dy)    color:ÖVP    text:Klaus I
  from:1966  till:1970 shift:($dx,$dy)    color:ÖVP    text:Klaus II
  from:1970  till:1971 shift:($dx,$dy)    color:SPÖ    text:Kreisky I
  from:1971  till:1975 shift:($dx,$dy)    color:SPÖ    text:Kreisky II
  from:1975  till:1979 shift:($dx,$dy)    color:SPÖ    text:Kreisky III
  from:1979  till:1983 shift:($dx,$dy)    color:SPÖ    text:Kreisky IV
  from:1983  till:1986 shift:($dx,$dy)    color:SPÖ    text:Sinowatz
  from:1986  till:1987 shift:($dx,$dy)    color:SPÖ    text:Vranitzky I
  from:1987  till:1990 shift:($dx,$dy)    color:SPÖ    text:Vranitzky II
  from:1990  till:1994 shift:($dx,$dy)    color:SPÖ    text:Vranitzky III
  from:1994  till:1996 shift:($dx,$dy)    color:SPÖ    text:Vranitzky IV
  from:1996  till:1997 shift:($dx,$dy)    color:SPÖ    text:Vranitzky V
  from:1997  till:2000 shift:($dx,$dy)    color:SPÖ    text:Klima
  from:2000  till:2003 shift:($dx,$dy)    color:ÖVP    text:Schüssel I
  from:2003  till:end shift:($dx,$dy)    color:ÖVP    text:Schüssel II
| Template:Zeitleiste Regierende Bürgermeister von Berlin | top next |

First version by Alexander Fischer on Wednesday, July 14, 2004, last update on Sunday, August 28, 2005
ImageSize	= width:230 height:500
PlotArea	= left:50 right:0 bottom:80 top:20
Legend		= columns:3 left:40 top:60 columnwidth:50

DateFormat	= dd/mm/yyyy
Period		= from:07/12/1948 till:26/03/2006
TimeAxis	= orientation:vertical format:yyyy

ScaleMajor	= unit:year increment:4 start:1949

Colors=
 id:CDU	value:black	legend:CDU
 id:SPD value:red	legend:SPD

PlotData=
 bar:Außenminister color:CDU width:20 fontsize:M align:left shift:(20,-5) mark:(line,white)

  from:start till:29/09/1953  color:SPD  text:[[Ernst Reuter]]
  from:22/10/1953  till:11/01/1955   color:CDU  text:[[Walther Schreiber]]
  from:11/01/1955  till:30/08/1957   color:SPD  text:[[Otto Suhr]]
  from:30/10/1957  till:01/12/1966   color:SPD  text:[[Willy Brandt]]
  from:02/12/1966  till:19/10/1967   color:SPD  text:[[Heinrich Albertz]]
  from:19/10/1967  till:02/05/1977   color:SPD  text:[[Klaus Schütz|Klaus Schütz]]
  from:02/05/1977  till:23/01/1981   color:SPD  text:[[Dietrich Stobbe]]
  from:23/01/1981  till:11/06/1981   color:SPD  text:[[Hans-Jochen Vogel]]
  from:11/06/1981  till:09/02/1984   color:CDU  text:[[Richard von Weizsäcker|Richard von Weizsäcker]]
  from:09/02/1984  till:16/03/1989   color:CDU  text:[[Eberhard Diepgen]]
  from:16/03/1989  till:24/01/1991   color:SPD  text:[[Walter Momper]]
  from:24/01/1991  till:16/06/2001   color:CDU  text:[[Eberhard Diepgen]]
  from:16/06/2001  till:end    color:SPD  text:[[Klaus Wowereit]]
| STATT Partei | top next |

First version by Antifaschist 666 on Tuesday, April 26, 2005, last update on Saturday, April 30, 2005
ImageSize  = width:235 height:520
PlotArea   = width:75 height:500 left:40 bottom:10
Colors =
  id:lightyellow value:rgb(1,1,0.8)

DateFormat = yyyy
Period     = from:1993 till:2001
TimeAxis   = orientation:vertical
ScaleMajor = unit:year increment:1 start:1993
BackgroundColors = canvas:white

Define $dx = 20 # shift text to right side of bar

PlotData =
  bar:Chairmen color:orange width:25 mark:(line,blue) align:left fontsize:S

  from:start till:1993 shift:($dx,-5) text:[[Hamburg]] 5,6%
  from:1994 till:1994 shift:($dx,-1) text:[[Niedersachsen]] 1,3%~[[Sachsen-Anhalt]] 0,3%~[[Bayern]] 0,0%~[[Thüringen]] 0,3%~[[Europawahl]] 0,5%~Bundestagswahl 0,1%
  from:1995 till:1995 shift:($dx,0)  text:[[Hessen]] 0,2%~[[Bremen]] 0,3%~[[Nordrhein-Westfalen]] 0,0%
  from:1996 till:1996 shift:($dx,0)  text:[[Rheinland-Pfalz]] 0,1%
  from:1997 till:1997 shift:($dx,0)  text:[[Hamburg]] 3,8%
  from:1998 till:1998 shift:($dx,0)  text:[[Niedersachsen]] 0,7%~[[Bayern]] 0,0%
  from:2000  till:2000 shift:($dx,-5) text:[[Schleswig-Holstein]] 0,6%
  from:2001  till:2001 shift:($dx,0)  text:[[Hamburg]] 0,4%~[[Berlin]] 0,8%
| Landeck (Tirol) | top next |

First version by 83.218.181.75 on Wednesday, December 28, 2005, last update on Friday, April 21, 2006
ImageSize  = width:550 height:200
PlotArea   = width:450 height:150 left:50 bottom:30
AlignBars  = late

DateFormat = yyyy
Period     = from:0 till:8000
TimeAxis   = orientation:vertical
ScaleMajor = unit:year increment:1000 start:0


PlotData=
  color:blue width:15
  bar:1869 from:start till:1398
  bar:1880 from:start till:1537
  bar:1890 from:start till:1944
  bar:1900 from:start till:2227
  bar:1910 from:start till:3569
  bar:1923 from:start till:4106
  bar:1934 from:start till:4113
  bar:1939 from:start till:5542
  bar:1951 from:start till:5615
  bar:1961 from:start till:6514
  bar:1971 from:start till:7476
  bar:1981 from:start till:7317
  bar:1991 from:start till:7411
  bar:2001 from:start till:7336

TextData=
  pos:(03,03) fontsize:M text:"Bevölkerungsentwicklung der Stadt Landeck in Tirol von 1869 bis 2001; Quelle: Tirol Atlas"
| Liste der Päpste (graphisch) | top next |
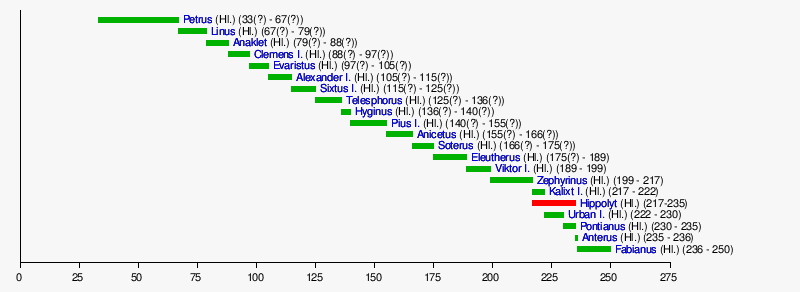
First version by Gunter.krebs ? on Monday, August 9, 2004, last update on Sunday, January 22, 2006
ImageSize = width:800 height:auto barincrement:12
PlotArea  = top:10 bottom:30 right:130 left:20
AlignBars = early

DateFormat = yyyy
Period     = from:0 till:275
TimeAxis   = orientation:horizontal
ScaleMajor = unit:year increment:25 start:0

Colors     =
  id:canvas      value:rgb(0.97,0.97,0.97)
  id:PA   value:green
  id:GP   value:red

Backgroundcolors = canvas:canvas

BarData =
  barset:Päpste

PlotData=
  width:5 align:left fontsize:S shift:(5,-4) anchor:till
  barset:Päpste

  from: 33 till: 67 color:PA text:"[[Simon Petrus|Petrus]] (Hl.) ([[33]](?) - [[67]](?))"
  from: 67 till: 79 color:PA text:"[[Linus (Papst)|Linus]] (Hl.) ([[67]](?) - [[79]](?))"
  from: 79 till: 88 color:PA text:"[[Anaklet (Papst)|Anaklet]] (Hl.) ([[79]](?) - [[88]](?))"
  from: 88 till: 97 color:PA text:"[[Clemens I. (Papst)|Clemens I.]] (Hl.) ([[88]](?) - [[97]](?))"
  from: 97 till:105 color:PA text:"[[Evaristus (Papst)|Evaristus]] (Hl.) ([[97]](?) - [[105]](?))"
  from:105 till:115 color:PA text:"[[Alexander I. (Papst)|Alexander I.]] (Hl.) ([[105]](?) - [[115]](?))"
  from:115 till:125 color:PA text:"[[Sixtus I. (Papst)|Sixtus I.]] (Hl.) ([[115]](?) - [[125]](?))"
  from:125 till:136 color:PA text:"[[Telesphorus (Papst)|Telesphorus]] (Hl.) ([[125]](?) - [[136]](?))"
  from:136 till:140 color:PA text:"[[Hyginus (Papst)|Hyginus]] (Hl.) ([[136]](?) - [[140]](?))"
  from:140 till:155 color:PA text:"[[Pius I.]] (Hl.) ([[140]](?) - [[155]](?))"
  from:155 till:166 color:PA text:"[[Anicetus (Papst)|Anicetus]] (Hl.) ([[155]](?) - [[166]](?))"
  from:166 till:175 color:PA text:"[[Soterus (Papst)|Soterus]] (Hl.) ([[166]](?) - [[175]](?))"
  from:175 till:189 color:PA text:"[[Eleutherus (Papst)|Eleutherus]] (Hl.) ([[175]](?) - [[189]])"
  from:189 till:199 color:PA text:"[[Viktor I. (Papst)|Viktor I.]] (Hl.) ([[189]] - [[199]])"
  from:199 till:217 color:PA text:"[[Zephyrinus (Papst)|Zephyrinus]] (Hl.) ([[199]] - [[217]])"
  from:217 till:222 color:PA text:"[[Kalixt I. (Papst)|Kalixt I.]] (Hl.) ([[217]] - [[222]])"
  from:217 till:235 color:GP text:"[[Hippolyt von Rom|Hippolyt]] (Hl.) ([[217]]-[[235]])"
  from:222 till:230 color:PA text:"[[Urban I. (Papst)|Urban I.]] (Hl.) ([[222]] - [[230]])"
  from:230 till:235 color:PA text:"[[Pontianus (Papst)|Pontianus]] (Hl.) ([[230]] - [[235]])"
  from:235 till:236 color:PA text:"[[Anterus (Papst)|Anterus]] (Hl.) ([[235]] - [[236]])"
  from:236 till:250 color:PA text:"[[Fabianus (Papst)|Fabianus]] (Hl.) ([[236]] - [[250]])"

  barset:skip
| Liste der Päpste (graphisch) | top next |

First version by Gunter.krebs ? on Monday, August 9, 2004, last update on Sunday, January 22, 2006
ImageSize = width:800 height:auto barincrement:12
PlotArea  = top:10 bottom:30 right:130 left:20
AlignBars = early

DateFormat = yyyy
Period     = from:250 till:525
TimeAxis   = orientation:horizontal
ScaleMajor = unit:year increment:25 start:250

Colors     =
  id:canvas      value:rgb(0.97,0.97,0.97)
  id:PA   value:green
  id:GP   value:red

Backgroundcolors = canvas:canvas

BarData =
  barset:Päpste

PlotData=
  width:5 align:left fontsize:S shift:(5,-4) anchor:till
  barset:Päpste
  from:251 till:258 color:GP text:"[[Novatian (Gegenpapst)|Novatian]] ([[251]]-ca. [[258]])"
  from:251 till:253 color:PA text:"[[Cornelius (Papst)|Cornelius]] (Hl.) ([[251]] - [[253]])"
  from:253 till:254 color:PA text:"[[Lucius I. (Papst)|Lucius I.]] (Hl.) ([[253]] - [[254]])"
  from:254 till:257 color:PA text:"[[Stephan I. (Papst)|Stephan I.]] (Hl.) ([[254]] - [[257]])"
  from:257 till:258 color:PA text:"[[Sixtus II. (Papst)|Sixtus II.]] (Hl.) ([[257]] - [[258]])"
  from:259 till:268 color:PA text:"[[Dionysius (Papst)|Dionysius]] (Hl.) ([[259]] - [[268]])"
  from:269 till:274 color:PA text:"[[Felix I. (Papst)|Felix I.]] (Hl.) ([[269]] - [[274]])"
  from:275 till:283 color:PA text:"[[Eutychianus (Papst)|Eutychianus]] (Hl.) ([[275]] - [[283]])"
  from:283 till:296 color:PA text:"[[Cajus (Papst)|Cajus]] (Hl.) ([[283]] - [[296]])"
  from:296 till:304 color:PA text:"[[Marcellinus (Papst)|Marcellinus]] (Hl.) ([[296]] - [[304]])"
  from:308 till:309 color:PA text:"[[Marcellus I. (Papst)|Marcellus I.]] (Hl.) ([[308]] - [[309]])"
  from:309 till:310 color:PA text:"[[Eusebius (Papst)|Eusebius]] (Hl.) ([[309]] - [[310]])"
  from:311 till:314 color:PA text:"[[Miltiades (Papst)|Miltiades]] (Hl.) ([[311]] - [[314]])"
  from:314 till:335 color:PA text:"[[Silvester I. (Papst)|Silvester I.]] (Hl.) ([[314]] - [[335]])"
  from:336 till:336 color:PA text:"[[Marcus (Papst)|Marcus]] (Hl.) ([[336]])"
  from:337 till:352 color:PA text:"[[Julius I. (Papst)|Julius I.]] (Hl.) ([[337]] - [[352]])"
  from:352 till:366 color:PA text:"[[Liberius (Papst)|Liberius]] ([[352]] - [[366]])"
  from:355 till:365 color:GP text:"[[Felix II. (Gegenpapst)|Felix II.]] ([[355]] - [[365]])"
  from:366 till:384 color:PA text:"[[Damasus I. (Papst)|Damasus I.]] (Hl.) ([[366]] - [[384]])"
  from:366 till:367 color:GP text:"[[Ursinus (Gegenpapst)|Ursinus]] ([[366]] - [[367]])"
  from:384 till:399 color:PA text:"[[Siricius (Papst)|Siricius]] (Hl.) ([[384]] - [[399]])"
  from:399 till:401 color:PA text:"[[Anastasius I. (Papst)|Anastasius I.]] (Hl.) ([[399]] - [[401]])"
  from:401 till:417 color:PA text:"[[Innozenz I. (Papst)|Innozenz I.]] (Hl.) ([[401]] - [[417]])"
  from:417 till:418 color:PA text:"[[Zosimus (Papst)|Zosimus]] (Hl.) ([[417]] - [[418]])"
  from:418 till:422 color:PA text:"[[Bonifatius I. (Papst)|Bonifatius I.]] (Hl.) ([[418]] - [[422]])"
  from:418 till:419 color:GP text:"[[Eulalius (Gegenpapst)|Eulalius]] ([[418]] - [[419]])"
  from:422 till:432 color:PA text:"[[Coelestin I. (Papst)|Coelestin I.]] (Hl.) ([[422]] - [[432]])"
  from:432 till:440 color:PA text:"[[Sixtus III. (Papst)|Sixtus III.]] (Hl.) ([[432]] - [[440]])"
  from:440 till:461 color:PA text:"[[Leo I. (Papst)|Leo I.]] (Hl.) ([[440]] - [[461]])"
  from:461 till:468 color:PA text:"[[Hilarius (Papst)|Hilarius]] (Hl.) ([[461]] - [[468]])"
  from:468 till:483 color:PA text:"[[Simplicius (Papst)|Simplicius]] (Hl.) ([[468]] - [[483]])"
  from:483 till:492 color:PA text:"[[Felix II. (Papst)|Felix II.]] (Hl.) ([[483]] - [[492]])"
  from:492 till:496 color:PA text:"[[Gelasius I. (Papst)|Gelasius I.]] (Hl.) ([[492]] - [[496]])"
  from:496 till:498 color:PA text:"[[Anastasius II. (Papst)|Anastasius II.]] ([[496]] - [[498]])"
  from:498 till:514 color:PA text:"[[Symmachus (Papst)|Symmachus]] (Hl.) ([[498]] - [[514]])"
  from:498 till:506 color:GP text:"[[Laurentius (Gegenpapst)|Laurentius]] ([[498]] - [[506]])"
  barset:skip
| Liste der Päpste (graphisch) | top next |

First version by Gunter.krebs ? on Monday, August 9, 2004, last update on Sunday, January 22, 2006
ImageSize = width:800 height:auto barincrement:12
PlotArea  = top:10 bottom:30 right:130 left:20
AlignBars = early

DateFormat = yyyy
Period     = from:500 till:775
TimeAxis   = orientation:horizontal
ScaleMajor = unit:year increment:25 start:500

Colors     =
  id:canvas      value:rgb(0.97,0.97,0.97)
  id:PA   value:green
  id:GP   value:red

Backgroundcolors = canvas:canvas

BarData =
  barset:Päpste

PlotData=
  width:5 align:left fontsize:S shift:(5,-4) anchor:till
  barset:Päpste

  from:514 till:523 color:PA text:"[[Hormisdas (Papst)|Hormisdas]] (Hl.) ([[514]] - [[523]])"
  from:523 till:526 color:PA text:"[[Johannes I. (Papst)|Johannes I.]] (Hl.) ([[523]] - [[526]])"
  from:526 till:530 color:PA text:"[[Felix III. (Papst)|Felix III.]] (Hl.) ([[526]] - [[530]])"
  from:530 till:530 color:GP text:"[[Dioskur (Gegenpapst)|Dioskur]] ([[530]])"
  from:530 till:532 color:PA text:"[[Bonifatius II. (Papst)|Bonifatius II.]] ([[530]] - [[532]])"
  from:533 till:535 color:PA text:"[[Johannes II. (Papst)|Johannes II.]] ([[533]] - [[535]])"
  from:535 till:536 color:PA text:"[[Agapitus I. (Papst)|Agapitus I.]] (Hl.) ([[535]] - [[536]])"
  from:536 till:537 color:PA text:"[[Silverius (Papst)|Silverius]] (Hl.) ([[536]] - [[537]])"
  from:537 till:555 color:PA text:"[[Vigilius (Papst)|Vigilius]] ([[537]] - [[555]])"
  from:556 till:561 color:PA text:"[[Pelagius I. (Papst)|Pelagius I.]] ([[556]] - [[561]])"
  from:561 till:574 color:PA text:"[[Johannes III. (Papst)|Johannes III.]] ([[561]] - [[574]])"
  from:575 till:579 color:PA text:"[[Benedikt I. (Papst)|Benedikt I.]] ([[575]] - [[579]])"
  from:579 till:590 color:PA text:"[[Pelagius II. (Papst)|Pelagius II.]] ([[579]] - [[590]])"
  from:590 till:604 color:PA text:"[[Gregor I. (Papst)|Gregor I.]] (Hl.) ([[590]] - [[604]])"
  from:604 till:606 color:PA text:"[[Sabinianus (Papst)|Sabinianus]] ([[604]] - [[606]])"
  from:607 till:607 color:PA text:"[[Bonifatius III. (Papst)|Bonifatius III.]] ([[607]])"
  from:608 till:615 color:PA text:"[[Bonifatius IV. (Papst)|Bonifatius IV.]] (Hl.) ([[608]] - [[615]])"
  from:615 till:618 color:PA text:"[[Adeodatus I. (Papst)|Adeodatus I.]] (Hl.) ([[615]] - [[618]])"
  from:619 till:625 color:PA text:"[[Bonifatius V. (Papst)|Bonifatius V.]] ([[619]] - [[625]])"
  from:625 till:638 color:PA text:"[[Honorius I. (Papst)|Honorius I.]] ([[625]] - [[638]])"
  from:640 till:640 color:PA text:"[[Severinus (Papst)|Severinus]] ([[640]])"
  from:640 till:642 color:PA text:"[[Johannes IV. (Papst)|Johannes IV.]] ([[640]] - [[642]])"
  from:642 till:649 color:PA text:"[[Theodor I. (Papst)|Theodor I.]] ([[642]] - [[649]])"
  from:649 till:653 color:PA text:"[[Martin I. (Papst)|Martin I.]] (Hl.) ([[649]] - [[653]])"
  from:654 till:657 color:PA text:"[[Eugen I. (Papst)|Eugen I.]] (Hl.) ([[654]] - [[657]])"
  from:657 till:672 color:PA text:"[[Vitalian (Papst)|Vitalian]] (Hl.) ([[657]] - [[672]])"
  from:672 till:676 color:PA text:"[[Adeodatus II. (Papst)|Adeodatus II.]] ([[672]] - [[676]])"
  from:676 till:678 color:PA text:"[[Donus (Papst)|Donus]] ([[676]] - [[678]])"
  from:678 till:681 color:PA text:"[[Agatho (Papst)|Agatho]] (Hl.) ([[678]] - [[681]])"
  from:682 till:683 color:PA text:"[[Leo II. (Papst)|Leo II.]] (Hl.) ([[682]] - [[683]])"
  from:684 till:685 color:PA text:"[[Benedikt II.]] (Hl.) ([[684]] - [[685]])"
  from:685 till:686 color:PA text:"[[Johannes V. (Papst)|Johannes V.]] ([[685]] - [[686]])"
  from:686 till:687 color:PA text:"[[Konon]] ([[686]] - [[687]])"
  from:687 till:701 color:PA text:"[[Sergius I.]] (Hl.) ([[687]] - [[701]])"
  from:687 till:687 color:GP text:"[[Theodor (Gegenpapst)|Theodor]] ([[687]])"
  from:687 till:692 color:GP text:"[[Paschalis I. (Gegenpapst)|Paschalis I.]] ([[687]] - [[692]])"
  from:701 till:705 color:PA text:"[[Johannes VI.]] ([[701]] - [[705]])"
  from:705 till:707 color:PA text:"[[Johannes VII.]] ([[705]] - [[707]])"
  from:708 till:708 color:PA text:"[[Sisinnius]] ([[708]])"
  from:708 till:715 color:PA text:"[[Constantinus I.]] ([[708]] - [[715]])"
  from:715 till:731 color:PA text:"[[Gregor II.]] (Hl.) ([[715]] - [[731]])"
  from:731 till:741 color:PA text:"[[Gregor III.]] (Hl.) ([[731]] - [[741]])"
  from:741 till:752 color:PA text:"[[Zacharias (Papst)|Zacharias]] (Hl.) ([[741]] - [[752]])"

  barset:skip
| Liste der Päpste (graphisch) | top next |

First version by Gunter.krebs ? on Monday, August 9, 2004, last update on Sunday, January 22, 2006
ImageSize = width:800 height:auto barincrement:12
PlotArea  = top:10 bottom:30 right:130 left:20
AlignBars = early

DateFormat = yyyy
Period     = from:750 till:1025
TimeAxis   = orientation:horizontal
ScaleMajor = unit:year increment:25 start:750

Colors     =
  id:canvas      value:rgb(0.97,0.97,0.97)
  id:PA   value:green
  id:GP   value:red

Backgroundcolors = canvas:canvas

BarData =
  barset:Päpste

PlotData=
  width:5 align:left fontsize:S shift:(5,-4) anchor:till
  barset:Päpste

  from:752 till:752 color:PA text:"[[Stephan (II.) (Papst)|Stephan (II.)]] ([[752]])"
  from:752 till:757 color:PA text:"[[Stephan II. (Papst)|Stephan II.]] ([[752]] - [[757]])"
  from:757 till:767 color:PA text:"[[Paul I. (Papst)|Paul I.]] (Hl.) ([[757]] - [[767]])"
  from:767 till:768 color:GP text:"[[Konstantin II. (Gegenpapst)|Konstantin II.]] ([[767]] - [[768]])"
  from:768 till:768 color:GP text:"[[Philipp (Gegenpapst)|Philipp]] ([[768]])"
  from:768 till:772 color:PA text:"[[Stephan III. (Papst)|Stephan III.]] ([[768]] - [[772]])"
  from:772 till:795 color:PA text:"[[Hadrian I.]] ([[772]] - [[795]])"
  from:795 till:816 color:PA text:"[[Leo III. (Papst)|Leo III.]] ([[795]] - [[816]])"
  from:816 till:817 color:PA text:"[[Stephan IV. (Papst)|Stephan IV.]] ([[816]] - [[817]])"
  from:817 till:824 color:PA text:"[[Paschalis I.]] (Hl.) ([[817]] - [[824]])"
  from:824 till:827 color:PA text:"[[Eugen II.]] ([[824]] - [[827]])"
  from:827 till:827 color:PA text:"[[Valentin (Papst)|Valentin]] ([[827]])"
  from:827 till:844 color:PA text:"[[Gregor IV.]] ([[827]] - [[844]])"
  from:844 till:847 color:PA text:"[[Sergius II.]] ([[844]] - [[847]])"
  from:844 till:844 color:GP text:"[[Johannes VIII. (Gegenpapst)|Johannes VIII.]] ([[844]])"
  from:847 till:855 color:PA text:"[[Leo IV. (Papst)|Leo IV.]] (Hl.) ([[847]] - [[855]])"
  from:855 till:855 color:GP text:"[[Anastasius III. (Gegenpapst)|Anastasius III.]] ([[855]])"
  from:855 till:858 color:PA text:"[[Benedikt III.]] ([[855]] - [[858]])"
  from:867 till:872 color:PA text:"[[Hadrian II. (Papst)|Hadrian II.]] ([[867]] - [[872]])"
  from:872 till:882 color:PA text:"[[Johannes VIII. (Papst)|Johannes VIII.]] ([[872]] - [[882]])"
  from:882 till:884 color:PA text:"[[Marinus I. (Papst)|Marinus I.]] ([[882]] - [[884]])"
  from:884 till:885 color:PA text:"[[Hadrian III.]] (Hl.) ([[884]] - [[885]])"
  from:885 till:891 color:PA text:"[[Stephan V.]] ([[885]] - [[891]])"
  from:891 till:896 color:PA text:"[[Formosus]] ([[891]] - [[896]])"
  from:896 till:896 color:PA text:"[[Bonifatius VI.]] ([[896]])"
  from:896 till:897 color:PA text:"[[Stephan VI.]] ([[896]] - [[897]])"
  from:897 till:897 color:PA text:"[[Romanus (Papst)|Romanus]] ([[897]])"
  from:897 till:897 color:PA text:"[[Theodor II.]] ([[897]])"
  from:898 till:900 color:PA text:"[[Johannes IX.]] ([[898]] - [[900]])"
  from:900 till:903 color:PA text:"[[Benedikt IV.]] ([[900]] - [[903]])"
  from:903 till:904 color:PA text:"[[Leo V. (Papst)|Leo V.]] ([[903]] - [[904]])"
  from:903 till:904 color:PA text:"[[Christophorus (Papst)|Christophorus]] ([[903]] - [[904]])"
  from:904 till:911 color:PA text:"[[Sergius III.]] ([[904]] - [[911]])"
  from:911 till:913 color:PA text:"[[Anastasius III.]] ([[911]] - [[913]])"
  from:913 till:914 color:PA text:"[[Lando]] ([[913]] - [[914]])"
  from:914 till:928 color:PA text:"[[Johannes X.]] ([[914]] - [[928]])"
  from:928 till:928 color:PA text:"[[Leo VI. (Papst)|Leo VI.]] ([[928]])"
  from:928 till:931 color:PA text:"[[Stephan VII.]] ([[928]] - [[931]])"
  from:931 till:935 color:PA text:"[[Johannes XI.]] ([[931]] - [[935]])"
  from:936 till:939 color:PA text:"[[Leo VII.]] ([[936]] - [[939]])"
  from:939 till:942 color:PA text:"[[Stephan VIII.]] ([[939]] - [[942]])"
  from:942 till:946 color:PA text:"[[Marinus II.]] ([[942]] - [[946]])"
  from:946 till:955 color:PA text:"[[Agapitus II.]] ([[946]] - [[955]])"
  from:955 till:964 color:PA text:"[[Johannes XII.]] ([[955]] - [[964]])"
  from:963 till:965 color:PA text:"[[Leo VIII.]] ([[963]] - [[965]])"
  from:964 till:964 color:PA text:"[[Benedikt V.]] ([[964]])"
  from:965 till:972 color:PA text:"[[Johannes XIII.]] ([[965]] - [[972]])"
  from:973 till:974 color:PA text:"[[Benedikt VI.]] ([[973]] - [[974]])"
  from:974 till:974 color:GP text:"[[Bonifatius VII.]] ([[974]])"
  from:974 till:983 color:PA text:"[[Benedikt VII.]] ([[974]] - [[983]])"
  from:983 till:984 color:PA text:"[[Johannes XIV.]] ([[983]] - [[984]])"
  from:984 till:985 color:PA text:"[[Bonifatius VII.]] ([[984]] - [[985]])"
  from:985 till:996 color:PA text:"[[Johannes XV.]] ([[985]] - [[996]])"
  from:996 till:999 color:PA text:"[[Gregor V.]] ([[996]] - [[999]])"
  from:997 till:998 color:GP text:"[[Johannes XVI.]] ([[997]] - [[998]])"
  from:999 till:1003 color:PA text:"[[Silvester II.]] ([[999]] - [[1003]])"
  barset:skip
| Liste der Päpste (graphisch) | top next |

First version by Gunter.krebs ? on Monday, August 9, 2004, last update on Sunday, January 22, 2006
ImageSize = width:800 height:auto barincrement:12
PlotArea  = top:10 bottom:30 right:130 left:20
AlignBars = early

DateFormat = yyyy
Period     = from:1000 till:1275
TimeAxis   = orientation:horizontal
ScaleMajor = unit:year increment:25 start:1000

Colors     =
  id:canvas      value:rgb(0.97,0.97,0.97)
  id:PA   value:green
  id:GP   value:red

Backgroundcolors = canvas:canvas

BarData =
  barset:Päpste

PlotData=
  width:5 align:left fontsize:S shift:(5,-4) anchor:till
  barset:Päpste

  from:1003 till:1003 color:PA text:"[[Johannes XVII.]] ([[1003]])"
  from:1004 till:1009 color:PA text:"[[Johannes XVIII.]] ([[1004]] - [[1009]])"
  from:1009 till:1012 color:PA text:"[[Sergius IV.]] ([[1009]] - [[1012]])"
  from:1012 till:1024 color:PA text:"[[Benedikt VIII.]] ([[1012]] - [[1024]])"
  from:1012 till:1012 color:GP text:"[[Gregor VI. (Gegenpapst)|Gregor VI.]] ([[1012]])"
  from:1024 till:1032 color:PA text:"[[Johannes XIX.]] ([[1024]] - [[1032]])"
  from:1032 till:1044 color:PA text:"   [[Benedikt IX.]] ([[1032]] - [[1044]], [[1045]] und [[1047]] - [[1048]])"
  barset:skip
  from:1045 till:1045 color:GP text:"[[Silvester III.]] ([[1045]])"
  from:1045 till:1046 color:PA text:"[[Gregor VI.]] ([[1045]] - [[1046]])"
  from:1046 till:1047 color:PA text:"[[Clemens II.]] ([[1046]] - [[1047]])"
  from:1048 till:1048 color:PA text:"[[Damasus II.]] ([[1048]])"
  from:1049 till:1054 color:PA text:"[[Leo IX.]] (Hl.) ([[1049]] - [[1054]])"
  from:1055 till:1057 color:PA text:"[[Viktor II.]] ([[1055]] - [[1057]])"
  from:1057 till:1058 color:PA text:"[[Stephan IX.]] ([[1057]] - [[1058]])"
  from:1058 till:1061 color:PA text:"[[Nikolaus II. (Papst)|Nikolaus II.]] ([[1058]] - [[1061]])"
  from:1058 till:1059 color:GP text:"[[Benedikt X. (Gegenpapst)|Benedikt X.]] ([[1058]] - [[1059]])"
  from:1061 till:1073 color:PA text:"[[Alexander II. (Papst)|Alexander II.]] ([[1061]] - [[1073]])"
  from:1061 till:1064 color:GP text:"[[Honorius II. (Gegenpapst)|Honorius II.]] ([[1061]] - [[1064]])"
  from:1073 till:1085 color:PA text:"[[Gregor VII.]] (Hl.) ([[1073]] - [[1085]])"
  from:1084 till:1100 color:GP text:"[[Clemens III. (Gegenpapst)|Klemens III.]] ([[1084]] - [[1100]])"
  from:1085 till:1087 color:PA text:"[[Viktor III.]] ([[1085]] - [[1087]])"
  from:1088 till:1099 color:PA text:"[[Urban II.]] ([[1088]] - [[1099]])"
  from:1099 till:1118 color:PA text:"[[Paschalis II.]] ([[1099]] - [[1118]])"
  from:1100 till:1100 color:GP text:"[[Theodoricus (Gegenpapst)|Theodoricus]] ([[1100]])"
  from:1102 till:1102 color:GP text:"[[Albertus (Gegenpapst)|Albertus]] ([[1102]])"
  from:1105 till:1111 color:GP text:"[[Silvester IV. (Gegenpapst)|Silvester IV.]] ([[1105]] - [[1111]])"
  from:1118 till:1119 color:PA text:"[[Gelasius II.]] ([[1118]] - [[1119]])"
  from:1118 till:1121 color:GP text:"[[Gregor VIII. (Gegenpapst)|Gregor VIII.]] ([[1118]] - [[1121]])"
  from:1119 till:1124 color:PA text:"[[Kalixt II.]] ([[1119]] - [[1124]])"
  from:1124 till:1130 color:PA text:"[[Honorius II.]] ([[1124]] - [[1130]])"
  from:1124 till:1124 color:GP text:"[[Coelestin II. (Gegenpapst)|Coelestin II.]] ([[1124]])"
  from:1130 till:1143 color:PA text:"[[Innozenz II.]] ([[1130]] - [[1143]])"
  from:1130 till:1138 color:GP text:"[[Anaklet II. (Gegenpapst)|Anaklet II.]] ([[1130]] - [[1138]])"
  from:1138 till:1138 color:GP text:"[[Viktor IV. (Gregor)|Viktor IV.]] ([[1138]])"
  from:1143 till:1144 color:PA text:"[[Coelestin II.]] ([[1143]] - [[1144]])"
  from:1144 till:1145 color:PA text:"[[Lucius II.]] ([[1144]] - [[1145]])"
  from:1145 till:1153 color:PA text:"[[Eugen III.]] ([[1145]] - [[1153]])"
  from:1153 till:1154 color:PA text:"[[Anastasius IV.]] ([[1153]] - [[1154]])"
  from:1154 till:1159 color:PA text:"[[Hadrian IV.]] ([[1154]] - [[1159]])"
  from:1159 till:1181 color:PA text:"[[Alexander III. (Papst)|Alexander III.]] ([[1159]] - [[1181]])"
  from:1159 till:1164 color:GP text:"[[Viktor IV. (Oktavian)|Viktor IV.]] ([[1159]] - [[1164]])"
  from:1164 till:1168 color:GP text:"[[Paschalis III. (Gegenpapst)|Paschalis III.]] ([[1164]] - [[1168]])"
  from:1168 till:1178 color:GP text:"[[Kalixt III. (Gegenpapst)|Kalixt III.]] ([[1168]] - [[1178]])"
  from:1179 till:1180 color:GP text:"[[Innozenz III. (Gegenpapst)|Innozenz III.]] ([[1179]] - [[1180]])"
  from:1181 till:1185 color:PA text:"[[Lucius III.]] ([[1181]] - [[1185]])"
  from:1185 till:1187 color:PA text:"[[Urban III.]] ([[1185]] - [[1187]])"
  from:1187 till:1187 color:PA text:"[[Gregor VIII.]] ([[1187]])"
  from:1187 till:1191 color:PA text:"[[Clemens III. (Papst)|Clemens III.]] ([[1187]] - [[1191]])"
  from:1191 till:1198 color:PA text:"[[Coelestin III.]] ([[1191]] - [[1198]])"
  from:1198 till:1216 color:PA text:"[[Innozenz III.]] ([[1198]] - [[1216]])"
  from:1216 till:1227 color:PA text:"[[Honorius III.]] ([[1216]] - [[1227]])"
  from:1227 till:1241 color:PA text:"[[Gregor IX.]] ([[1227]] - [[1241]])"
  from:1241 till:1241 color:PA text:"[[Coelestin IV.]] ([[1241]])"
  from:1243 till:1254 color:PA text:"[[Innozenz IV.]] ([[1243]] - [[1254]])"
  barset:skip
| Liste der Päpste (graphisch) | top next |

First version by Gunter.krebs ? on Monday, August 9, 2004, last update on Sunday, January 22, 2006
ImageSize = width:800 height:auto barincrement:12
PlotArea  = top:10 bottom:30 right:130 left:20
AlignBars = early

DateFormat = yyyy
Period     = from:1250 till:1525
TimeAxis   = orientation:horizontal
ScaleMajor = unit:year increment:25 start:1250

Colors     =
  id:canvas      value:rgb(0.97,0.97,0.97)
  id:PA   value:green
  id:GP   value:red

Backgroundcolors = canvas:canvas

BarData =
  barset:Päpste

PlotData=
  width:5 align:left fontsize:S shift:(5,-4) anchor:till
  barset:Päpste

  from:1254 till:1261 color:PA text:"[[Alexander IV.]] ([[1254]] - [[1261]])"
  from:1261 till:1264 color:PA text:"[[Urban IV.]] ([[1261]] - [[1264]])"
  from:1265 till:1268 color:PA text:"[[Clemens IV.]] ([[1265]] - [[1268]])"
  from:1271 till:1276 color:PA text:"[[Gregor X.]] ([[1271]] - [[1276]])"
  from:1276 till:1276 color:PA text:"[[Innozenz V.]] ([[1276]])"
  from:1276 till:1276 color:PA text:"[[Hadrian V.]] ([[1276]])"
  from:1276 till:1277 color:PA text:"[[Johannes XXI.]] ([[1276]] - [[1277]])"
  from:1277 till:1280 color:PA text:"[[Nikolaus III.]] ([[1277]] - [[1280]])"
  from:1281 till:1285 color:PA text:"[[Martin IV. (Papst)|Martin IV.]] ([[1281]] - [[1285]])"
  from:1285 till:1287 color:PA text:"[[Honorius IV. (Papst)|Honorius IV.]] ([[1285]] - [[1287]])"
  from:1288 till:1292 color:PA text:"[[Nikolaus IV. (Papst)|Nikolaus IV.]] ([[1288]] - [[1292]])"
  from:1294 till:1294 color:PA text:"[[Coelestin V.]] (Hl.) ([[1294]])"
  from:1294 till:1303 color:PA text:"[[Bonifatius VIII.]] ([[1294]] - [[1303]])"
  from:1303 till:1304 color:PA text:"[[Benedikt XI.]] ([[1303]] - [[1304]])"
  from:1305 till:1314 color:PA text:"[[Clemens V.]] ([[1305]] - [[1314]])"
  from:1316 till:1334 color:PA text:"[[Johannes XXII.]] ([[1316]] - [[1334]])"
  from:1328 till:1330 color:PA text:"[[Nikolaus V. (Gegenpapst)|Nikolaus V.]] ([[1328]] - [[1330]])"
  from:1334 till:1342 color:PA text:"[[Benedikt XII.]] ([[1334]] - [[1342]])"
  from:1342 till:1352 color:PA text:"[[Clemens VI. (Papst)|Clemens VI.]] ([[1342]] - [[1352]])"
  from:1352 till:1362 color:PA text:"[[Innozenz VI.]] ([[1352]] - [[1362]])"
  from:1362 till:1370 color:PA text:"[[Urban V.]] ([[1362]] - [[1370]])"
  from:1370 till:1378 color:PA text:"[[Gregor XI.]] ([[1370]] - [[1378]])"
  from:1378 till:1389 color:PA text:"[[Urban VI.]] ([[1378]] - [[1389]])"
  from:1378 till:1394 color:GP text:"[[Clemens VII. (Gegenpapst)|Clemens VII.]] ([[1378]] - [[1394]])"
  from:1389 till:1404 color:PA text:"[[Bonifatius IX.]] ([[1389]] - [[1404]])"
  from:1394 till:1423 color:GP text:"[[Benedikt XIII. (Gegenpapst)|Benedikt XIII.]] ([[1394]] - [[1423]])"
  from:1404 till:1406 color:PA text:"[[Innozenz VII.]] ([[1404]] - [[1406]])"
  from:1406 till:1415 color:PA text:"[[Gregor XII.]] ([[1406]] - [[1415]])"
  from:1409 till:1410 color:GP text:"[[Alexander V.]] ([[1409]] - [[1410]])"
  from:1410 till:1415 color:GP text:"[[Johannes XXIII. (Gegenpapst)|Johannes XXIII.]] ([[1410]] - [[1415]])"
  from:1417 till:1431 color:PA text:"[[Martin V.]] ([[1417]] - [[1431]])"
  from:1423 till:1429 color:GP text:"[[Clemens VIII. (Gegenpapst)|Klemens VIII.]] ([[1423]] - [[1429]])"
  from:1425 till:1430 color:GP text:"[[Benedikt XIV. (Gegenpapst)|Benedikt XIV.]] ([[1425]] - [[1430]])"
  from:1431 till:1447 color:PA text:"[[Eugen IV.]] ([[1431]] - [[1447]])"
  from:1439 till:1449 color:GP text:"[[Felix V. (Gegenpapst)|Felix V.]] ([[1439]] - [[1449]])"
  from:1447 till:1455 color:PA text:"[[Nikolaus V. (Papst)|Nikolaus V.]] ([[1447]] - [[1455]])"
  from:1455 till:1458 color:PA text:"[[Kalixt III. (Papst)|Kalixt III.]] ([[1455]] - [[1458]])"
  from:1458 till:1464 color:PA text:"[[Pius II.]] ([[1458]] - [[1464]])"
  from:1464 till:1471 color:PA text:"[[Paul II. (Papst)|Paul II.]] ([[1464]] - [[1471]])"
  from:1471 till:1484 color:PA text:"[[Sixtus IV. (Papst)|Sixtus IV.]] ([[1471]] - [[1484]])"
  from:1484 till:1492 color:PA text:"[[Innozenz VIII. (Papst)|Innozenz VIII.]] ([[1484]] - [[1492]])"
  from:1492 till:1503 color:PA text:"[[Alexander VI. (Papst)|Alexander VI.]] ([[1492]] - [[1503]])"
  from:1503 till:1503 color:PA text:"[[Pius III.]] ([[1503]])"
  barset:skip
| Liste der Päpste (graphisch) | top next |

First version by Gunter.krebs ? on Monday, August 9, 2004, last update on Sunday, January 22, 2006
ImageSize = width:800 height:auto barincrement:12
PlotArea  = top:10 bottom:30 right:130 left:20
AlignBars = early

DateFormat = yyyy
Period     = from:1500 till:1775
TimeAxis   = orientation:horizontal
ScaleMajor = unit:year increment:25 start:1500

Colors     =
  id:canvas      value:rgb(0.97,0.97,0.97)
  id:PA   value:green
  id:GP   value:red

Backgroundcolors = canvas:canvas

BarData =
  barset:Päpste

PlotData=
  width:5 align:left fontsize:S shift:(5,-4) anchor:till
  barset:Päpste

  from:1503 till:1513 color:PA text:"[[Julius II.|Julius II.]] ([[1503]] - [[1513]])"
  from:1513 till:1521 color:PA text:"[[Leo X.|Leo X.]] ([[1513]] - [[1521]])"
  from:1522 till:1523 color:PA text:"[[Hadrian VI.|Hadrian VI.]] ([[1522]] - [[1523]])"
  from:1523 till:1534 color:PA text:"[[Clemens VII.|Clemens VII.]] ([[1523]] - [[1534]])"
  from:1534 till:1549 color:PA text:"[[Paul III.|Paul III.]] ([[1534]] - [[1549]])"
  from:1550 till:1555 color:PA text:"[[Julius III.|Julius III.]] ([[1550]] - [[1555]])"
  from:1555 till:1555 color:PA text:"[[Marcellus II.|Marcellus II.]] ([[1555]])"
  from:1555 till:1559 color:PA text:"[[Paul IV.|Paul IV.]] ([[1555]] - [[1559]])"
  from:1559 till:1565 color:PA text:"[[Pius IV.]] ([[1559]] - [[1565]])"
  from:1565 till:1572 color:PA text:"[[Pius V.]] (Hl.) ([[1565]] - [[1572]])"
  from:1572 till:1585 color:PA text:"[[Gregor XIII.|Gregor XIII.]] ([[1572]] - [[1585]])"
  from:1585 till:1590 color:PA text:"[[Sixtus V.|Sixtus V.]] ([[1585]] - [[1590]])"
  from:1590 till:1590 color:PA text:"[[Urban VII.|Urban VII.]] ([[1590]])"
  from:1590 till:1591 color:PA text:"[[Gregor XIV.|Gregor XIV.]] ([[1590]] - [[1591]])"
  from:1591 till:1591 color:PA text:"[[Innozenz IX.|Innozenz IX.]] ([[1591]])"
  from:1592 till:1605 color:PA text:"[[Clemens VIII.|Clemens VIII.]] ([[1592]] - [[1605]])"
  from:1605 till:1605 color:PA text:"[[Leo XI.|Leo XI.]] ([[1605]])"
  from:1605 till:1621 color:PA text:"[[Paul V.|Paul V.]] ([[1605]] - [[1621]])"
  from:1621 till:1623 color:PA text:"[[Gregor XV.|Gregor XV.]] ([[1621]] - [[1623]])"
  from:1623 till:1644 color:PA text:"[[Urban VIII.|Urban VIII.]] ([[1623]] - [[1644]])"
  from:1644 till:1655 color:PA text:"[[Innozenz X.|Innozenz X.]] ([[1644]] - [[1655]])"
  from:1655 till:1667 color:PA text:"[[Alexander VII.|Alexander VII.]] ([[1655]] - [[1667]])"
  from:1667 till:1669 color:PA text:"[[Clemens IX.|Clemens IX.]] ([[1667]] - [[1669]])"
  from:1670 till:1676 color:PA text:"[[Clemens X.|Clemens X.]] ([[1670]] - [[1676]])"
  from:1676 till:1689 color:PA text:"[[Innozenz XI.|Innozenz XI.]] ([[1676]] - [[1689]])"
  from:1689 till:1691 color:PA text:"[[Alexander VIII.|Alexander VIII.]] ([[1689]] - [[1691]])"
  from:1691 till:1700 color:PA text:"[[Innozenz XII.|Innozenz XII.]] ([[1691]] - [[1700]])"
  from:1700 till:1721 color:PA text:"[[Clemens XI.|Clemens XI.]] ([[1700]] - [[1721]])"
  from:1721 till:1724 color:PA text:"[[Innozenz XIII.|Innozenz XIII.]] ([[1721]] - [[1724]])"
  from:1724 till:1730 color:PA text:"[[Benedikt XIII.|Benedikt XIII.]] ([[1724]] - [[1730]])"
  from:1730 till:1740 color:PA text:"[[Clemens XII.|Clemens XII.]] ([[1730]] - [[1740]])"
  from:1740 till:1758 color:PA text:"[[Benedikt XIV.|Benedikt XIV.]] ([[1740]] - [[1758]])"
  barset:skip
| Liste der Päpste (graphisch) | top next |

First version by Gunter.krebs ? on Monday, August 9, 2004, last update on Sunday, January 22, 2006
ImageSize = width:800 height:auto barincrement:12
PlotArea  = top:10 bottom:30 right:130 left:20
AlignBars = early

DateFormat = yyyy
Period     = from:1750 till:2025
TimeAxis   = orientation:horizontal
ScaleMajor = unit:year increment:25 start:1750

Colors     =
  id:canvas      value:rgb(0.97,0.97,0.97)
  id:PA   value:green
  id:GP   value:red

Backgroundcolors = canvas:canvas

BarData =
  barset:Päpste

PlotData=
  width:5 align:left fontsize:S shift:(5,-4) anchor:till
  barset:Päpste

  from:1758 till:1769 color:PA text:"[[Clemens XIII.|Clemens XIII.]] ([[1758]] - [[1769]])"
  from:1769 till:1774 color:PA text:"[[Clemens XIV.|Clemens XIV.]] ([[1769]] - [[1774]])"
  from:1775 till:1799 color:PA text:"[[Pius VI.]] ([[1775]] - [[1799]])"
  from:1800 till:1823 color:PA text:"[[Pius VII.]] ([[1800]] - [[1823]])"
  from:1823 till:1829 color:PA text:"[[Leo XII.|Leo XII.]] ([[1823]] - [[1829]])"
  from:1829 till:1830 color:PA text:"[[Pius VIII.]] ([[1829]] - [[1830]])"
  from:1831 till:1846 color:PA text:"[[Gregor XVI.|Gregor XVI.]] ([[1831]] - [[1846]])"
  from:1846 till:1878 color:PA text:"[[Pius IX.]] ([[1846]] - [[1878]])"
  from:1878 till:1903 color:PA text:"[[Leo XIII.|Leo XIII.]] ([[1878]] - [[1903]])"
  from:1903 till:1914 color:PA text:"[[Pius X.]] (Hl.) ([[1903]] - [[1914]])"
  from:1914 till:1922 color:PA text:"[[Benedikt XV.|Benedikt XV.]] ([[1914]] - [[1922]])"
  from:1922 till:1939 color:PA text:"[[Pius XI.]] ([[1922]] - [[1939]])"
  from:1939 till:1958 color:PA text:"[[Pius XII.]] ([[1939]] - [[1958]])"
  from:1958 till:1963 color:PA text:"[[Johannes XXIII.|Johannes XXIII.]] ([[1958]] - [[1963]])"
  from:1963 till:1978 color:PA text:"[[Paul VI.|Paul VI.]] ([[1963]] - [[1978]])"
  from:1978 till:1978 color:PA text:"[[Johannes Paul I.|Johannes Paul I.]] ([[1978]])"
  from:1978 till:2005 color:PA text:"[[Johannes Paul II.|Johannes Paul II.]] ([[1978]]-[[2005]])"
  from:2005 till:2006 color:PA text:"[[Benedikt XVI.|Benedikt XVI.]] (seit [[2005]])"
  barset:skip
| Studentenbude | top next |

First version by Cwagener on Sunday, April 3, 2005, last update on Sunday, May 14, 2006
ImageSize = width:800 height:auto barincrement:12
PlotArea  = top:10 bottom:30 right:130 left:20
AlignBars = early

DateFormat = yyyy
Period     = from:0 till:400
TimeAxis   = orientation:horizontal
ScaleMajor = unit:year increment:50 start:0

Colors     =
  id:canvas      value:rgb(0.97,0.97,0.97)
  id:PA   value:green
  id:GP   value:red

Backgroundcolors = canvas:canvas

BarData =
  barset:Studentenbuden

PlotData=
  width:5 align:left fontsize:S shift:(5,-4) anchor:till
  barset:Studentenbuden

  from: 0 till: 325 color:GP text:"[[Frankfurt am Main]]" (325)
  from: 0 till: 305 color:GP text:"[[Hamburg]]" (305)
  from: 0 till: 301 color:GP text:"[[München]]" (301)
  from: 0 till: 297 color:GP text:"[[Darmstadt]]" (297)
  from: 0 till: 297 color:GP text:"[[Köln]]" (297)
  from: 0 till: 287 color:GP text:"[[Mainz]]" (287)
  from: 0 till: 281 color:GP text:"[[Düsseldorf]]" (281)
  from: 0 till: 280 color:GP text:"[[Bremen]]" (280)
  from: 0 till: 275 color:GP text:"[[Heidelberg]]" (275)
  from: 0 till: 272 color:GP text:"[[Berlin]]" (272)

  from: 0 till: 210 color:PA text:"[[Leipzig]]" (210)
  from: 0 till: 207 color:PA text:"[[Greifswald]]" (207)
  from: 0 till: 206 color:PA text:"[[Rostock]]" (206)
  from: 0 till: 206 color:PA text:"[[Halle]]" (206)
  from: 0 till: 204 color:PA text:"[[Magdeburg]]" (204)
  from: 0 till: 192 color:PA text:"[[Dresden]]" (192)
  from: 0 till: 192 color:PA text:"[[Jena]]" (192)
  from: 0 till: 184 color:PA text:"[[Chemnitz]]" (184)
  from: 0 till: 182 color:PA text:"[[Erfurt]]" (182)
  from: 0 till: 181 color:PA text:"[[Ilmenau]]" (181)
  barset:skip
| Template:Zeitleiste Verteidigungsminister (Österreich) | top next |

First version by Salmi on Friday, August 13, 2004, last update on Tuesday, May 16, 2006
ImageSize  = width:600 height:500
PlotArea   = width:530  height:450 left:50 bottom:40
Legend     = columns:4 left:15 top:20 columnwidth:50

DateFormat = yyyy
Period     = from:1945 till:2006
TimeAxis   = orientation:vertical
ScaleMajor = unit:year increment:4 start:1945

# there is no automatic collision detection,
# so shift texts up or down manually to avoid overlap

Colors=
  id:ÖVP  value:gray(0.25) legend:ÖVP
  id:SPÖ  value:red    legend:SPÖ
  id:FPÖ  value:blue   legend:FPÖ
  id:parteilos  value:gray(0.85)    legend:parteilos

Define $dx = 25 # shift text to right side of bar
Define $dy = -4 # adjust height

PlotData=

  bar:Minister color:red width:25 mark:(line,white) align:left fontsize:S

  from:1956  till:1961 shift:($dx,$dy)    color:ÖVP        text:[[Ferdinand Graf]]
  from:1961  till:1964 shift:($dx,$dy)    color:ÖVP        text:[[Karl Schleinzer]]
  from:1964  till:1970 shift:($dx,$dy)    color:ÖVP        text:[[Georg Prader]]
  from:1970  till:1971 shift:($dx,-6)    color:parteilos  text:[[Johann Freihsler]]
  from:1971  till:1971 shift:($dx,-1)    color:SPÖ        text:[[Bruno Kreisky]]
  from:1971  till:1977 shift:($dx,$dy)    color:SPÖ        text:[[Karl Lütgendorf|Karl Lütgendorf]]
  from:1977  till:1977 shift:($dx,$dy)    color:SPÖ        text:[[Bruno Kreisky]]
  from:1977  till:1983 shift:($dx,$dy)    color:SPÖ        text:[[Otto Rösch|Otto Rösch]]
  from:1983  till:1986 shift:($dx,$dy)    color:FPÖ        text:[[Friedhelm Frischenschlager]]
  from:1986  till:1987 shift:($dx,$dy)    color:FPÖ        text:[[Helmut Krünes|Helmut Krünes]]
  from:1987  till:1990 shift:($dx,$dy)    color:ÖVP        text:[[Robert Lichal]]
  from:1990  till:1990 shift:($dx,$dy)    color:ÖVP        text:[[Alois Mock]]
  from:1990  till:2000 shift:($dx,$dy)    color:ÖVP        text:[[Werner Fasslabend]]
  from:2000  till:2003 shift:($dx,$dy)    color:FPÖ        text:[[Herbert Scheibner]]
  from:2003  till:end  shift:($dx,$dy)    color:ÖVP        text:[[Günther Platter|Günther Platter]]

  bar:Regierung color:red width:25 mark:(line,white) align:left fontsize:S

  from:1945  till:1946 shift:($dx,-2)   color:SPÖ    text:Renner
  from:1946  till:1949 shift:($dx,$dy)  color:ÖVP    text:Figl I
  from:1949  till:1952 shift:($dx,$dy)  color:ÖVP    text:Figl II
  from:1952  till:1953 shift:($dx,$dy)  color:ÖVP    text:Figl III
  from:1953  till:1956 shift:($dx,$dy)  color:ÖVP    text:Raab I
  from:1956  till:1959 shift:($dx,$dy)  color:ÖVP    text:Raab II
  from:1959  till:1960 shift:($dx,$dy)  color:ÖVP    text:Raab III
  from:1960  till:1961 shift:($dx,-2)   color:ÖVP    text:Raab IV
  from:1961  till:1963 shift:($dx,$dy)  color:ÖVP    text:Gorbach I
  from:1963  till:1964 shift:($dx,$dy)  color:ÖVP    text:Gorbach II
  from:1964  till:1966 shift:($dx,$dy)  color:ÖVP    text:Klaus I
  from:1966  till:1970 shift:($dx,$dy)  color:ÖVP    text:Klaus II
  from:1970  till:1971 shift:($dx,$dy)  color:SPÖ    text:Kreisky I
  from:1971  till:1975 shift:($dx,$dy)  color:SPÖ    text:Kreisky II
  from:1975  till:1979 shift:($dx,$dy)  color:SPÖ    text:Kreisky III
  from:1979  till:1983 shift:($dx,$dy)  color:SPÖ    text:Kreisky IV
  from:1983  till:1986 shift:($dx,$dy)  color:SPÖ    text:Sinowatz
  from:1986  till:1987 shift:($dx,$dy)  color:SPÖ    text:Vranitzky I
  from:1987  till:1990 shift:($dx,$dy)  color:SPÖ    text:Vranitzky II
  from:1990  till:1994 shift:($dx,$dy)  color:SPÖ    text:Vranitzky III
  from:1994  till:1996 shift:($dx,$dy)  color:SPÖ    text:Vranitzky IV
  from:1996  till:1997 shift:($dx,$dy)  color:SPÖ    text:Vranitzky V
  from:1997  till:2000 shift:($dx,$dy)  color:SPÖ    text:Klima
  from:2000  till:2003 shift:($dx,$dy)  color:ÖVP    text:Schüssel I
  from:2003  till:end  shift:($dx,$dy)  color:ÖVP    text:Schüssel II
| Österreichischer Gewerkschaftsbund | top next |

First version by Fisch1917 on Monday, December 6, 2004, last update on Sunday, April 30, 2006
ImageSize  = width:400 height:500
PlotArea   = left:50 right:20 top:10 bottom:40
Legend     = columns:3 left:50 top:25 columnwidth:50

DateFormat = yyyy
Period     = from:1945 till:2006
TimeAxis   = orientation:vertical
ScaleMajor = unit:year increment:4 start:1945

# there is no automatic collision detection,
# so shift texts up or down manually to avoid overlap

Colors=
  id:FSG  value:red    legend:FSG
  id:FCG  value:gray(0.25) legend:FCG

Define $dx = 25 # shift text to right side of bar
Define $dy = -4 # adjust height

PlotData=
  bar:BPV color:red width:25 mark:(line,white) align:left fontsize:S

  from:1945  till:1959 shift:($dx,$dy)    color:FSG    text:Johann Böhm
  from:1959  till:1963 shift:($dx,$dy)    color:FSG    text:[[Franz Olah]]
  from:1963  till:1987 shift:($dx,$dy)    color:FSG    text:[[Anton Benya]]
  from:1987  till:2006 shift:($dx,$dy)    color:FSG    text:[[Friedrich Verzetnitsch|Fritz Verzetnitsch]]
  from:2006  till:end  shift:($dx,$dy)    color:FSG    text:[[Rudolf Hundstorfer]]
| US-amerikanische Kolonien | top next |
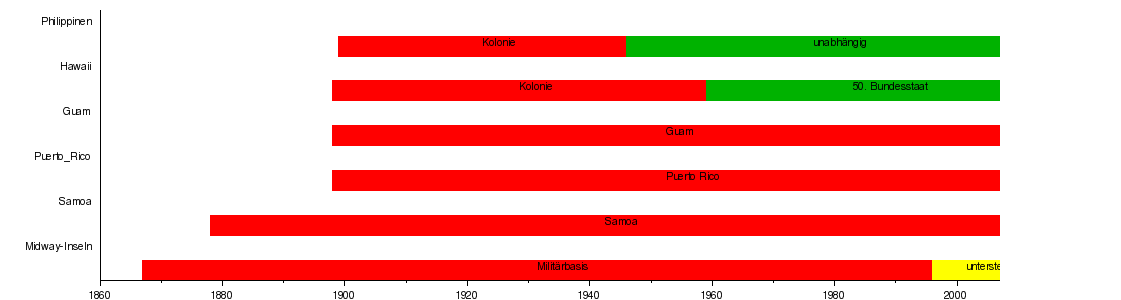
First version by DaSch on Wednesday, February 8, 2006, last update on Saturday, June 10, 2006
#Bitte nicht löschen, ist noch nicht fertig
ImageSize = width:1000 height:300
PlotArea = width:90% height:90% left:100 bottom:20
DateFormat = yyyy
Period = from:1860 till:2007
ScaleMajor  = unit:year increment:20 start:1860
ScaleMinor  = unit:year increment:10 start:1860
TimeAxis = orientation:horizontal
#Legend = orientation:horizontal position:bottom
PlotData =
  fontsize:S width:20
  bar:Philippinen
    from:1899 till:1946 text:Kolonie color:red
    from:1946 till:end text:unabhängig color:green
  bar:Hawaii
    from:1898 till:1959 text:Kolonie color:red
    from:1959 till:end text:50._Bundesstaat color:green
  bar:Guam from:1898 till:end text:Guam color:red
  bar:Puerto_Rico from:1898 till:end text:Puerto_Rico color:red
  bar:Samoa from:1878 till:end text:Samoa color:red
  bar:Midway-Inseln
   from:1867 till:1996 text:Militärbasis color:red
   from:1996 till:end text:untersteht_Innenministerium color:yellow
| Elchingen | top next |
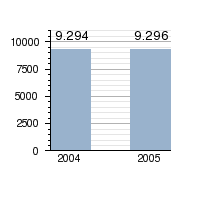
Initial version by HAH on Monday, July 10, 2006
Colors=
  id:lightgrey value:gray(0.9)
  id:darkgrey  value:gray(0.7)
  id:sfondo value:rgb(1,1,1)
  id:barra value:rgb(0.6,0.7,0.8)

#ImageSize  = width:250 height:200
ImageSize  = width:200 height:200
PlotArea   = left:50 bottom:50 top:30 right:30
DateFormat = x.y
Period     = from:0 till:11000
TimeAxis   = orientation:vertical
AlignBars  = justify
ScaleMajor = gridcolor:darkgrey increment:2500 start:0
ScaleMinor = gridcolor:lightgrey increment:500 start:0
BackgroundColors = canvas:sfondo

BarData=
  #bar:2003 text:2003
  bar:2004 text:2004
  bar:2005 text:2005

PlotData=
  color:barra width:40 align:center

  #bar:2003 from:0 till: 10185
  bar:2004 from:0 till: 9294
  bar:2005 from:0 till: 9296

PlotData=

  #bar:2003 at: 10185 fontsize:S text: 10.185 fontsize:M shift:(2,5)
  bar:2004 at:  9700 fontsize:S text:  9.294 fontsize:M shift:(2,5)
  bar:2005 at:  9700 fontsize:S text:  9.296 fontsize:M shift:(2,5)
| Álvaro Siza | top next |
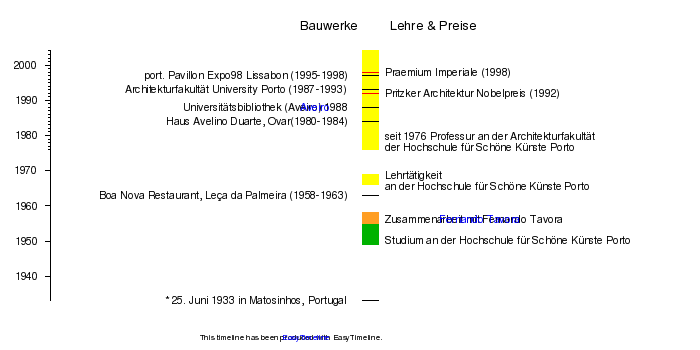
First version by Janekpfeifer on Monday, September 27, 2004, last update on Friday, February 18, 2005
ImageSize  = width:700 height:350
PlotArea   = width:640 height:250 left:50 bottom:50
AlignBars  = justify
DateFormat = yyyy
Period     = from:1933 till:2004
TimeAxis   = orientation:vertical
ScaleMajor = unit:year increment:10 start:1940
ScaleMinor = increment:1 unit:year start:1976


PlotData=
  bar:Leaders color:yellow width:16 align:left fontsize:S shift:(15,-4)

  from:1949 till:1955 shift:(,-10) color:green  text:Studium an der Hochschule für Schöne Künste Porto
  from:1955 till:1958 shift:(,-5)  color:orange text:Zusammenarbeit mit [[Fernando Tavora]]
  from:1966 till:1969 shift:(,0)   text:Lehrtätigkeit ~an der Hochschule für Schöne Künste Porto
  from:1976 till:end  shift:(,-40) text:seit 1976 Professur an der Architekturfakultät ~der Hochschule für Schöne Künste Porto

  mark:(line,black) align:right shift:(-20,-4)

  at:1933 text:"* 25. Juni 1933 in Matosinhos, Portugal"
  at:1963 text:Boa Nova Restaurant, Leça da Palmeira (1958-1963)
  at:1984 text:Haus Avelino Duarte, Ovar(1980-1984)
  at:1988 text:Universitätsbibliothek ([[Aveiro]]) 1988
  at:1993 text:Architekturfakultät University Porto (1987-1993)
  at:1997 text:port. Pavillon Expo98 Lissabon (1995-1998)

  mark:(line,red) align:left shift:(15,-4)

  at:1992 text:Pritzker Architektur "Nobelpreis" (1992)
  at:1998 text:Praemium Imperiale (1998)

TextData =
  textcolor:black fontsize:M
  pos:(300,320)  text:Bauwerke
  pos:(390,320) text:Lehre & Preise
  pos:(200,10)  fontsize:xs text:"This timeline has been produced with [[meta:EasyTimeline|EasyTimeline]]."
| Eschweiler | top next |

First version by SaMausHorrem on Thursday, July 27, 2006, last update on Friday, July 28, 2006
ImageSize = width:800 height:80
PlotArea  = width:700 height:50 left:50 bottom:25

DateFormat = yyyy
Period   = from:800 till:2050
TimeAxis  = orientation:horizontal
ScaleMajor = unit:year increment:100 start:800

Define $dx = 25 # shift text to right side of bar

PlotData=
 bar:Leadors color:red width:15 mark: (line,white) align:left fontsize:S

 color:blue from:800 till:960 shift:(-25,15) text:Frankenreich
 color:yellow from:960 till:1140 shift:(-40,15) text:Hl. Röm. Reich
 color:blue from:1140 till:1250 shift:(-40,15) text:Niederlothringen
 color:yellow from:1250 till:1420 shift:(-25,15) text:Domkapitel
 color:blue from:1420 till:1790 shift:(-30,15) text:Herzogtum Jülich
 color:yellow from:1790 till:1815 shift:(-10,15) text:Frk.
 color:blue from:1815 till:1945 shift:(-20,15) text:Preußen
 color:yellow from:1945 till:end shift:(-20,15) text:Nordrhein-Westfalen
| Tour de France 2005 | top next |

First version by St-fl on Friday, July 22, 2005, last update on Monday, July 3, 2006
ImageSize = width:600 height:600
PlotArea = left:25 right:0 bottom:20 top:10
DateFormat = yyyy
Period = from:0 till:21
TimeAxis = orientation:vertical order:reverse
ScaleMajor = gridcolor:white unit:year increment:1 start:0

Colors =
  id:alggeel    value:rgb(1,1,0.4)
  id:bergrood   value:rgb(1,0.5,0.5)
  id:puntgroen  value:rgb(0.7,1,0.5)
  id:lichtgrijs value:rgb(1,1,1)
  id:team       value:rgb(0.7, 0.7, 1)
PlotData=

  bar:Gesamtführender color:alggeel width:110 mark:(line,black) align:center fontsize:S shift:(0,2)
  # shift texts up or down manually to avoid overlap
  from:0  till:3  text:[[David Zabriskie]]
  from:3  till:8  text:[[Lance Armstrong]]
  from:8  till:9  text:[[Jens Voigt]]
  from:9  till:21 text:[[Lance Armstrong]]

  bar:Punktbester color:puntgroen
  # shift texts up or down manually to avoid overlap
  from:0  till:1  text:[[David Zabriskie]]
  from:1  till:11  text:[[Tom Boonen]]
  from:11 till:21  text:[[Thor Hushovd]]

  bar:Bergtrikot color:bergrood
  # shift texts up or down manually to avoid overlap
  from:0  till:1  text:Nicht vergeben
  from:1  till:2  text:[[Thomas Voeckler]]
  from:2  till:5  text:[[Erik Dekker]]
  from:5  till:6  text:[[Karsten Kroon]]
  from:6  till:7  text:[[Fabian Wegmann]]
  from:7  till:21  text:[[Michael Rasmussen]]

  bar:Jungprofi color:lichtgrijs
  # shift texts up or down manually to avoid overlap
  from:0  till:3  text:[[Fabian Cancellara]]
  from:3  till:7  text:[[Jaroslaw Popowytsch]]
  from:7  till:9  text:[[Wladimir Karpez]]
  from:9  till:12 text:[[Alejandro Valverde]]
  from:12  till:21 text:[[Jaroslaw Popowytsch]]

  bar:Teamwertung color:team
  from:0  till:14 text:[[Team CSC]]
  from:14 till:17 text:[[T-Mobile Team]]
  from:17 till:18 text:[[Discovery Channel Pro Cycling Team|Discovery Channel]]
  from:18 till:21 text:[[T-Mobile Team]]
| Schneeball Erde | top next |

First version by Achim Raschka on Sunday, April 2, 2006, last update on Saturday, June 24, 2006
ImageSize  = width:150 height:355
PlotArea   = left:30 right:5 bottom:65 top:5
AlignBars  = justify

Period      = from:542 till:1000
TimeAxis    = orientation:vertical
ScaleMajor  = unit:year increment:100 start:600
ScaleMinor  = unit:year increment:25 start:550

Colors =
  id:era  value:rgb(1,1,0.7)  legend:Neoproterozoikum   # light yellow
  id:period  value:rgb(1,0.7,0.7)  legend:Periode  # light red
  id:ball  value:rgb(0,0.7,1)  legend:Snowball_Earth  # light green
  id:black  value:black

Legend = left:15 top:60

BarData =
  bar:era
  bar:ball
  bar:period

PlotData=
  width:80 align:center textcolor:black mark:(line,black)

  bar:era color:era
  from:542  till:1000
  at:900 mark:none # text:[[Neoproterozoikum]]~(542-1000)

  bar:period color:period
  #width:60

  from:542  till:630  text:[[Ediacarium]]~(542-630)
  #at:565  mark:none  text:[[Ediacarium]]~(542-630)

  from:630  till:850
  at:790  mark:none  text:[[Cryogenium]]~(630-850)

  from:850  till:1000  text:[[Tonium]]~(850-1000)

  #width:10
  bar:ball color:ball

  from:580  till:750 mark:none #text:Snowball Earth~(580-750)
| Costigliole d'Asti | top next |

First version by Rosenzweig on Sunday, March 12, 2006, last update on Wednesday, March 15, 2006
Colors=
  id:lightgrey value:gray(0.9)
  id:darkgrey  value:gray(0.7)
  id:sfondo value:rgb(1,1,1)
  id:barra value:rgb(0.6,0.7,0.8)

ImageSize = width:455 height:373
PlotArea = left:50 bottom:50 top:30 right:30
DateFormat = x.y
Period = from:0 till:9000
TimeAxis = orientation:vertical
AlignBars = justify
ScaleMajor = gridcolor:darkgrey increment:500 start:0
ScaleMinor = gridcolor:lightgrey increment:100 start:0
BackgroundColors = canvas:sfondo

BarData=
  bar:1861 text:1861
  bar:1871 text:1871
  bar:1881 text:1881
  bar:1901 text:1901
  bar:1911 text:1911
  bar:1921 text:1921
  bar:1931 text:1931
  bar:1936 text:1936
  bar:1951 text:1951
  bar:1961 text:1961
  bar:1971 text:1971
  bar:1981 text:1981
  bar:1991 text:1991
  bar:2001 text:2001

PlotData=
  color:barra width:20 align:left

  bar:1861 from:0 till: 5789
  bar:1871 from:0 till: 6799
  bar:1881 from:0 till: 7192
  bar:1901 from:0 till: 8865
  bar:1911 from:0 till: 8519
  bar:1921 from:0 till: 8631
  bar:1931 from:0 till: 7825
  bar:1936 from:0 till: 7357
  bar:1951 from:0 till: 6507
  bar:1961 from:0 till: 6114
  bar:1971 from:0 till: 5670
  bar:1981 from:0 till: 6008
  bar:1991 from:0 till: 5940
  bar:2001 from:0 till: 5882

PlotData=

  bar:1861 at: 5789 fontsize:S text: 5.789 shift:(-8,5)
  bar:1871 at: 6799 fontsize:S text: 6.799 shift:(-10,5)
  bar:1881 at: 7192 fontsize:S text: 7.192 shift:(-10,5)
  bar:1901 at: 8865 fontsize:S text: 8.865 shift:(-10,5)
  bar:1911 at: 8519 fontsize:S text: 8.519 shift:(-10,5)
  bar:1921 at: 8631 fontsize:S text: 8.631 shift:(-10,5)
  bar:1931 at: 7825 fontsize:S text: 7.825 shift:(-10,5)
  bar:1936 at: 7357 fontsize:S text: 7.357 shift:(-10,5)
  bar:1951 at: 6507 fontsize:S text: 6.507 shift:(-10,5)
  bar:1961 at: 6114 fontsize:S text: 6.114 shift:(-10,5)
  bar:1971 at: 5670 fontsize:S text: 5.670 shift:(-10,5)
  bar:1981 at: 6008 fontsize:S text: 6.008 shift:(-10,5)
  bar:1991 at: 5940 fontsize:S text: 5.940 shift:(-10,5)
  bar:2001 at: 5882 fontsize:S text: 5.882 shift:(-10,5)
| Template:Zeitleiste Neuere Österreichische Verfassungsgeschichte | top next |

First version by Friedrich.Kromberg on Sunday, November 7, 2004, last update on Sunday, June 18, 2006
ImageSize  = width:325 height:540
PlotArea   = left:50 right:0 top:10 bottom:80
Legend     = columns:2 left:15 top:65 columnwidth:140

DateFormat = yyyy
Period     = from:1804 till:2006
TimeAxis   = orientation:vertical
ScaleMajor = unit:year increment:10 start:1810

# there is no automatic collision detection,
# so shift texts up or down manually to avoid overlap

Colors=
  id:Mon  value:gray(0.25) legend:Monarchie
  id:Sta  value:gray(0.8)  legend:Ständestaat
  id:Dik  value:blue       legend:Deutsches_Reich
  id:DOE  value:green      legend:Erste_Republik
  id:Rep  value:red        legend:Zweite_Republik

PlotData=

  bar:BReg color:red width:25 mark:(line,white) align:left fontsize:7 shift:(25,-4)

  from:1804  till:1867 color:Mon text:[[Kaisertum Österreich|Kaisertum Österreich]]
  from:1867  till:1918 color:Mon text:[[Österreich-Ungarn|Österreich-Ungarn]]
  from:1918  till:1920 color:DOE text:[[Deutschösterreich|Republik Deutschösterreich]]
  from:1920  till:1933 color:DOE text:[[Österreich|Republik Österreich]]
  from:1933  till:1938 color:Sta text:[[Ständestaat|Bundesstaat Österreich ('Ständestaat')]]
  from:1938  till:1945 color:Dik text:[[Österreich in der Zeit des Nationalsozialismus|Teil des Deutschen Reiches]]
  from:1945  till:1955 color:Rep text:[[Besetztes Nachkriegsösterreich|Republik Österreich unter alliierter Besatzung]]
  from:1955  till:1995 color:Rep text:[[Österreich|Republik Österreich]]
  from:1995  till:end  color:Rep text:[[Österreich|Republik Österreich]] als [[EU]]-Mitglied
| Entfernungsmessung | top next |

First version by Xorx on Friday, September 30, 2005, last update on Sunday, May 7, 2006
# Entfernungsskala von [[Benutzer:xorx|Dr. Schorsch]]
# 27. September 2005

ImageSize = width:800 height:213

PlotArea = width:96% height:80% left:2% bottom:18%

Colors =
  id:lightgrey   value:rgb(0.8588,0.9059,0.9647)   #legend:test
  id:darkgrey    value:gray(0.40)   #legend:grau
  id:geraet      value:rgb(0.4667,0.8627,0.251) #legend:Gerät

  id:methode     value:rgb(1,0.6824 ,0.3294) legend:Messmethoden
  id:markcolor   value:rgb(1,0,0) #legend:Marke
  id:vergl       value:rgb(0.4667,0.8627,0.251) legend:Größenbeispiele
  id:pref1       value:rgb(1,0.9059,0.4078) legend:Präfixe
  id:pref2       value:rgb(1,0.9412,0.8196) legend:Präfixe_

# Legendenformat
Legend = orientation:vertical left:20 top:200

# Definitionen für Textoffsets
# Vertikale Verschiebung der Beispiele untere Zeile
Define $bsu = -3
# Vertikale Verschiebung der Beispiele obere Zeile
Define $bso = -3
# Vertikale Verschiebung der Methodennamen
Define $msv = -3
# Vertikale Verschiebung der Präfixe
Define $psv = -3
# Balkenbreite
Define $width = width:15

BackgroundColors = canvas:lightgrey bars:lightgrey

# Datumsachse enthält die Größenordnung
DateFormat = yyyy

Period = from:-18 till:27

AlignBars = early

TimeAxis = orientation:horizontal format:yyyy

ScaleMajor = gridcolor:darkgrey unit:year increment:3 start:-18

BarData =
# Reihenfolge der Balken
#  bar:Messschieber
#  bar:Mikroskop
#  bar:Geo600
#  bar:Raster
#  bar:Trenner1

#Methoden
  bar:Rotver
  bar:Parallaxe
  bar:RadioInter
  bar:Triang
  bar:Laufzeit
  bar:Direkt
  bar:Interferometrie
#  bar:Trenner2

#Größenvergleiche
  bar:verglo
  bar:verglu

# Die Präfixe sind immer ganz unten
  bar:prefix

PlotData =
# Trennlinien
  color:darkgrey $width
#  bar:Trenner1 from:start till:end
#  bar:Trenner2 from:start till:end

# Geraeteliste
  color:geraet $width
#  bar:Mikroskop    from:-7  till:-3 align:center text:[[Lichtmikroskop|Mikroskop]]
#  bar:Geo600       from:-18 till:-6 align:center text:optisches Interferometer [[Geo600]]
#  bar:Raster       from:-12 till:-6 align:center text:[[Rastertunnelmikroskop]]
#  bar:Messschieber from:-4  till:0  align:center text:[[Messschieber]]

#Methoden
  color:methode
  bar:Rotver        from:18  till:26 align:center shift:(0,$msv) text:[[Rotverschiebung]]
  bar:Triang        from:-6  till:19 align:center shift:(0,$msv) text:[[Triangulation]]
  bar:Parallaxe     from:15  till:26 align:center shift:(0,$msv) text:[[Parallaxe]]
  bar:Laufzeit      from:-2  till:12 align:center shift:(0,$msv) text:[[Laufzeitmessung]]
  bar:Direkt        from:-6  till:2  align:center shift:(0,$msv) text:direkte_Messung
  bar:Interferometrie from:-18 till:3 align:center shift:(0,$msv) text:[[optische Interferometrie]]
# Das ist noch geraten:
  bar:RadioInter from:-1 till:18 align:center shift:(0,$msv) text:[[Radiointerferometrie]]

# Die Praefixe
  color:pref1 fontsize:S
  bar:prefix from:-18 till:-15 shift:(0,$psv) text:Atto align:center
  color:pref2
  bar:prefix from:-15 till:-12 shift:(0,$psv) text:Femto align:center
  color:pref1
  bar:prefix from:-12 till:-9 shift:(0,$psv) text:Pico align:center
  color:pref2
  bar:prefix from:-9 till:-6 shift:(0,$psv) text:Nano align:center
  color:pref1
  bar:prefix from:-6 till:-3 shift:(0,$psv) text:Mikro align:center
  color:pref2
  bar:prefix from:-3 till:0 shift:(0,$psv) text:Milli align:center
  color:pref1
  bar:prefix from:0 till:3 shift:(0,-5) fontsize:M text:Meter align:center
  color:pref2
  bar:prefix from:3 till:6 shift:(0,$psv) text:Kilo align:center
  color:pref1
  bar:prefix from:6 till:9 shift:(0,$psv) text:Mega align:center
  color:pref2
  bar:prefix from:9 till:12 shift:(0,$psv) text:Giga align:center
  color:pref1
  bar:prefix from:12 till:15 shift:(0,$psv) text:Tera align:center
  color:pref2
  bar:prefix from:15 till:18 shift:(0,$psv) text:Peta align:center
  color:pref1
  bar:prefix from:18 till:21 shift:(0,$psv) text:Exa align:center
  color:pref2
  bar:prefix from:21 till:24 shift:(0,$psv) text:Zetta align:center
  color:pref1
  bar:prefix from:24 till:27 shift:(0,$psv) text:Yotta align:center


#Größenvergleiche
  color:vergl mark:(line,markcolor) fontsize:S width:16
#  bar:vergl at:-35 align:center text:[[Planck-Einheiten|Planck-Länge]]
# Hintergrundbalken
  bar:verglo from:start till:end
  bar:verglu from:start till:end
  bar:verglo at:-15 align:right  shift:(0,$bso) text:[[Quark (Physik)|Quark]]
  bar:verglu at:-14 align:right  shift:(0,$bsu) text:[[Proton]]
  bar:verglo at:-13 align:left   shift:(2,$bso) text:[[Atomkern]]
  bar:verglu at:-10 align:right  shift:(0,$bsu) text:[[Atom]]
  bar:verglo at:-9  align:left   shift:(2,$bso) text:[[Molekül]]
  bar:verglu at:-8  align:right  shift:(0,$bsu) text:[[Desoxyribonukleinsäure|DNA]]
  bar:verglo at:-6  align:left   shift:(2,$bso) text:[[Zelle (Biologie)|Zelle]]
  bar:verglu at:-5  align:right  shift:(0,$bsu) text:[[Mikrobe]]
  bar:verglo at:-4  align:left   shift:(2,$bso) text:[[Haar]]
  bar:verglu at:-2  align:right  shift:(0,$bsu) text:[[Münze]]
  bar:verglo at:0   align:left   shift:(2,$bso) text:[[Mensch]]
  bar:verglu at:1   align:right  shift:(0,$bsu) text:[[Haus]]
  bar:verglo at:3   align:left   shift:(2,$bso) text:[[Berg]]
  bar:verglu at:4   align:right  shift:(0,$bsu) text:[[Stadt]]
  bar:verglo at:6   align:left   shift:(2,$bso) text:[[Rhein]]
  bar:verglu at:7   align:right  shift:(0,$bsu) text:[[Erde]]
  bar:verglo at:9   align:left   shift:(2,$bso) text:[[Sonne]]
  bar:verglu at:11  align:left   shift:(2,$bsu) text:[[Astronomische Einheit|Erde-Sonne]]
  bar:verglo at:16  align:right  shift:(0,$bso) text:[[Lichtjahr]]
  bar:verglu at:17  align:left   shift:(2,$bsu) text:[[Parsec]]
  bar:verglu at:20  align:left   shift:(2,$bsu) text:[[Supernova]]
  bar:verglo at:21  align:right  shift:(0,$bso) text:[[Milchstraße]]
  bar:verglu at:24  align:left   shift:(2,$bsu) text:[[Virgo-Galaxienhaufen|Virgo]]
  bar:verglo at:26  align:right  shift:(0,$bso) text:[[Universum]]

TextData=
# Zentrierter Tabulator
  tabs:(372-center)
  pos:(0,4) fontsize:M text:^10_hoch_x_Meter
| Template:Zeitleiste Albanische Geschichte | top next |
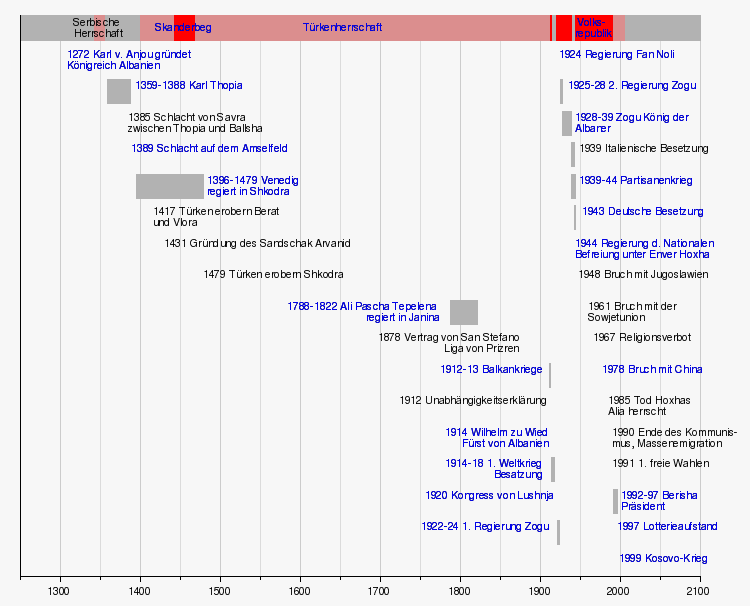
First version by Albinfo on Tuesday, November 30, 2004, last update on Sunday, July 23, 2006
DateFormat = yyyy
ImageSize  = width:750 height:auto barincrement:33
PlotArea   = left:20 right:50 bottom:30 top:15

Colors     =
  id:canvas      value:rgb(0.97,0.97,0.97)
  id:grid1       value:rgb(0.80,0.80,0.80)
  id:grid2       value:rgb(0.86,0.86,0.86)
  id:Timeperiod  value:red
  id:Timeperiod2 value:rgb(0.86,0.56,0.56)
  id:grau        value:gray(0.7)

Period     = from:1250 till:2100
TimeAxis   = orientation:horizontal format:yyyy
ScaleMajor = unit:year  increment:100 start:1300 gridcolor:grid1
ScaleMinor = unit:year  increment:50  start:1250 gridcolor:grid2
AlignBars  = justify

BackgroundColors = canvas:canvas bars:canvas

BarData=
  bar:Timeperiod
  barset:Timeperiod2

PlotData=
  width:25 fontsize:S textcolor:black align:center

  bar:Timeperiod color:Timeperiod shift:(0,-3)
  from:start till:end  color:grau # Hintergrund
  from:1343  till:1355 text: "Serbische ~Herrschaft" color:Timeperiod2 shift:(0,2)
  from:1400  till:1912 text: "Türkenherrschaft" link:http://de.wikipedia.org/wiki/Osmanisches_Reich color:Timeperiod2
  from:1443  till:1468 text: "Skanderbeg" link:http://de.wikipedia.org/wiki/Skanderbeg
  from:1913  till:1914 text: " "
  from:1920  till:1939 text: " "
  from:1944  till:1991 text: "Volks- ~republik" link:http://de.wikipedia.org/wiki/Kommunismus shift:(0,2)
  from:1992  till:2006 text: " " color:Timeperiod2


  width:24 fontsize:S textcolor:black anchor:from align:left color:grau
  barset:Timeperiod2
  at:1272             text: "1272 Karl v. Anjou gründet ~Königreich Albanien" link:http://de.wikipedia.org/wiki/Karl_von_Anjou shift:(30,2)
  from:1359 till:1388 text: "1359-1388 Karl Thopia" link:http://de.wikipedia.org/wiki/Karl_Thopia shift:(28,2)
  at:1385             text: "1385 Schlacht von Savra ~zwischen Thopia und Ballsha" shift:(0,2)
  at:1389             text: "1389 Schlacht auf dem Amselfeld" link:http://de.wikipedia.org/wiki/Schlacht_auf_dem_Amselfeld shift:(0,2)
  from:1396 till:1479 text: "1396-1479 Venedig ~regiert in Shkodra" link:http://de.wikipedia.org/wiki/Republik_Venedig shift:(71,2)
  at:1417             text: "1417 Türken erobern Berat ~und Vlora" shift:(0,2)
  at:1431             text: "1431 Gründung des Sandschak Arvanid" shift:(0,2)
  at:1479             text: "1479 Türken erobern Shkodra" shift:(0,2)
  from:1788 till:1822 text: "1788-1822 Ali Pascha Tepelena ~regiert in Janina" link:http://de.wikipedia.org/wiki/Ali_Pascha_Tepelena shift:(-8,2) align:right
  at:1878             text: "1878 Vertrag von San Stefano~Liga von Prizren" shift:(0,2) align:right
  from:1912 till:1913 text: "1912-13 Balkankriege" link:http://de.wikipedia.org/wiki/Balkankriege shift:(-4,2) align:right
  at:1912             text: "1912 Unabhängigkeitserklärung" shift:(0,2) align:right
  at:1914             text: "1914 Wilhelm zu Wied~Fürst von Albanien" link:http://de.wikipedia.org/wiki/Wilhelm_zu_Wied shift:(0,2) align:right
  from:1914 till:1918 text: "1914-18 1. Weltkrieg~Besatzung" link:http://de.wikipedia.org/wiki/Erster_Weltkrieg shift:(-6,2) align:right
  at:1920             text: "1920 Kongress von Lushnja" link:http://de.wikipedia.org/wiki/Kongress_von_Lushnja shift:(0,2) align:right
  from:1922 till:1924 text: "1922-24 1. Regierung Zogu" link:http://de.wikipedia.org/wiki/Ahmet_Zogu shift:(-6,2) align:right
  barset:break
  at:1924             text: "1924 Regierung Fan Noli" link:http://de.wikipedia.org/wiki/Fan_Noli shift:(0,2)
  from:1925 till:1928 text: "1925-28 2. Regierung Zogu" link:http://de.wikipedia.org/wiki/Ahmet_Zogu shift:(8,2)
  from:1928 till:1939 text: "1928-39 Zogu König der ~Albaner" link:http://de.wikipedia.org/wiki/Ahmet_Zogu shift:(13,2)
  from:1939 till:1943 text: "1939 Italienische Besetzung" shift:(8,2)
  from:1939 till:1944 text: "1939-44 Partisanenkrieg" link:http://de.wikipedia.org/wiki/Zweiter_Weltkrieg shift:(8,2)
  from:1943 till:1944 text: "1943 Deutsche Besetzung" link:http://de.wikipedia.org/wiki/Zweiter_Weltkrieg shift:(8,2)
  at:1944             text: "1944 Regierung d. Nationalen ~Befreiung unter Enver Hoxha" link:http://de.wikipedia.org/wiki/Enver_Hoxha shift:(0,2)
  at:1948             text: "1948 Bruch mit Jugoslawien" shift:(0,2)
  at:1961             text: "1961 Bruch mit der ~Sowjetunion" shift:(0,2)
  at:1967             text: "1967 Religionsverbot" shift:(0,2)
  at:1978             text: "1978 Bruch mit China" link:http://de.wikipedia.org/wiki/Volksrepublik_China shift:(0,2)
  at:1985             text: "1985 Tod Hoxhas ~Alia herrscht" shift:(0,2)
  at:1990             text: "1990 Ende des Kommunis-~mus, Massenemigration" shift:(0,2)
  at:1991             text: "1991 1. freie Wahlen" shift:(0,2)
  from:1992 till:1997 text: "1992-97 Berisha ~Präsident" link:http://de.wikipedia.org/wiki/Sali_Berisha shift:(8,2)
  at:1997             text: "1997 Lotterieaufstand" link:http://de.wikipedia.org/wiki/Lotterieaufstand shift:(0,2)
  at:1999             text: "1999 Kosovo-Krieg" link:http://de.wikipedia.org/wiki/Kosovo-Krieg shift:(0,2)
| Template:Zeitleiste Außenminister (Österreich) ab 1945 | top next |

First version by 83.218.181.75 on Sunday, December 12, 2004, last update on Tuesday, May 16, 2006
ImageSize  = width:600 height:500
PlotArea   = width:530  height:450 left:50 bottom:40
Legend     = columns:4 left:15 top:20 columnwidth:50

DateFormat = yyyy
Period     = from:1945 till:2006
TimeAxis   = orientation:vertical
ScaleMajor = unit:year increment:4 start:1945

# there is no automatic collision detection,
# so shift texts up or down manually to avoid overlap

Colors=
  id:ÖVP  value:gray(0.25) legend:ÖVP
  id:SPÖ  value:red    legend:SPÖ
  id:parteilos  value:gray(0.85)    legend:parteilos

Define $dx = 25 # shift text to right side of bar
Define $dy = -4 # adjust height

PlotData=

  bar:Minister color:red width:25 mark:(line,white) align:left fontsize:S
  from:1945  till:1953 shift:($dx,$dy)    color:ÖVP        text:[[Karl Gruber]]
  from:1953  till:1959 shift:($dx,$dy)    color:ÖVP        text:[[Leopold Figl]]
  from:1959  till:1966 shift:($dx,$dy)    color:SPÖ        text:[[Bruno Kreisky]]
  from:1966  till:1968 shift:($dx,$dy)    color:ÖVP        text:[[Lujo Toncic-Sorinj]]
  from:1968  till:1970 shift:($dx,$dy)    color:ÖVP        text:[[Kurt Waldheim]]
  from:1970  till:1974 shift:($dx,$dy)    color:parteilos  text:[[Rudolf Kirchschläger]]
  from:1974  till:1976 shift:($dx,$dy)    color:parteilos  text:[[Erich Bielka]]
  from:1976  till:1983 shift:($dx,$dy)    color:parteilos  text:[[Willibald Pahr]]
  from:1983  till:1984 shift:($dx,$dy)    color:SPÖ        text:[[Erwin Lanc]]
  from:1984  till:1986 shift:($dx,$dy)    color:SPÖ        text:[[Leopold Gratz]]
  from:1986  till:1987 shift:($dx,$dy)    color:SPÖ        text:[[Peter Jankowitsch]]
  from:1987  till:1995 shift:($dx,$dy)    color:ÖVP        text:[[Alois Mock]]
  from:1995  till:2000 shift:($dx,$dy)    color:ÖVP        text:[[Wolfgang Schüssel]]
  from:2000  till:2004 shift:($dx,$dy)    color:ÖVP        text:[[Benita Ferrero-Waldner]]
  from:2004  till:end  shift:($dx,$dy)    color:ÖVP        text:[[Ursula Plassnik]]


  bar:Regierung color:red width:25 mark:(line,white) align:left fontsize:S

  from:1945  till:1946 shift:($dx,-2)   color:SPÖ    text:Renner
  from:1946  till:1949 shift:($dx,$dy)  color:ÖVP    text:Figl I
  from:1949  till:1952 shift:($dx,$dy)  color:ÖVP    text:Figl II
  from:1952  till:1953 shift:($dx,$dy)  color:ÖVP    text:Figl III
  from:1953  till:1956 shift:($dx,$dy)  color:ÖVP    text:Raab I
  from:1956  till:1959 shift:($dx,$dy)  color:ÖVP    text:Raab II
  from:1959  till:1960 shift:($dx,$dy)  color:ÖVP    text:Raab III
  from:1960  till:1961 shift:($dx,-2)   color:ÖVP    text:Raab IV
  from:1961  till:1963 shift:($dx,$dy)  color:ÖVP    text:Gorbach I
  from:1963  till:1964 shift:($dx,$dy)  color:ÖVP    text:Gorbach II
  from:1964  till:1966 shift:($dx,$dy)  color:ÖVP    text:Klaus I
  from:1966  till:1970 shift:($dx,$dy)  color:ÖVP    text:Klaus II
  from:1970  till:1971 shift:($dx,$dy)  color:SPÖ    text:Kreisky I
  from:1971  till:1975 shift:($dx,$dy)  color:SPÖ    text:Kreisky II
  from:1975  till:1979 shift:($dx,$dy)  color:SPÖ    text:Kreisky III
  from:1979  till:1983 shift:($dx,$dy)  color:SPÖ    text:Kreisky IV
  from:1983  till:1986 shift:($dx,$dy)  color:SPÖ    text:Sinowatz
  from:1986  till:1987 shift:($dx,$dy)  color:SPÖ    text:Vranitzky I
  from:1987  till:1990 shift:($dx,$dy)  color:SPÖ    text:Vranitzky II
  from:1990  till:1994 shift:($dx,$dy)  color:SPÖ    text:Vranitzky III
  from:1994  till:1996 shift:($dx,$dy)  color:SPÖ    text:Vranitzky IV
  from:1996  till:1997 shift:($dx,$dy)  color:SPÖ    text:Vranitzky V
  from:1997  till:2000 shift:($dx,$dy)  color:SPÖ    text:Klima
  from:2000  till:2003 shift:($dx,$dy)  color:ÖVP    text:Schüssel I
  from:2003  till:end  shift:($dx,$dy)  color:ÖVP    text:Schüssel II
| Template:Zeitleiste Außenminister (Österreich) vor 1945 | top next |

First version by 83.218.181.75 on Sunday, December 12, 2004, last update on Tuesday, May 16, 2006
ImageSize  = width:350  height:600
PlotArea   = left:50 right:10 top:50 bottom:50
Legend     = columns:4 left:55 top:40 columnwidth:70

DateFormat = yyyy
Period     = from:1918 till:1938
TimeAxis   = orientation:vertical
ScaleMajor = unit:year increment:4 start:1918

# there is no automatic collision detection,
# so shift texts up or down manually to avoid overlap

Colors=
  id:CS         value:gray(0.25)       legend:CS
  id:SDAPÖ      value:red              legend:SDAPÖ
  id:VF         value:gray(0.85)       legend:VF
  id:NSDAP      value:redorange        legend:NSDAP
  id:Beamter    value:blue             legend:Beamter

Define $dx = 25 # shift text to right side of bar
Define $dy = -4 # adjust height

PlotData=

  bar:Minister color:red width:25 mark:(line,white) align:left fontsize:S shift:($dx,$dy)

  at:1918    mark:(line, SDAPÖ)        color:SDAPÖ   text:[[Victor Adler]] (SDAPÖ)
  from:1918  till:1919                 color:SDAPÖ   text:[[Otto Bauer]]
  from:1919  till:1920                 color:SDAPÖ   text:[[Karl Renner]]*
  from:1920  till:1921                 color:CS      text:[[Michael Mayr]]*
  from:1921  till:1922                 color:Beamter text:[[Johann Schober]]*
  at:1922    mark:(line, Beamter)      color:Beamter text:[[Walter Breisky]]*
  at:1922    mark:(line, Beamter)      color:Beamter text:                    und Leopold Hennet
  from:1922  till:1924                 color:CS      text:[[Alfred Grünberger]]
  from:1924  till:1926                 color:CS      text:[[Heinrich Mataja]]
  at:1926    mark:(line, CS)           color:CS      text:[[Rudolf Ramek]]** (CS)
  from:1926  till:1929                 color:CS      text:[[Ignaz Seipel]]**
  at:1929    mark:(line, CS)           color:CS      text:[[Ernst Streeruwitz]]** (CS)
  from:1929  till:1930                 color:Beamter text:[[Johann Schober]]**
  at:1930    mark:(line, CS)           color:CS      text:[[Ignaz Seipel]] (CS)
  from:1930  till:1932                 color:Beamter text:[[Johann Schober]]
  at:1932    mark:(line, CS)           color:CS      text:[[Karl Buresch]]** (CS)
  from:1932  till:1934                 color:VF      text:[[Engelbert Dollfuß]]** (CS/VF)
  at:1934    mark:(line, VF)           color:VF      text:[[Stephan Tauschitz]] (Landbund/VF)
  from:1934  till:1936                 color:VF      text:[[Egon Berger-Waldenegg]]
  at:1936    mark:(line, VF)           color:VF      text:[[Kurt Schuschnigg]]** (VF)
  from:1936  till:1938                 color:VF      text:[[Guido Schmidt]]
  at:1938    mark:(line, NSDAP)        color:NSDAP   text:[[Wilhelm Wolf]] (NSDAP)

TextData=
 pos:20,590 fontsize:M
 text:* auch Staats- bzw. Bundeskanzler
 pos:20,580 fontsize:M
 text:** als Bundeskanzler
| Lunare Zeitskala | top next |

Initial version by Stalefish on Tuesday, September 13, 2005
ImageSize  = width:800 height:100
PlotArea   = left:15 right:15 bottom:20 top:5
AlignBars  = early

Period      = from:-4550 till:0
TimeAxis    = orientation:horizontal
ScaleMajor  = unit:year increment:500 start:-4500
ScaleMinor  = unit:year increment:100 start:-4500

PlotData=
 align:center textcolor:black fontsize:8 mark:(line,black) width:25 shift:(0,-5)

 text:kopernikanisch from:-1100 till:0
 text:eratosthenisch from:-3200 till:-1100
 text:ober-imbrisch from:-3800 till:-3200
 text:unter-imbrisch from:-3850 till:-3800 shift:(0,25)
 text:nektarisch from:-3920 till:-3850 shift:(0,5)
 from:start  till:-3920  text:pränektarisch
| Template:Zeitleiste Dirigenten der Neujahrskonzerte | top next |
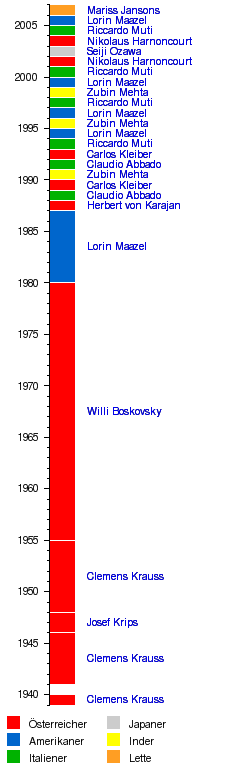
First version by 83.218.181.75 on Saturday, December 18, 2004, last update on Sunday, December 25, 2005
ImageSize  = width:230 height:770
PlotArea   = width:180  height:700 left:50 bottom:70
Legend     = columns:2 left:10 top:60 columnwidth:100

DateFormat = yyyy
Period     = from:1939 till:2007
TimeAxis   = orientation:vertical
ScaleMajor = unit:year increment:5 start:1940
ScaleMinor = unit:year increment:1 start:1939


# there is no automatic collision detection,
# so shift texts up or down manually to avoid overlap

Colors=
  id:AUT  value:red		legend:Österreicher
  id:USA  value:blue		legend:Amerikaner
  id:ITA  value:green		legend:Italiener
  id:JPN  value:gray(0.8)	legend:Japaner
  id:IND  value:yellow		legend:Inder
  id:LAT  value:orange		legend:Lette

Define $dx = 25 # shift text to right side of bar
Define $dy = -4 # adjust height

PlotData=

  bar:Dirigenten width:25 mark:(line,white) align:left fontsize:S
  from:1939  till:1940 shift:($dx,$dy)    color:AUT	   text:[[Clemens Krauss]]
  from:1941  till:1946 shift:($dx,$dy)    color:AUT        text:[[Clemens Krauss]]
  from:1946  till:1948 shift:($dx,$dy)    color:AUT        text:[[Josef Krips]]
  from:1948  till:1955 shift:($dx,$dy)    color:AUT        text:[[Clemens Krauss]]
  from:1955  till:1980 shift:($dx,$dy)    color:AUT        text:[[Willi Boskovsky]]
  from:1980  till:1987 shift:($dx,$dy)    color:USA        text:[[Lorin Maazel]]
  from:1987  till:1988 shift:($dx,$dy)    color:AUT	   text:[[Herbert von Karajan]]
  from:1988  till:1989 shift:($dx,$dy)    color:ITA	   text:[[Claudio Abbado]]
  from:1989  till:1990 shift:($dx,$dy)    color:AUT	   text:[[Carlos Kleiber]]
  from:1990  till:1991 shift:($dx,$dy)    color:IND	   text:[[Zubin Mehta]]
  from:1991  till:1992 shift:($dx,$dy)    color:ITA	   text:[[Claudio Abbado]]
  from:1992  till:1993 shift:($dx,$dy)    color:AUT	   text:[[Carlos Kleiber]]
  from:1993  till:1994 shift:($dx,$dy)    color:ITA	   text:[[Riccardo Muti]]
  from:1994  till:1995 shift:($dx,$dy)    color:USA	   text:[[Lorin Maazel]]
  from:1995  till:1996 shift:($dx,$dy)    color:IND	   text:[[Zubin Mehta]]
  from:1996  till:1997 shift:($dx,$dy)    color:USA	   text:[[Lorin Maazel]]
  from:1997  till:1998 shift:($dx,$dy)    color:ITA	   text:[[Riccardo Muti]]
  from:1998  till:1999 shift:($dx,$dy)    color:IND	   text:[[Zubin Mehta]]
  from:1999  till:2000 shift:($dx,$dy)    color:USA	   text:[[Lorin Maazel]]
  from:2000  till:2001 shift:($dx,$dy)    color:ITA	   text:[[Riccardo Muti]]
  from:2001  till:2002 shift:($dx,$dy)    color:AUT	   text:[[Nikolaus Harnoncourt]]
  from:2002  till:2003 shift:($dx,$dy)    color:JPN	   text:[[Seiji Ozawa]]
  from:2003  till:2004 shift:($dx,$dy)    color:AUT	   text:[[Nikolaus Harnoncourt]]
  from:2004  till:2005 shift:($dx,$dy)    color:ITA	   text:[[Riccardo Muti]]
  from:2005  till:2006 shift:($dx,$dy)    color:USA	   text:[[Lorin Maazel]]
  from:2006  till:2007 shift:($dx,$dy)    color:LAT	   text:[[Mariss Jansons]]
| Template:Zeitleiste Deutsche Finanzminister | top next |
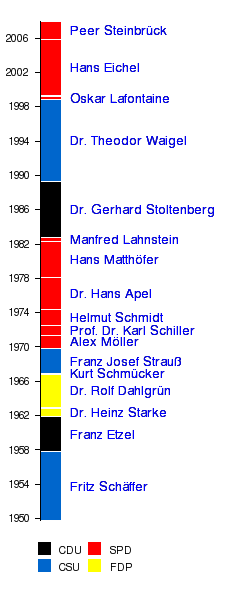
First version by Manu on Wednesday, December 22, 2004, last update on Thursday, November 24, 2005
ImageSize	= width:250 height:600
PlotArea	= left:40 right:0 bottom:80 top:20
Legend		= columns:3 left:40 top:60 columnwidth:50

DateFormat	= dd/mm/yyyy
Period		= from:20/09/1949 till:31/12/2007
TimeAxis	= orientation:vertical format:yyyy

ScaleMajor	= unit:year increment:4 start:1950

Colors=
 id:CDU	value:black	legend:CDU
 id:CSU value:blue      legend:CSU
 id:SPD value:red	legend:SPD
 id:FDP value:yellow	legend:FDP

PlotData=
 bar:Außenminister color:CDU width:20 fontsize:M align:left shift:(20,-5) mark:(line,white)

 from:start till:29/10/1957 text:[[Fritz_Schäffer|Fritz_Schäffer]] color:CSU
 from:29/10/1957 till:14/11/1961 text:[[Franz_Etzel]] color:CDU
 from:14/11/1961 till:19/11/1962 text:[[Heinz_Starke|Dr._Heinz_Starke]] color:FDP
 from:13/12/1962 till:28/10/1966 text:[[Rolf_Dahlgrün|Dr._Rolf_Dahlgrün]] color:FDP
 from:08/11/1966 till:30/11/1966 text:[[Kurt_Schmücker|Kurt_Schmücker]] color:CDU
 from:02/12/1966 till:20/10/1969 text:[[Franz_Josef_Strauß|Franz_Josef_Strauß]] color:CSU
 from:22/10/1969 till:13/05/1971 text:[[Alex_Möller|Alex_Möller]] color:SPD
 from:13/05/1971 till:07/07/1972 text:[[Karl_Schiller|Prof._Dr._Karl_Schiller]] color:SPD
 from:07/07/1972 till:15/05/1974 text:[[Helmut_Schmidt]] color:SPD
 from:16/05/1974 till:15/02/1978 text:[[Hans_Apel|Dr._Hans_Apel]] color:SPD
 from:16/02/1978 till:28/04/1982 text:[[Hans_Matthöfer|Hans_Matthöfer]] color:SPD
 from:28/04/1982 till:04/10/1982 text:[[Manfred_Lahnstein]] color:SPD
 from:04/10/1982 till:21/04/1989 text:[[Gerhard_Stoltenberg|Dr._Gerhard_Stoltenberg]] color:CDU
 from:21/04/1989 till:27/10/1998 text:[[Theodor_Waigel|Dr._Theodor_Waigel]] color:CSU
 from:27/10/1998 till:18/03/1999 text:[[Oskar_Lafontaine]] color:SPD
 from:12/04/1999 till:22/11/2005 text:[[Hans_Eichel]] color:SPD
 from:22/11/2005 till:end text:[[Peer_Steinbrück|Peer_Steinbrück]] color:SPD
| Serekunda | top next |

First version by Atamari on Thursday, October 6, 2005, last update on Thursday, July 13, 2006
ImageSize  = width:238 height:120
PlotArea = width:80% height:70% left:20% bottom:20%
AlignBars  = late

DateFormat = yyyy
Period     = from:0 till:400000
TimeAxis   = orientation:vertical
ScaleMajor = increment:100000 start:0

PlotData=
  color:drabgreen
  bar:1983 from:start till:25505
  bar:1993 from:start till:70435
  bar:2003 from:start till:194987
  bar:2005 from:start till:323421
  bar:2006 from:start till:335733

TextData=
  pos:(100,110) fontsize:M text:Einwohnerentwicklung
| Template:Zeitleiste Deutsche Umweltminister | top next |

First version by Manu on Friday, January 28, 2005, last update on Monday, November 28, 2005
ImageSize	= width:300 height:250
PlotArea	= left:40 right:0 bottom:50 top:10
Legend          = columns:3 left:40 top:40 columnwidth:50

DateFormat	= dd/mm/yyyy
Period		= from:01/01/1986 till:01/01/2007
TimeAxis	= orientation:vertical format:yyyy

ScaleMajor	= unit:year increment:4 start:1986

Colors=
 id:CDU	  value:black	legend:CDU
 id:SPD   value:red     legend:SPD
 id:Grüne value:green   legend:Bündnis_90/Die_Grünen


PlotData=
 bar:Umweltminister color:CDU width:20 fontsize:M align:left shift:(20,-5) mark:(line,white)

 from:06/06/1986 till:22/04/1987 color:CDU   text:[[Walter Wallmann]]
 from:07/05/1987 till:17/11/1994 color:CDU text:[[Klaus Töpfer|Klaus Töpfer]]
 from:17/11/1994 till:27/10/1998 text:[[Angela Merkel]]
 from:27/10/1998 till:18/10/2005 color:Grüne text:[[Jürgen Trittin|Jürgen Trittin]]
 from:22/11/2005 till:end color:SPD text:[[Sigmar Gabriel]]
| Janjanbureh | top next |

First version by Atamari on Sunday, April 17, 2005, last update on Wednesday, July 12, 2006
ImageSize  = width:238 height:120
PlotArea = width:80% height:70% left:20% bottom:20%
AlignBars  = late

DateFormat = yyyy
Period     = from:0 till:5000
TimeAxis   = orientation:vertical
ScaleMajor = increment:1000 start:0

PlotData=
  color:drabgreen
  bar:1983 from:start till:3068
  bar:1993 from:start till:2813
  bar:2005 from:start till:3584
  bar:2006 from:start till:3641

TextData=
  pos:(100,110) fontsize:M text:Einwohnerentwicklung
| Basse Santa Su | top next |

First version by Atamari on Sunday, April 17, 2005, last update on Tuesday, July 11, 2006
ImageSize  = width:238 height:120
PlotArea = width:80% height:70% left:20% bottom:20%
AlignBars  = late

DateFormat = yyyy
Period     = from:0 till:20000
TimeAxis   = orientation:vertical
ScaleMajor = increment:5000 start:0

PlotData=
  color:drabgreen
  bar:1983 from:start till:5371
  bar:1993 from:start till:9265
  bar:2003 from:start till:12070
  bar:2005 from:start till:14380
  bar:2006 from:start till:14856

TextData=
  pos:(100,110) fontsize:M text:Einwohnerentwicklung
| Brikama | top next |

First version by Atamari on Sunday, April 17, 2005, last update on Tuesday, July 11, 2006
ImageSize  = width:238 height:120
PlotArea = width:80% height:70% left:20% bottom:20%
AlignBars  = late

DateFormat = yyyy
Period     = from:0 till:100000
TimeAxis   = orientation:vertical
ScaleMajor = increment:25000 start:0

PlotData=
  color:drabgreen
  bar:1963 from:start till:4195
  bar:1973 from:start till:9483
  bar:1983 from:start till:19624
  bar:1993 from:start till:42480
  bar:2003 from:start till:63000
# bar:2005 from:start till:77700 auskommentiert
  bar:2006 from:start till:80726

TextData=
  pos:(100,110) fontsize:M text:Einwohnerentwicklung
| Werneck | top next |

Initial version by HAH on Saturday, May 27, 2006
Colors=
  id:lightgrey value:gray(0.9)
  id:darkgrey  value:gray(0.7)
  id:sfondo value:rgb(1,1,1)
  id:barra value:rgb(0.6,0.7,0.8)

ImageSize  = width:300 height:200
PlotArea   = left:50 bottom:50 top:30 right:30
DateFormat = x.y
Period     = from:0 till:12000
TimeAxis   = orientation:vertical
AlignBars  = justify
ScaleMajor = gridcolor:darkgrey increment:2500 start:0
ScaleMinor = gridcolor:lightgrey increment:500 start:0
BackgroundColors = canvas:sfondo

BarData=
  bar:1970 text:1970
  bar:1987 text:1987
  bar:2000 text:2000

PlotData=
  color:barra width:40 align:center

  bar:1970 from:0 till: 10252
  bar:1987 from:0 till:  9759
  bar:2000 from:0 till: 10513

PlotData=

  bar:1970 at: 10252 fontsize:S text: 10.252 fontsize:M shift:(2,5)
  bar:1987 at:  9759 fontsize:S text:  9.759 fontsize:M shift:(2,5)
  bar:2000 at: 10513 fontsize:S text: 10.513 fontsize:M shift:(2,5)

TextData=
  fontsize:S pos:(20,20)
  text:"Einwohner auf dem Gebiet der Gemeinde Werneck"
| Template:EasyTimeline Beispiele AlignBars | top next |

Initial version by Erik Zachte ? on Sunday, February 27, 2005
ImageSize  = width:90 height:120
PlotArea   = width:65 height:80 left:20 bottom:20
AlignBars  = early

DateFormat = yyyy
Period     = from:1 till:5
TimeAxis   = orientation:horizontal
ScaleMajor = unit:year increment:1 start:1

PlotData=
  color:red width:10
  bar:A from:start till:end
  bar:B from:start till:end
  bar:C from:start till:end
  bar:D from:start till:end

TextData=
  pos:(20,110) fontsize:M text:Early
| Template:EasyTimeline Beispiele AlignBars | top next |

Initial version by Erik Zachte ? on Sunday, February 27, 2005
ImageSize  = width:90 height:120
PlotArea   = width:65 height:80 left:20 bottom:20
AlignBars  = late

DateFormat = yyyy
Period     = from:1 till:5
TimeAxis   = orientation:horizontal
ScaleMajor = unit:year increment:1 start:1

PlotData=
  color:red width:10
  bar:A from:start till:end
  bar:B from:start till:end
  bar:C from:start till:end
  bar:D from:start till:end

TextData=
  pos:(20,110) fontsize:M text:Late
| Template:EasyTimeline Beispiele AlignBars | top next |

Initial version by Erik Zachte ? on Sunday, February 27, 2005
ImageSize  = width:90 height:120
PlotArea   = width:65 height:80 left:20 bottom:20
AlignBars  = justify

DateFormat = yyyy
Period     = from:1 till:5
TimeAxis   = orientation:horizontal
ScaleMajor = unit:year increment:1 start:1

PlotData=
  color:red width:10
  bar:A from:start till:end
  bar:B from:start till:end
  bar:C from:start till:end
  bar:D from:start till:end

TextData=
  pos:(20,110) fontsize:M text:Justify
| Template:EasyTimeline Beispiele AlignBars | top next |

Initial version by Erik Zachte ? on Sunday, February 27, 2005
ImageSize  = width:90 height:120
PlotArea   = width:65 height:80 left:20 bottom:20
AlignBars  = early

DateFormat = yyyy
Period     = from:1 till:5
TimeAxis   = orientation:vertical
ScaleMajor = unit:year increment:1 start:1

PlotData=
  color:red width:10
  bar:A from:start till:end
  bar:B from:start till:end
  bar:C from:start till:end
  bar:D from:start till:end

TextData=
  pos:(20,110) fontsize:M text:Early
| Template:EasyTimeline Beispiele AlignBars | top next |

Initial version by Erik Zachte ? on Sunday, February 27, 2005
ImageSize  = width:90 height:120
PlotArea   = width:65 height:80 left:20 bottom:20
AlignBars  = late

DateFormat = yyyy
Period     = from:1 till:5
TimeAxis   = orientation:vertical
ScaleMajor = unit:year increment:1 start:1

PlotData=
  color:red width:10
  bar:A from:start till:end
  bar:B from:start till:end
  bar:C from:start till:end
  bar:D from:start till:end

TextData=
  pos:(20,110) fontsize:M text:Late
| Template:EasyTimeline Beispiele AlignBars | top next |

Initial version by Erik Zachte ? on Sunday, February 27, 2005
ImageSize  = width:90 height:120
PlotArea   = width:65 height:80 left:20 bottom:20
AlignBars  = justify

DateFormat = yyyy
Period     = from:1 till:5
TimeAxis   = orientation:vertical
ScaleMajor = unit:year increment:1 start:1

PlotData=
  color:red width:10
  bar:A from:start till:end
  bar:B from:start till:end
  bar:C from:start till:end
  bar:D from:start till:end

TextData=
  pos:(20,110) fontsize:M text:Justify
| Aura im Sinngrund | top next |

Initial version by HAH on Saturday, June 3, 2006
Colors=
  id:lightgrey value:gray(0.9)
  id:darkgrey  value:gray(0.7)
  id:sfondo value:rgb(1,1,1)
  id:barra value:rgb(0.6,0.7,0.8)

ImageSize  = width:320 height:200
PlotArea   = left:50 bottom:50 top:30 right:50
DateFormat = x.y
Period     = from:0 till:1300
TimeAxis   = orientation:vertical
AlignBars  = justify
ScaleMajor = gridcolor:darkgrey increment:500 start:0
ScaleMinor = gridcolor:lightgrey increment:100 start:0
BackgroundColors = canvas:sfondo

BarData=
  bar:1970 text:1970
  bar:1987 text:1987
  bar:2002 text:2002

PlotData=
  color:barra width:40 align:center

  bar:1970 from:0 till: 1134
  bar:1987 from:0 till: 1104
  bar:2002 from:0 till: 1085

PlotData=

  bar:1970 at: 1134 fontsize:S text: 1.134 fontsize:M shift:(2,5)
  bar:1987 at: 1104 fontsize:S text: 1.104 fontsize:M shift:(2,5)
  bar:2002 at: 1085 fontsize:S text: 1.085 fontsize:M shift:(2,5)

TextData=
  fontsize:S pos:(20,20)
  text:"Einwohner auf dem Gebiet der Gemeinde Aura im Sinngrund"
| Wipfeld | top next |

Initial version by HAH on Saturday, May 27, 2006
Colors=
  id:lightgrey value:gray(0.9)
  id:darkgrey  value:gray(0.7)
  id:sfondo value:rgb(1,1,1)
  id:barra value:rgb(0.6,0.7,0.8)

ImageSize  = width:500 height:200
PlotArea   = left:50 bottom:50 top:30 right:30
DateFormat = x.y
Period     = from:0 till:1200
TimeAxis   = orientation:vertical
AlignBars  = justify
ScaleMajor = gridcolor:darkgrey  increment:250 start:0
ScaleMinor = gridcolor:lightgrey increment:50  start:0
BackgroundColors = canvas:sfondo

BarData=
  bar:1939 text:1939
  bar:1950 text:1950
  bar:1987 text:1987
  bar:1999 text:1999
  bar:2002 text:2002

PlotData=
  color:barra width:40 align:center

  bar:1939 from:0 till: 792
  bar:1950 from:0 till: 1067
  bar:1987 from:0 till: 1027
  bar:1999 from:0 till: 1159
  bar:2002 from:0 till: 1180

PlotData=

  bar:1939 at:  792 fontsize:M text:   792 shift:(2,5)
  bar:1950 at: 1067 fontsize:M text: 1.067 shift:(2,5)
  bar:1987 at: 1027 fontsize:M text: 1.027 shift:(2,5)
  bar:1999 at: 1159 fontsize:M text: 1.159 shift:(2,5)
  bar:2002 at: 1180 fontsize:M text: 1.180 shift:(2,5)

TextData=
  fontsize:M pos:(20,20)
  text:"Einwohner auf dem Gebiet der Gemeinde Wipfeld"
| Juffure | top next |
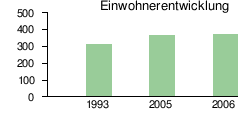
First version by Atamari on Tuesday, October 4, 2005, last update on Wednesday, July 12, 2006
ImageSize  = width:238 height:120
PlotArea = width:80% height:70% left:20% bottom:20%
AlignBars  = late

DateFormat = yyyy
Period     = from:0 till:500
TimeAxis   = orientation:vertical
ScaleMajor = increment:100 start:0

PlotData=
  color:drabgreen
  bar:1993 from:start till:311
  bar:2005 from:start till:369
  bar:2006 from:start till:373

TextData=
  pos:(100,110) fontsize:M text:Einwohnerentwicklung
| Template:Zeitleiste Siemens-Geschäftsführer | top next |

First version by Tkarcher on Wednesday, March 23, 2005, last update on Sunday, July 30, 2006
ImageSize  = width:210 height:550
PlotArea   = width:50 height:530 left:40 bottom:10
Colors =
  id:lightyellow value:rgb(1,1,0.8)
  id:petrol value:rgb(0,0.6,0.6)

DateFormat = yyyy
Period     = from:1847 till:2005
TimeAxis   = orientation:vertical
ScaleMajor = unit:year increment:25 start:1850
ScaleMinor = unit:year increment:5 start:1850
BackgroundColors = canvas:lightyellow

Define $dx = 20 # shift text to right side of bar

PlotData =
  bar:Chairmen color:petrol width:25 mark:(line,white) align:left fontsize:S

  from:start till:1890  shift:($dx,0)   text:"[[Werner von Siemens]]~(1847-1890)"
  from:1890  till:1919  shift:($dx,0)   text:"[[Georg Wilhelm von Siemens|Wilhelm von Siemens]]~(1890-1919)"
  from:1919  till:1941  shift:($dx,0)   text:"[[Carl Friedrich von Siemens|Carl Fr. von Siemens]]~(1919-1941)"
  from:1941  till:1956  shift:($dx,0)   text:"[[Hermann von Siemens]]~(1941-1956)"
  from:1956  till:1968  shift:($dx,0)   text:"[[Ernst von Siemens]]~(1956-1968)"
  from:1968  till:1971  shift:($dx,0)   text:"[[Gerd Tacke]]~(1968-1971)"
  from:1971  till:1981  shift:($dx,0)   text:"[[Bernhard Plettner]]~(1971-1981)"
  from:1981  till:1992  shift:($dx,0)   text:"[[Karlheinz Kaske]]~(1981-1992)"
  from:1992  till:2005  shift:($dx,-8)  text:"[[Heinrich von Pierer]]~(1992-2005)"
  from:2005  till:end   shift:($dx,-5)  text:"[[Klaus Kleinfeld]]~(seit 2005)"
| Real Betis Balompié | top next |

First version by 87.123.17.139 on Wednesday, October 19, 2005, last update on Tuesday, July 11, 2006
#Todas las longitudes se miden en píxeles
ImageSize = width:200 height:400 #Tamaño de la imagen: ancho, alto
PlotArea = width:50 height:380 left:50 bottom:10 #Tamaño de la gráfica en sí dentro de la imagen: ancho, alto, margen izquierdo, margen derecho
DateFormat = yyyy #Formato de fechas= y-cifra de año, m-cifra de mes, d-cifra de día.
Period = from:1955 till:2008 #Período de tiempo representado: desde, hasta
TimeAxis = orientation:vertical #Orientación del eje de tiempos: horizontal o vertical
ScaleMajor = unit:year increment:5 start:1955 #Escala

# No se da cuenta de cuándo chocan dos frases, así que hay
# que moverlas a mano con la variable $dx

Define $dx = 25 # shift text to right side of bar

PlotData=
#barra, color, ancho, ?, alineamiento, tamaño de fuente (XS,S,M,L,XL)
  bar:Líderes color:green width:25 mark:(line,white) align:left fontsize:S

 #desde     hasta desplazamiento($dx, píxeles) texto y enlace
 from:start till:1965 shift:($dx,9)  text:Benito~Villamarin
 from:1965  till:1967 shift:($dx,3)  text: Andres Gaviño~Avelino Villamarin
 from:1967  till:1970 shift:($dx,4)   text: José León~Julio de la Puerta
 from:1970  till:1978 shift:($dx,8)  text:José~Nuñez Naranjo
 from:1978  till:1983 shift:($dx,4)   text:Juan Manuel~Mauduit
 from:1983  till:1989 shift:($dx,5) 	text:Gerardo~Martinez Retamero
 from:1989  till:1992 shift:($dx,3)   text:Hugo~Galera
 from:1992  till:1996 shift:($dx,3)   text:José~León
 from:1996  till:2006 shift:($dx,9)   text:Manuel~Ruiz de Lopera
 from:2006  till:end  shift:($dx,5)  text:Pepe~León
| Template:Zeitleiste BR-Intendanten | top next |

First version by Tkarcher on Friday, April 1, 2005, last update on Wednesday, February 1, 2006
ImageSize  = width:220 height:550
PlotArea   = width:50 height:520 left:40 bottom:22
Colors =
  id:lightyellow value:rgb(1,1,0.8)

DateFormat = yyyy
Period     = from:1945 till:2005
TimeAxis   = orientation:vertical
ScaleMajor = unit:year increment:10 start:1950
ScaleMinor = unit:year increment:2 start:1946
BackgroundColors = canvas:lightyellow

Define $dx = 20 # shift text to right side of bar

PlotData =
  bar:Impresario color:blue width:25 mark:(line,white) align:left fontsize:S

  from:start till:1947 shift:($dx,-2)  text:[[Field Horine]] (1945-1947)~Chief of Section~von Radio München
  at:1947              shift:($dx,1)  text:[[Edmund Schechter]] (1947)
  from:1947  till:1956 shift:($dx,0)  text:[[Rudolf von Scholtz]]~(1947-1956)
  from:1956  till:1960 shift:($dx,0)  text:[[Franz Stadelmayer]]~(1956-1960)
  from:1960  till:1972 shift:($dx,0)  text:[[Christian Wallenreiter]]~(1960-1972)
  from:1972  till:1990 shift:($dx,0)  text:[[Reinhold V%C3%B6th|Reinhold Vöth]]~(1972-1990)
  from:1990  till:2002 shift:($dx,0)  text:Prof. Dr. h.c.~[[Albert Scharf]]~(1990-2002)
  from:2002  till:end  shift:($dx,0)  text:[[Thomas_Gruber|Dr. Thomas Gruber]]~(2002-heute)
| Graphische Darstellung der europäischen Universitäten | top next |
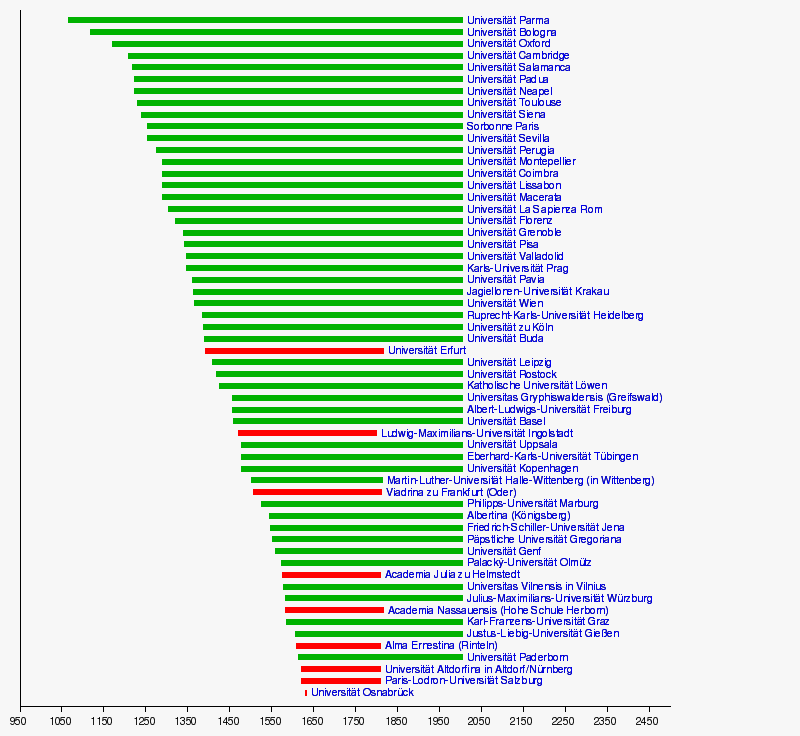
First version by Docmo ? on Sunday, April 3, 2005, last update on Sunday, April 30, 2006
ImageSize = width:800 height:auto barincrement:12
PlotArea  = top:10 bottom:30 right:130 left:20
AlignBars = early

DateFormat = yyyy
Period     = from:950 till:2500
TimeAxis   = orientation:horizontal
ScaleMajor = unit:year increment:100 start:950

Colors     =
  id:canvas      value:rgb(0.97,0.97,0.97)
  id:PA   value:green
  id:GP   value:red

Backgroundcolors = canvas:canvas

BarData =
  barset:Universitäten

PlotData=
  width:5 align:left fontsize:S shift:(5,-4) anchor:till
  barset:Universitäten

  from: 1065 till: 2006 color:PA text:"[[Universität Parma]]"
  from: 1119 till: 2006 color:PA text:"[[Universität Bologna]]"
  from: 1170 till: 2006 color:PA text:"[[Universität Oxford]]"
  from: 1209 till: 2006 color:PA text:"[[Universität Cambridge]]"
  from: 1218 till: 2006 color:PA text:"[[Universität Salamanca]]"
  from: 1222 till: 2006 color:PA text:"[[Universität Padua]]"
  from: 1224 till: 2006 color:PA text:"[[Universität Neapel]]"
  from: 1229 till: 2006 color:PA text:"[[Universität Toulouse]]"
  from: 1240 till: 2006 color:PA text:"[[Universität Siena]]"
  from: 1253 till: 2006 color:PA text:"[[Sorbonne|Sorbonne Paris]]"
  from: 1254 till: 2006 color:PA text:"[[Universität Sevilla]]"
  from: 1276 till: 2006 color:PA text:"[[Universität Perugia]]"
  from: 1289 till: 2006 color:PA text:"[[Universität Montepellier]]"
  from: 1290 till: 2006 color:PA text:"[[Universität Coimbra]]"
  from: 1290 till: 2006 color:PA text:"[[Universität Lissabon]]"
  from: 1290 till: 2006 color:PA text:"[[Universität Macerata]]"
  from: 1303 till: 2006 color:PA text:"[[Universität La Sapienza|Universität La Sapienza Rom]]"
  from: 1321 till: 2006 color:PA text:"[[Universität Florenz]]"
  from: 1339 till: 2006 color:PA text:"[[Universität Grenoble]]"
  from: 1343 till: 2006 color:PA text:"[[Universität Pisa]]"
  from: 1346 till: 2006 color:PA text:"[[Universität Valladolid]]"
  from: 1348 till: 2006 color:PA text:"[[Karls-Universität Prag]]"
  from: 1361 till: 2006 color:PA text:"[[Universität Pavia]]"
  from: 1364 till: 2006 color:PA text:"[[Jagiellonen-Universität|Jagiellonen-Universität Krakau]]"
  from: 1365 till: 2006 color:PA text:"[[Universität Wien]]"
  from: 1386 till: 2006 color:PA text:"[[Ruprecht-Karls-Universität Heidelberg]]"
  from: 1388 till: 2006 color:PA text:"[[Universität zu Köln]]"
  from: 1389 till: 2006 color:PA text:"[[Universität Buda]]"
  from: 1392 till: 1816 color:GP text:"[[Universität Erfurt]]"
  from: 1409 till: 2006 color:PA text:"[[Universität Leipzig]]"
  from: 1419 till: 2006 color:PA text:"[[Universität Rostock]]"
  from: 1425 till: 2006 color:PA text:"[[Universität Löwen (Belgien)|Katholische Universität Löwen]]"
  from: 1456 till: 2006 color:PA text:"[[Ernst-Moritz-Arndt-Universität Greifswald|Universitas Gryphiswaldensis (Greifswald)]]"
  from: 1457 till: 2006 color:PA text:"[[Albert-Ludwigs-Universität Freiburg]]"
  from: 1460 till: 2006 color:PA text:"[[Universität Basel]]"
  from: 1472 till: 1800 color:GP text:"[[Universität Ingolstadt|Ludwig-Maximilians-Universität Ingolstadt]]"
  from: 1477 till: 2006 color:PA text:"[[Universität Uppsala]]"
  from: 1477 till: 2006 color:PA text:"[[Universität Tübingen|Eberhard-Karls-Universität Tübingen]]"
  from: 1479 till: 2006 color:PA text:"[[Universität Kopenhagen]]"
  from: 1502 till: 1815 color:PA text:"[[Martin-Luther-Universität Halle-Wittenberg|Martin-Luther-Universität Halle-Wittenberg (in Wittenberg)]]"
  from: 1506 till: 1811 color:GP text:"[[Europa-Universität Viadrina|Viadrina zu Frankfurt (Oder)]]"
  from: 1527 till: 2006 color:PA text:"[[Philipps-Universität Marburg]]"
  from: 1544 till: 2006 color:PA text:"[[Albertina (Königsberg)]]"
  from: 1548 till: 2006 color:PA text:"[[Friedrich-Schiller-Universität Jena]]"
  from: 1551 till: 2006 color:PA text:"[[Päpstliche Universität Gregoriana]]"
  from: 1559 till: 2006 color:PA text:"[[Universität Genf]]"
  from: 1573 till: 2006 color:PA text:"[[Palacký-Universität|Palacký-Universität Olmütz]]"
  from: 1576 till: 1809 color:GP text:"[[Universität Helmstedt|Academia Julia zu Helmstedt]]
  from: 1579 till: 2006 color:PA text:"[[Universität Vilnius|Universitas Vilnensis in Vilnius]]"
  from: 1582 till: 2006 color:PA text:"[[Julius-Maximilians-Universität Würzburg]]"
  from: 1584 till: 1817 color:GP text:"[[Herborn|Academia Nassauensis (Hohe Schule Herborn)]]"
  from: 1585 till: 2006 color:PA text:"[[Karl-Franzens-Universität Graz]]"
  from: 1607 till: 2006 color:PA text:"[[Justus-Liebig-Universität Gießen]]"
  from: 1609 till: 1809 color:GP text:"[[Universität Rinteln|Alma Ernestina (Rinteln)]]"
  from: 1614 till: 2006 color:PA text:"[[Universität Paderborn]]"
  from: 1622 till: 1809 color:GP text:"[[Universität Altdorf|Universität "Altdorfina" in Altdorf/Nürnberg]]"
  from: 1622 till: 1810 color:GP text:"[[Paris-Lodron-Universität Salzburg]]"
  from: 1630 till: 1633 color:GP text:"[[Universität Osnabrück]]"
  barset:skip
| Graphische Darstellung der europäischen Universitäten | top next |

First version by Docmo ? on Sunday, April 3, 2005, last update on Sunday, April 30, 2006
ImageSize = width:800 height:auto barincrement:12
PlotArea  = top:10 bottom:30 right:130 left:20
AlignBars = early

DateFormat = yyyy
Period     = from:950 till:2500
TimeAxis   = orientation:horizontal
ScaleMajor = unit:year increment:100 start:950

Colors     =
  id:canvas      value:rgb(0.97,0.97,0.97)
  id:PA   value:green
  id:GP   value:red

Backgroundcolors = canvas:canvas

BarData =
  barset:Universitäten

PlotData=
  width:5 align:left fontsize:S shift:(5,-4) anchor:till
  barset:Universitäten

  from: 1655 till: 1818 color:GP text:"[[Universität Duisburg]]"
  from: 1665 till: 2006 color:PA text:"[[Christian-Albrechts-Universität Kiel]]"
  from: 1665 till: 2006 color:PA text:"[[Universität Breslau]]"
  from: 1666 till: 2006 color:PA text:"[[Universität Lund]]"
  from: 1669 till: 2006 color:PA text:"[[Universität Innsbruck]]"
  from: 1692 till: 2006 color:PA text:"[[Akademie der bildenden Künste Wien]]"
  from: 1694 till: 2006 color:PA text:"[[Martin-Luther-Universität Halle-Wittenberg|Martin-Luther-Universität Halle-Wittenberg (in Halle)]]"
  from: 1716 till: 2006 color:PA text:"[[Technische Universität Ostrava|Montanuniversität Bergakademie Ostrau]]"
  from: 1736 till: 2006 color:PA text:"[[Universität Göttingen|Georg-August-Universität Göttingen]]"
  from: 1742 till: 2006 color:PA text:"[[Friedrich-Alexander-Universität Erlangen-Nürnberg]]"
  from: 1745 till: 2006 color:PA text:"[[Technische Universität Braunschweig|Technische Universität Carolo Wilhelmina zu Braunschweig]]"
  from: 1765 till: 2006 color:PA text:"[[Technische Universität Bergakademie Freiberg]]"
  from: 1775 till: 2006 color:PA text:"[[Technische Universität Clausthal|Technische Universität Bergakademie Clausthal]]"
  from: 1776 till: 2006 color:PA text:"[[Babe\\u015f-Bolyai-Universität Cluj]]"
  from: 1780 till: 2006 color:PA text:"[[Westfälische Wilhelms-Universität|Westfälische Wilhelms-Universität zu Münster]]"
  from: 1798 till: 1873 color:GP text:"[[Aschaffenburg|Fürstl. Primatische u. Erzbischöfl. Regensburgische Univ. zu Aschaffenbg.]]"
  from: 1800 till: 1826 color:GP text:"[[Universität Ingolstadt|Ludwig-Maximilians-Universität Landshut]]"
  from: 1809 till: 2006 color:PA text:"[[Humboldt-Universität zu Berlin]]"
  from: 1815 till: 2006 color:PA text:"[[Technische Universität Wien]]"
  from: 1818 till: 2006 color:PA text:"[[Rheinische Friedrich-Wilhelms-Universität|Rheinische Friedrich-Wilhelms-Universität Bonn]]"
  from: 1826 till: 2006 color:PA text:"[[Ludwig-Maximilians-Universität München]]"
  from: 1825 till: 2006 color:PA text:"[[Universität Karlsruhe (TH)]]"
  from: 1828 till: 2006 color:PA text:"[[Technische Universität Dresden]]"
  from: 1829 till: 2006 color:PA text:"[[Universität Stuttgart]]"
  from: 1833 till: 2006 color:PA text:"[[Universität Zürich]]"
  from: 1834 till: 2006 color:PA text:"[[Universität Bern]]"
  from: 1840 till: 2006 color:PA text:"[[Montanuniversität Leoben]]"
  from: 1840 till: 2006 color:PA text:"[[Technische Universität Delft]]"
  from: 1841 till: 2006 color:PA text:"[[Mozarteum|Mozarteum Salzburg]]"
  from: 1849 till: 2006 color:PA text:"[[Technische Universität Ostrava]]"
  from: 1855 till: 2006 color:PA text:"[[Eidgenössische Technische Hochschule Zürich]]"
  from: 1870 till: 2006 color:PA text:"[[RWTH Aachen]]"
  from: 1872 till: 2006 color:PA text:"[[Universität für Bodenkultur Wien]]"
  from: 1875 till: 1918 color:GP text:"[[Franz-Josephs-Universität Czernowitz]]"
  from: 1877 till: 2006 color:PA text:"[[Technische Universität Darmstadt]]"
  from: 1878 till: 2006 color:PA text:"[[Universität Stockholm]]"
  from: 1884 till: 2006 color:PA text:"[[Technische Universität Berlin]]"
  from: 1898 till: 2006 color:PA text:"[[Polytechnisches Institut Kiew]]"
  from: 1898 till: 2006 color:PA text:"[[Wirtschaftsuniversität Wien]]"
  from: 1902 till: 2006 color:PA text:"[[Università Bocconi|Università Commerciale Luigi Bocconi Mailand]]"
  from: 1914 till: 2006 color:PA text:"[[Johann Wolfgang Goethe-Universität Frankfurt]]"
  from: 1918 till: 2006 color:PA text:"[[Technische Universität Tallinn]]"
  from: 1919 till: 2006 color:PA text:"[[Universität Riga|Universitas Latviensis Riga]]"
  from: 1948 till: 2006 color:PA text:"[[Freie Universität Berlin]]"
  from: 1949 till: 1978 color:GP text:"[[Königstein im Taunus|Philosophisch-Theologische Hochschule Königstein]]"
  from: 1953 till: 2006 color:PA text:"[[Technische Universität Ilmenau]]"
  from: 1962 till: 2006 color:PA text:"[[Paris Lodron-Universität Salzburg]]"
  from: 1965 till: 2006 color:PA text:"[[Universität Bochum]]"
  from: 1966 till: 2006 color:PA text:"[[Universität Konstanz]]"
  from: 1966 till: 2006 color:PA text:"[[Johannes-Kepler-Universität Linz]]"
  from: 1968 till: 2006 color:PA text:"[[Universität Dortmund]]"
  from: 1969 till: 2006 color:PA text:"[[Universität Bielefeld]]"
  from: 1969 till: 2006 color:PA text:"[[Universität Siegen]]"
  from: 1969 till: 2003 color:GP text:"[[Universität Duisburg|Universität GH Duisburg]]"
  from: 1969 till: 2003 color:GP text:"[[Universität Essen|Universität GH Essen]]"
  from: 1969 till: 2006 color:PA text:"[[Universität Paderborn|Universität GH Paderborn]]"
  from: 1969 till: 2006 color:PA text:"[[Universität Wuppertal|Bergische Universität Wuppertal]]"
  from: 1970 till: 2006 color:PA text:"[[Universität Bremen]]"
  from: 1972 till: 2006 color:PA text:"[[Universität Düsseldorf|Heinrich-Heine-Universität Düsseldorf]]"
  from: 1974 till: 2006 color:PA text:"[[Universität Hagen|Fernuniversität Hagen]]"
  from: 1974 till: 2006 color:PA text:"[[Universität Osnabrück]]"
  from: 1980 till: 2006 color:PA text:"[[Katholische Universität Eichstätt-Ingolstadt]]"
  from: 1982 till: 2006 color:PA text:"[[Privatuniversität Witten/Herdecke]]"
  from: 1990 till: 2006 color:PA text:"[[Universität Koblenz-Landau]]"
  from: 1992 till: 2006 color:PA text:"[[Europa-Universität Viadrina|Europa-Universität Viadrina in Frankfurt (Oder)]]"
  from: 1993 till: 2006 color:PA text:"[[Otto-von-Guericke-Universität Magdeburg]]"
  from: 1994 till: 2006 color:PA text:"[[Universität Erfurt]]"
  from: 2003 till: 2006 color:PA text:"[[Universität Duisburg-Essen]]"
  from: 2004 till: 2006 color:PA text:"[[Medizinische Universität Innsbruck|Medizinische Universität Innsbruck]]"
  barset:skip
| Abuko | top next |
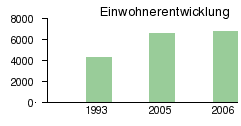
First version by Atamari on Tuesday, October 4, 2005, last update on Tuesday, July 11, 2006
ImageSize  = width:238 height:120
PlotArea = width:80% height:70% left:20% bottom:20%
AlignBars  = late

DateFormat = yyyy
Period     = from:0 till:8000
TimeAxis   = orientation:vertical
ScaleMajor = increment:2000 start:0

PlotData=
  color:drabgreen
  bar:1993 from:start till:4345
  bar:2005 from:start till:6572
  bar:2006 from:start till:6794

TextData=
  pos:(100,110) fontsize:M text:Einwohnerentwicklung
| Wassu | top next |

First version by Atamari on Tuesday, October 4, 2005, last update on Thursday, July 13, 2006
ImageSize  = width:238 height:120
PlotArea = width:80% height:70% left:20% bottom:20%
AlignBars  = late

DateFormat = yyyy
Period     = from:0 till:2500
TimeAxis   = orientation:vertical
ScaleMajor = increment:500 start:0

PlotData=
  color:drabgreen
  bar:1993 from:start till:1122
  bar:2005 from:start till:1380
  bar:2006 from:start till:1396

TextData=
  pos:(100,110) fontsize:M text:Einwohnerentwicklung
| Kombo-St. Mary Area | top next |

First version by Atamari on Sunday, April 17, 2005, last update on Wednesday, April 19, 2006
ImageSize  = width:350 height:120
PlotArea   = width:250 height:80 left:50 bottom:20
AlignBars  = late

DateFormat = yyyy
Period     = from:0 till:375000
TimeAxis   = orientation:vertical
ScaleMajor = unit:year increment:100000 start:0

PlotData=
  color:blue width:30
  bar:1963 from:start till:12208
  bar:1973 from:start till:39404
  bar:1983 from:start till:101504
  bar:1993 from:start till:228214
  bar:2003 from:start till:322410
  bar:2005 from:start till:345191
  bar:2006 from:start till:356843

TextData=
  pos:(20,110) fontsize:M text:
| Template:Zeitleiste DKP-Parteivorsitzende | top next |

First version by Antifaschist 666 on Monday, April 25, 2005, last update on Friday, May 27, 2005
ImageSize  = width:200 height:475
PlotArea   = width:70 height:455 left:40 bottom:10
Colors =
  id:lightyellow value:rgb(1,1,0.8)

DateFormat = yyyy
Period     = from:1968 till:2005
TimeAxis   = orientation:vertical
ScaleMajor = unit:year increment:2 start:1968
BackgroundColors = canvas:white

Define $dx = 20 # shift text to right side of bar

PlotData =
  bar:Chairmen color:red width:25 mark:(line,white) align:left fontsize:S

  from:start till:1973 shift:($dx,-5)   text:[[Kurt Bachmann]]
  from:1973  till:1990 shift:($dx,-1)   text:[[Herbert Mies]]
  from:1990  till:end shift:($dx,0)     text:[[Heinz Stehr]]
| Template:Pro DM Wahlergebnisse | top next |

First version by Antifaschist 666 on Tuesday, April 26, 2005, last update on Saturday, June 17, 2006
ImageSize  = width:210 height:450
PlotArea   = width:50 height:430 left:40 bottom:10
Colors =
  id:lightyellow value:rgb(1,1,0.8)

DateFormat = yyyy
Period     = from:1997 till:2005
TimeAxis   = orientation:vertical
ScaleMajor = unit:year increment:1 start:1998
BackgroundColors = canvas:white

Define $dx = 20 # shift text to right side of bar

PlotData =
  bar:Chairmen color:orange width:25 mark:(line,blue) align:left fontsize:S


  from:1998  till:1998 shift:($dx,-5) text:[[Mecklenburg-Vorpommern|Mecklenburg-V.]] 1,4%~Bundestagswahl 0,9%
  from:1999  till:1999 shift:($dx,0)  text:[[Sachsen]] 2,1%
  from:2001  till:2001 shift:($dx,0)  text:[[Hamburg]] 0,2%
  from:2002  till:2002 shift:($dx,0)  text:[[Sachsen-Anhalt]] 0,4%
  from:2004  till:2004 shift:($dx,0)  text:[[Hamburg]] 3,1%
  from:2005  till:2005 shift:($dx,0)  text:[[Bundestagswahl 2005|Bundestagswahl]] 0,02%
| Schloßstraße (Steglitz) | top next |

First version by 84.191.29.17 on Monday, August 8, 2005, last update on Friday, December 23, 2005
ImageSize = width:480 height:805
PlotArea = width:180 height:700 left:160 bottom:5
Legend          = columns:3 left:140 top:770 columnwidth:110

DateFormat = yyyy
Period     = from:0 till:46
TimeAxis   = orientation:vertical

Colors=
  id:gastronomie value:rgb(1,0,0) legend:Gastronomie
  id:technik value:rgb(0,1,0) legend:Technik
  id:kleidung value:rgb(0.5,0.5,1) legend:Textilien
  id:lebensmittel value:rgb(1,1,0.5) legend:Lebensmittel
  id:dienstleistung value:rgb(0,1,1) legend:Dienstleistung
  id:kaufhaus value:rgb(1,0,1) legend:Kaufhaus
  id:grau value:rgb(0.5,0.5,0.5)
  id:weiß value:rgb(1,1,1)
  id:sonstiges value:rgb(0.7,0.7,0.7) legend:Sonstiges

BackgroundColors = bars:grau

PlotData =
  bar: links width:25 align:right fontsize:S shift:(13,-4)
  from:45 till:46 color:grau fontsize:XS text:"Albrechtstraße" shift:(-30,-5)
  from:44 till:45 color:grau fontsize:XS text:"Hermann-Ehlers-Platz" shift:(-30,-5)
  from:43 till:44 color:grau
  from:42 till:43 color:dienstleistung text:"Deutsche Bank      88 "
  from:41 till:42 color:sonstiges  text:"?         "
  from:40 till:41 color:sonstiges  text:"?         "
  from:39 till:40 color:sonstiges  text:"?         "
  from:38 till:39 color:sonstiges  text:"?         "
  from:37 till:38 color:sonstiges  text:"?         "
  from:36 till:37 color:sonstiges  text:"?         "
  from:35 till:36 color:sonstiges  text:"?      97 "
  from:34 till:35 color:grau fontsize:XS text:"Kieler Straße" shift:(-30,-5)
  from:33 till:34 color:lebensmittel  text:"Reichelt         "
  from:32 till:33 color:sonstiges  text:"?         "
  from:31 till:32 color:sonstiges  text:"?         "
  from:30 till:31 color:grau fontsize:XS text:"Deitmerstraße" shift:(-30,-5)
  from:29 till:30 color:sonstiges  text:"?         "
  from:28 till:29 color:sonstiges  text:"?         "
  from:27 till:28 color:sonstiges  text:"?         "
  from:26 till:27 color:sonstiges  text:"?         "
  from:25 till:26 color:sonstiges  text:"?         "
  from:24 till:25 color:grau fontsize:XS text:"Hubertusstraße" shift:(-30,-5)
  from:23 till:24 color:technik  text:"O2         "
  from:22 till:23 color:sonstiges  text:"?         "
  from:21 till:22 color:sonstiges  text:"Saturn, Hugendubel, ...     110 "
  from:20 till:21 color:kaufhaus text:"WerkenSpielenSchenken     110b"
  from:19 till:20 color:sonstiges  text:"?     111 "
  from:18 till:19 color:lebensmittel  text:"Hussel         "
  from:17 till:18 color:sonstiges  text:"?         "
  from:16 till:17 color:sonstiges  text:"?         "
  from:15 till:16 color:sonstiges  text:"?         "
  from:14 till:15 color:sonstiges  text:"?         "
  from:13 till:14 color:sonstiges  text:"?         "
  from:12 till:13 color:gastronomie  text:"McDonalds         "
  from:11 till:12 color:gastronomie  text:"Asia Fast Food         "
  from:10 till:11 color:sonstiges  text:"?         "
  from:9 till:10 color:kleidung  text:"Red Green         "
  from:8 till:9 color:grau fontsize:XS text:"Feuerbachstraße" shift:(-30,-5)
  from:7 till:8 color:kleidung  text:"Ansons, Peek&Cloppenburg     120 "
  from:6 till:7 color:sonstiges  text:"?         "
  from:5 till:6 color:sonstiges  text:"?         "
  from:4 till:5 color:sonstiges  text:"?         "
  from:3 till:4 color:sonstiges  text:"?         "
  from:2 till:3  color:sonstiges  text:"?         "
  from:1 till:2 color:kleidung  text:"Übergrößen     130 "
  from:0 till:1 color:grau fontsize:XS text:"Schöneberger Straße" shift:(-30,-5)

  bar:s1 width:50
  from:0 till:46 color:grau
  bar:i width:5
  from:0 till:3 color:grau
  from:3 till:10 color:weiß
  from:10 till:17 color:grau
  from:17 till:24 color:weiß
  from: 24 till:31 color:grau
  from: 31 till:38 color:weiß
  from: 38 till:45 color:grau
  from:45 till:46 color:weiß
  bar:s2 width:50
  from:0 till:46 color:grau

  bar:rechts width:25 align:left fontsize:S shift:(-5,-4)
  from:45 till:46 color:grau fontsize:XS text:"Grunewaldstraße" shift:(30,-5)
  from:44 till:45 color:sonstiges text:"37      Rathaus Steglitz"
  from:43 till:44 color:sonstiges text:"35      ?"
  from:42 till:43 color:sonstiges text:"34      ?"
  from:41 till:42 color:sonstiges text:"33      ?"
  from:40 till:41 color:sonstiges text:"32      ?"
  from:39 till:40 color:sonstiges text:"31      ?"
  from:38 till:39 color:grau fontsize:XS text:"Muthesiusstraße" shift:(30,-5)
  from:37 till:38 color:sonstiges text:"30      ?"
  from:36 till:37 color:sonstiges text:"29      ?"
  from:35 till:36 color:sonstiges text:"28      ?"
  from:34 till:35 color:sonstiges text:"27      ?"
  from:33 till:34 color:grau fontsize:XS text:"Zimmermannstraße" shift:(30,-5)
  from:32 till:33 color:sonstiges text:"26      ?"
  from:31 till:32 color:sonstiges text:"25      ?"
  from:30 till:31 color:sonstiges text:"24      ?"
  from:29 till:30 color:sonstiges text:"23      ?"
  from:28 till:29 color:sonstiges text:"22      ?"
  from:27 till:28 color:sonstiges text:"21      ?"
  from:26 till:27 color:grau fontsize:XS text:"Ahornstraße" shift:(30,-5)
  from:25 till:26 color:kaufhaus text:"20      Woolworth"
  from:24 till:25 color:sonstiges text:"19      Tchibo, Apotheke"
  from:23 till:24 color:dienstleistung text:"18      Hair Broker"
  from:22 till:23 color:kleidung text:"17      C&A"
  from:21 till:22 color:grau  fontsize:XS text:"Schildhornstraße <-" shift:(30,-5)
  from:20 till:21 color:gastronomie text:"16      Bierpinsel"
  from:19 till:20 color:grau  fontsize:XS text:"Schildhornstraße ->" shift:(30,-5)
  from:18 till:19 color:kaufhaus text:"15      "
  from:17 till:18 color:kaufhaus text:" "
  from:16 till:17 color:kaufhaus text:" bis      Wertheim" shift:(-15,0)
  from:15 till:16 color:kaufhaus text:" "
  from:14 till:15 color:kaufhaus text:"1"
  from:13 till:14 color:grau fontsize:XS text:"Treitschkestraße" shift:(30,-5)
  from:12 till:13 color:kaufhaus text:"10      "
  from:11 till:12 color:kaufhaus text:" bis      Karstadt" shift:(-15,-10)
  from:10 till:11 color:kaufhaus text:" "
  from:9 till:10 color:kaufhaus text:" 7      "
  from:8 till:9 color:grau fontsize:XS text:"Markelstraße" shift:(30,-5)
  from:7 till:8 color:gastronomie text:" 6      Orsay, Fleischer"
  from:6 till:7 color:dienstleistung text:" 5      Bewag"
  from:5 till:6 color:grau fontsize:XS text:"Gutsmuthsstraße" shift:(30,-5)
  from:4 till:5 color:kaufhaus text:"4      "
  from:3 till:4 color:kaufhaus text:"bis      Forum Steglitz" shift:(-12,-11)
  from:2 till:3 color:kaufhaus text:"       "
  from:1 till:2 color:kaufhaus  text:"1      "
  from:0 till:1 color:grau fontsize:XS text:"Bornstraße" shift:(30,-5)
| Mansa Konko | top next |

First version by Atamari on Saturday, April 30, 2005, last update on Thursday, July 13, 2006
ImageSize  = width:238 height:120
PlotArea = width:80% height:70% left:20% bottom:20%
AlignBars  = late

DateFormat = yyyy
Period     = from:0 till:3000
TimeAxis   = orientation:vertical
ScaleMajor = increment:1000 start:0

PlotData=
  color:drabgreen
  bar:1983 from:start till:1816
  bar:1993 from:start till:1978
  bar:2005 from:start till:2187
  bar:2006 from:start till:2429

TextData=
  pos:(100,110) fontsize:M text:Einwohnerentwicklung
| Tanji | top next |

First version by Atamari on Sunday, May 1, 2005, last update on Thursday, July 13, 2006
ImageSize  = width:238 height:120
PlotArea = width:80% height:70% left:20% bottom:20%
AlignBars  = late

DateFormat = yyyy
Period     = from:0 till:7500
TimeAxis   = orientation:vertical
ScaleMajor = increment:2500 start:0

PlotData=
  color:drabgreen
  bar:1983 from:start till:1632
  bar:1993 from:start till:4623
  bar:2005 from:start till:5492
  bar:2006 from:start till:5693

TextData=
  pos:(100,110) fontsize:M text:Einwohnerentwicklung
| Steyrtalbahn | top next |

First version by Dralon ? on Sunday, May 29, 2005, last update on Wednesday, May 24, 2006
ImageSize  = width:320 height:440
PlotArea   = left:50 right:0 bottom:10 top:10
AlignBars  = early

DateFormat = yyyy
Period     = from:0 till:40000
TimeAxis   = orientation:vertical order:reverse
ScaleMajor = unit:year increment:50000 start:0
ScaleMinor = unit:year increment:10000 start:0

# there is no automatic collision detection,
# so shift texts up or down manually to avoid overlap

Define $dx = 20 # shift text to right side of bar
Define $dy = -4 # shift text down

Colors =
 id:strecke    value:coral       legend:Strecke_2005_noch_vorhanden
 id:abgetragen value:pink        legend:Strecke_abgetragen
 id:hst        value:lightpurple legend:Haltestelle
 id:bf         value:purple      legend:Bahnhof

Legend = orientation:vertical position:bottom

PlotData=
 bar:Steyrtalbahn color:abgetragen width:25 align:left fontsize:S from:0     till:2700
 at:0      shift:($dx,$dy) mark:(line, bf)  fontsize:M text:Garsten (km 0,0)
 at:1200   shift:($dx,$dy) mark:(line, hst) fontsize:S text:Sarning (km 1,2)
 bar:Steyrtalbahn color:strecke    width:25 align:left fontsize:M from:2700  till:19200
 at:2700   shift:($dx,$dy) mark:(line, bf)  fontsize:M text:Steyr Lokalbahnhof (km 2,7)
 at:3700   shift:($dx,$dy) mark:(line, hst) fontsize:S text:Unterhimmel-Christkindl (km 3,7)
 at:5200   shift:($dx,$dy) mark:(line, hst) fontsize:S text:Rosenegg (km 5,2)
 at:6700   shift:($dx,$dy) mark:(line, bf)  fontsize:M text:Pergern (km 6,7)
 at:9300   shift:($dx,$dy) mark:(line, hst) fontsize:S text:Neuzeug (km 9,3)
 at:10500  shift:($dx,$dy) mark:(line, hst) fontsize:S text:Letten (km 10,5)
 at:12100  shift:($dx,$dy) mark:(line, bf)  fontsize:M text:Aschach (km 12,1)
 at:14400  shift:($dx,$dy) mark:(line, hst) fontsize:S text:Sommerhubermühle (km 14,4)
 at:17900  shift:($dx,$dy) mark:(line, hst) fontsize:S text:Waldneukirchen (km 17,9)
 at:19200  shift:($dx,$dy) mark:(line, bf)  fontsize:M text:Grünburg (km 19,2)
 bar:Steyrtalbahn color:abgetragen width:25 align:left fontsize:S from:19200 till:39800
 at:22200  shift:($dx,$dy) mark:(line, bf)  fontsize:M text:Unterhaus (km 22,2)
 at:22900  shift:($dx,-6) mark:(line, hst) fontsize:S text:Haunoldmühle (km 22,9)
 at:28100  shift:($dx,$dy) mark:(line, bf)  fontsize:M text:Leonstein (km 28,1)
 at:34300  shift:($dx,$dy) mark:(line, hst) fontsize:S text:Steyrdurchbruch (km 34,3)
 at:30200  shift:($dx,$dy) mark:(line, bf)  fontsize:M text:Molln (km 30,2)
 at:31700  shift:($dx,$dy) mark:(line, hst) fontsize:S text:Agonitz (km 31,7)
 at:39800  shift:($dx,$dy) mark:(line, bf)  fontsize:M text:Klaus (km 39,8)
| Steyrtalbahn | top next |

First version by Dralon ? on Sunday, May 29, 2005, last update on Wednesday, May 24, 2006
ImageSize  = width:320 height:220
PlotArea   = left:50 right:0 bottom:10 top:10
AlignBars  = early

DateFormat = yyyy
Period     = from:0 till:20000
TimeAxis   = orientation:vertical order:reverse
ScaleMajor = unit:year increment:50000 start:0
ScaleMinor = unit:year increment:10000 start:0

# there is no automatic collision detection,
# so shift texts up or down manually to avoid overlap

Define $dx = 20 # shift text to right side of bar
Define $dy = -4 # shift text down

Colors =
 id:strecke    value:coral       legend:Strecke_2005_noch_vorhanden
 id:abgetragen value:pink        legend:Strecke_abgetragen
 id:hst        value:lightpurple legend:Haltestelle
 id:bf         value:purple      legend:Bahnhof

Legend = orientation:vertical position:bottom

PlotData=
 bar:Steyrtalbahn color:abgetragen width:25 align:left from:0 till:15400
 at:0      shift:($dx,$dy) mark:(line, bf)  fontsize:M text:Pergern (km 0,0)
 at:2100   shift:($dx,$dy) mark:(line, bf)  fontsize:M text:Sierninghofen (km 2,1)
 at:3100   shift:($dx,$dy) mark:(line, hst) fontsize:S text:Wahlmühle (km 3,1)
 at:4800   shift:($dx,$dy) mark:(line, bf)  fontsize:M text:Sierning (km 4,8)
 at:6900   shift:($dx,$dy) mark:(line, hst) fontsize:S text:Oberwallern  (km 6,9)
 at:9500   shift:($dx,$dy) mark:(line, hst) fontsize:S text:Steinersdorf (km 9,5)
 at:11100  shift:($dx,$dy) mark:(line, bf)  fontsize:M text:Waldneukirchen-Adlwang (km 11,1)
 at:12600  shift:($dx,$dy) mark:(line, hst) fontsize:S text:St. Blasien (Mangstmühle) (km 12,6)
 at:13800  shift:($dx,$dy) mark:(line, hst) fontsize:S text:Kammerhub (km 13,8)
 at:15400  shift:($dx,$dy) mark:(line, bf)  fontsize:M text:Bad Hall (km 15,4)
| Template:Linkspartei vorsitzende | top next |

First version by 139.14.17.201 on Friday, May 6, 2005, last update on Tuesday, July 5, 2005
ImageSize  = width:210 height:320
PlotArea   = width:50 height:300 left:40 bottom:10
Colors =
  id:lightyellow value:rgb(1,1,0.8)

DateFormat = yyyy
Period     = from:1990 till:2005
TimeAxis   = orientation:vertical
ScaleMajor = unit:year increment:1 start:1990
BackgroundColors = canvas:white

Define $dx = 20 # shift text to right side of bar

PlotData =
  bar:Chairmen color:red width:25 mark:(line,white) align:left fontsize:S

  from:start till:1993 shift:($dx,-5)   text:[[Gregor Gysi]]
  from:1993  till:2000 shift:($dx,0)    text:[[Lothar Bisky]]
  from:2000  till:2003 shift:($dx,0)    text:[[Gabi Zimmer]]
  from:2003  till:end shift:($dx,0)    text:[[Lothar Bisky]]
| Sarcelles | top next |

Initial version by Ttog on Thursday, July 20, 2006
Colors=
  id:lightgrey value:gray(0.9)
  id:darkgrey  value:gray(0.7)
  id:sfondo value:rgb(1,1,1)
  id:barra value:rgb(0.6,0.7,0.8)

ImageSize  = width:500 height:323
PlotArea   = left:50 bottom:50 top:30 right:30
DateFormat = x.y
Period     = from:0 till:60000
TimeAxis   = orientation:vertical
AlignBars  = justify
ScaleMajor = gridcolor:darkgrey increment:5000 start:0
ScaleMinor = gridcolor:lightgrey increment:1000 start:0
BackgroundColors = canvas:sfondo

BarData=
  bar:1921 text:1921
  bar:1936 text:1936
  bar:1954 text:1954
  bar:1962 text:1962
  bar:1968 text:1968
  bar:1975 text:1975
  bar:1982 text:1982
  bar:1990 text:1990
  bar:1999 text:1999

PlotData=
  color:barra width:30 align:left

  bar:1921 from:0 till: 3364
  bar:1936 from:0 till: 7083
  bar:1954 from:0 till: 8397
  bar:1962 from:0 till: 35800
  bar:1968 from:0 till: 51674
  bar:1975 from:0 till: 55007
  bar:1982 from:0 till: 53630
  bar:1990 from:0 till: 56833
  bar:1999 from:0 till: 57871

PlotData=

  bar:1921 at: 3364 fontsize:S text: 3.364 shift:(-8,5)
  bar:1936 at: 7083 fontsize:S text: 7.083 shift:(-10,5)
  bar:1954 at: 8397 fontsize:S text: 8.397 shift:(-10,5)
  bar:1962 at: 35800 fontsize:S text: 35.800 shift:(-10,5)
  bar:1968 at: 51674 fontsize:S text: 51.674 shift:(-10,5)
  bar:1975 at: 55007 fontsize:S text: 55.007 shift:(-10,5)
  bar:1982 at: 53630 fontsize:S text: 53.630 shift:(-10,5)
  bar:1990 at: 56833 fontsize:S text: 56.833 shift:(-10,5)
  bar:1999 at: 57871 fontsize:S text: 57.871 shift:(-10,5)

TextData=
  fontsize:S pos:(30,20)
  text:Quelle INSEE
| Template:Zeitleiste DKP-Wahlergebnisse | top next |

First version by Zahnstein on Saturday, May 21, 2005, last update on Sunday, May 22, 2005
ImageSize  = width:235 height:1920
PlotArea   = width:75 height:1900 left:40 bottom:10
Colors =
  id:lightyellow value:rgb(1,1,0.8)

DateFormat = yyyy
Period     = from:1969 till:2005
TimeAxis   = orientation:vertical
ScaleMajor = unit:year increment:1 start:1970
BackgroundColors = canvas:white

Define $dx = 20 # shift text to right side of bar

PlotData =
  bar:Chairmen color:orange width:25 mark:(line,red) align:left fontsize:S

  from:1970 till:1970 shift:($dx,-5) text:[[Hamburg]] 1,7%~[[Bayern]] 0,4%~[[Hessen]] 1,2%~[[Saarland]] 2,7%~[[Niedersachsen]] 0,4%~[[Nordrhein-Westfalen]] 0,9%~[[Hessen]] 1,2%
  from:1971 till:1971 shift:($dx,-5) text:[[Bremen]] 3,1%~[[Schleswig-Holstein]] 0,4%~[[Rheinland-Pfalz]] 0,9%
  from:1972 till:1972 shift:($dx,-5) text:[[Bundestagswahl 1972]] 0,3%~[[Baden-Württemberg]] 0,5%
  from:1974 till:1974 shift:($dx,-1) text:[[Bayern]] 0,4%~[[Hamburg]] 2,2%~[[Hessen]] 0,9%~[[Niedersachsen]] 0,4%
  from:1975 till:1975 shift:($dx,-1) text:[[Bremen]] 2,1%~[[Nordrhein-Westfalen]] 0,5%~[[Saarland]] 1,0%~[[Schleswig-Holstein]] 0,4%~[[Rheinland-Pfalz]] 0,5%
  from:1976 till:1976 shift:($dx,-1) text:[[Bundestagswahl 1976]] 0,3%~[[Baden-Württemberg]] 0,4%
  from:1978 till:1978 shift:($dx,-1) text:[[Bayern]] 0,3%~[[Hamburg]] 1,0%~[[Hessen]] 0,4%~[[Niedersachsen]] 0,3%
  from:1979 till:1979 shift:($dx,0)  text:Europawahl 0,4%~[[Bremen]] 0,8%~[[Schleswig-Holstein]] 0,2%~[[Rheinland-Pfalz]] 0,4%
  from:1980 till:1980 shift:($dx,0)  text:[[Bundestagswahl 1980]] 0,2%~[[Nordrhein-Westfalen]] 0,3%~[[Saarland]] 0,5%~[[Baden-W%C3%BCrttemberg|Baden-Württemberg]] 0,3%
  from:1982 till:1982 shift:($dx,-1) text:[[Bayern]] 0,2%~[[Hamburg]] I 0,6%~[[Hamburg]] II 0,4%~[[Hessen]] 0,4%~[[Niedersachsen]] 0,3%
  from:1983 till:1983 shift:($dx,0)  text:[[Bundestagswahl 1983]] 0,2%~[[Schleswig-Holstein]] 0,1%~[[Rheinland-Pfalz]] 0,2%~[[Hessen]] 0,3%
  from:1984 till:1984 shift:($dx,-1) text:[[Baden-W%C3%BCrttemberg|Baden-Württemberg]] 0,3%
  from:1985 till:1985 shift:($dx,-1) text:[[Saarland]] 0,3%
  from:1986 till:1986 shift:($dx,-1) text:[[Hamburg]] 0,2%
  from:1987 till:1987 shift:($dx,-1) text:[[Bremen]] 0,6%~[[Rheinland-Pfalz]] 0,1%~[[Hessen]] 0,3%
  from:1988 till:1988 shift:($dx,0)  text:[[Schleswig-Holstein]] 0,1%
  from:1989 till:1989 shift:($dx,0)  text:Europawahl 0,2%
  from:1990 till:1990 shift:($dx,0)  text:[[Saarland]] 0,1%
  from:1991 till:1991 shift:($dx,0)  text:[[Hamburg]] 0,7%
  from:1995 till:1995 shift:($dx,0)  text:[[Hessen]] 0,1%~[[Nordrhein-Westfalen]] 0,1%
  from:1996 till:1996 shift:($dx,0)  text:[[Baden-Württemberg]] 0,0%~[[Schleswig-Holstein]] 0,0%
  from:1998  till:1998 shift:($dx,0)  text:[[Bayern]] 0,0%~[[Niedersachsen]] 0,2%
  from:1999  till:1999 shift:($dx,0)  text:[[Hessen]] 0,1%
  from:2000  till:2000 shift:($dx,0)  text:[[Nordrhein-Westfalen]] 0,0%
  from:2001  till:2001 shift:($dx,0)  text:[[Baden-W%C3%BCrttemberg|Baden-Württemberg]] 0,0%~[[Berlin]] 0,1%
  from:2002  till:2002 shift:($dx,0)  text:[[Sachsen-Anhalt]] 0,1%
  from:2003  till:2003 shift:($dx,0)  text:[[Hessen]] 0,2%
  from:2004  till:2004 shift:($dx,0)  text:Europawahl 0,1%~[[Brandenburg]] 0,2%
  from:2005  till:2005 shift:($dx,0)  text:[[Schleswig-Holstein]] 0,1%
| Die Grünen (Österreich) | top next |

First version by Friedrich.Kromberg on Tuesday, July 6, 2004, last update on Wednesday, April 6, 2005
ImageSize  = width:450 height:500
PlotArea   = width:400  height:440 left:50 bottom:50
Legend    = columns:3 left:50 top:25 columnwidth:65

DateFormat = yyyy
Period     = from:1986 till:2004
TimeAxis   = orientation:vertical
ScaleMajor = unit:year increment:2 start:1986

# there is no automatic collision detection,
# so shift texts up or down manually to avoid overlap

Colors=
  id:Grüne  value:green legend:Grüne
  id:SPÖ  value:red    legend:SPÖ
  id:ÖVP  value:gray(0.25) legend:ÖVP

Define $dx = 25 # shift text to right side of bar
Define $dy = -4 # adjust height

PlotData=
  width:25 mark:(line,white) align:left fontsize:S shift:($dx,$dy)

  bar:BS

  color:Grüne
  from:1986  till:1988 text:[[Freda Meissner-Blau]]
  from:1988  till:1992 text:[[Johannes Voggenhuber]]
  from:1992  till:1994 text:[[Peter Pilz]]
  from:1994  till:1995 text:[[Madeleine Petrovic]]
  from:1995  till:1997 text:[[Christoph Chorherr]]
  from:1997  till:end  text:[[Alexander Van der Bellen]]

  bar:BReg

  color:SPÖ
  from:1986  till:1987 text:Vranitzky I
  from:1987  till:1990 text:Vranitzky II
  from:1990  till:1994 text:Vranitzky III
  from:1994  till:1996 text:Vranitzky IV
  from:1996  till:1997 text:Vranitzky V
  from:1997  till:2000 text:Klima

  color:ÖVP
  from:2000  till:2003 text:Schüssel I
  from:2003  till:end  text:Schüssel II
| Central River Division | top next |

First version by Atamari on Saturday, May 28, 2005, last update on Wednesday, April 19, 2006
ImageSize  = width:350 height:120
PlotArea   = width:250 height:80 left:50 bottom:20
AlignBars  = late

DateFormat = yyyy
Period     = from:0 till:250000
TimeAxis   = orientation:vertical
ScaleMajor = unit:year increment:50000 start:0

PlotData=
  color:blue width:30
  bar:1963 from:start till:64755
  bar:1973 from:start till:101901
  bar:1983 from:start till:126004
  bar:1993 from:start till:156021
  bar:2003 from:start till:185897
  bar:2005 from:start till:190616
  bar:2006 from:start till:192916

TextData=
  pos:(20,110) fontsize:M text:
| Lower River Division | top next |

First version by Atamari on Saturday, May 28, 2005, last update on Wednesday, April 19, 2006
ImageSize  = width:350 height:120
PlotArea   = width:250 height:80 left:50 bottom:20
AlignBars  = late

DateFormat = yyyy
Period     = from:0 till:100000
TimeAxis   = orientation:vertical
ScaleMajor = unit:year increment:20000 start:0

PlotData=
  color:blue width:30
  bar:1963 from:start till:34227
  bar:1973 from:start till:42447
  bar:1983 from:start till:55263
  bar:1993 from:start till:65146
  bar:2003 from:start till:72546
  bar:2005 from:start till:73474
  bar:2006 from:start till:73890

TextData=
  pos:(20,110) fontsize:M text:
| Upper River Division | top next |

First version by Atamari on Saturday, May 28, 2005, last update on Wednesday, April 19, 2006
ImageSize  = width:350 height:120
PlotArea   = width:250 height:80 left:50 bottom:20
AlignBars  = late

DateFormat = yyyy
Period     = from:0 till:250000
TimeAxis   = orientation:vertical
ScaleMajor = unit:year increment:50000 start:0

PlotData=
  color:blue width:30
  bar:1963 from:start till:58049
  bar:1973 from:start till:86167
  bar:1983 from:start till:111388
  bar:1993 from:start till:155059
  bar:2003 from:start till:183033
  bar:2005 from:start till:187972
  bar:2006 from:start till:190353

TextData=
  pos:(20,110) fontsize:M text:
| North Bank Division | top next |

First version by Atamari on Saturday, May 28, 2005, last update on Wednesday, April 19, 2006
ImageSize  = width:350 height:120
PlotArea   = width:250 height:80 left:50 bottom:20
AlignBars  = late

DateFormat = yyyy
Period     = from:0 till:250000
TimeAxis   = orientation:vertical
ScaleMajor = unit:year increment:50000 start:0

PlotData=
  color:blue width:30
  bar:1963 from:start till:63045
  bar:1973 from:start till:93388
  bar:1983 from:start till:112225
  bar:1993 from:start till:156462
  bar:2003 from:start till:172806
  bar:2005 from:start till:175564
  bar:2006 from:start till:176793

TextData=
  pos:(20,110) fontsize:M text:
| Western Division | top next |

First version by Atamari on Saturday, May 28, 2005, last update on Wednesday, April 19, 2006
ImageSize  = width:350 height:120
PlotArea   = width:250 height:80 left:50 bottom:20
AlignBars  = late

DateFormat = yyyy
Period     = from:0 till:500000
TimeAxis   = orientation:vertical
ScaleMajor = unit:year increment:100000 start:0

PlotData=
  color:blue width:30
  bar:1963 from:start till:55393
  bar:1973 from:start till:91013
  bar:1983 from:start till:137245
  bar:1993 from:start till:234917
  bar:2003 from:start till:392987
  bar:2005 from:start till:428104
  bar:2006 from:start till:446680

TextData=
  pos:(20,110) fontsize:M text:
| Greater Banjul Area | top next |
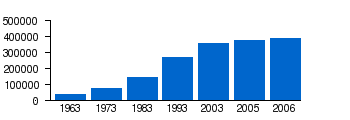
First version by Atamari on Saturday, May 28, 2005, last update on Wednesday, April 19, 2006
ImageSize  = width:350 height:120
PlotArea   = width:250 height:80 left:50 bottom:20
AlignBars  = late

DateFormat = yyyy
Period     = from:0 till:500000
TimeAxis   = orientation:vertical
ScaleMajor = unit:year increment:100000 start:0

PlotData=
  color:blue width:30
  bar:1963 from:start till:40017
  bar:1973 from:start till:78185
  bar:1983 from:start till:145612
  bar:1993 from:start till:270540
  bar:2003 from:start till:357238
  bar:2005 from:start till:379780
  bar:2006 from:start till:391231

TextData=
  pos:(20,110) fontsize:M text:
| Zellingen | top next |

Initial version by HAH ? on Wednesday, May 31, 2006
Colors=
  id:lightgrey value:gray(0.9)
  id:darkgrey  value:gray(0.7)
  id:sfondo value:rgb(1,1,1)
  id:barra value:rgb(0.6,0.7,0.8)

ImageSize  = width:350 height:200
PlotArea   = left:50 bottom:50 top:30 right:30
DateFormat = x.y
Period     = from:0 till:7000
TimeAxis   = orientation:vertical
AlignBars  = justify
ScaleMajor = gridcolor:darkgrey increment:1000 start:0
ScaleMinor = gridcolor:lightgrey increment:250 start:0
BackgroundColors = canvas:sfondo

BarData=
  bar:1970 text:1970
  bar:1987 text:1987
  bar:2000 text:2000
  bar:2005 text:2005

PlotData=
  color:barra width:40 align:center

  bar:1970 from:0 till: 5451
  bar:1987 from:0 till: 5651
  bar:2000 from:0 till: 6514
  bar:2005 from:0 till: 6585

PlotData=

  bar:1970 at: 5451 fontsize:S text: 5.451 fontsize:M shift:(2,5)
  bar:1987 at: 5651 fontsize:S text: 5.651 fontsize:M shift:(2,5)
  bar:2000 at: 6514 fontsize:S text: 6.514 fontsize:M shift:(2,5)
  bar:2005 at: 6585 fontsize:S text: 6.585 fontsize:M shift:(2,5)

TextData=
  fontsize:M pos:(20,20)
  text:"Einwohner auf dem Gebiet der Gemeinde Zellingen"
| Zellingen | top next |

Initial version by HAH ? on Wednesday, May 31, 2006
ImageSize = width:600 height:auto barincrement:25
PlotArea  = top:10 bottom:30 right:130 left:20
AlignBars = early

DateFormat = yyyy
Period     = from:1970 till:2020
TimeAxis   = orientation:horizontal
ScaleMajor = unit:year increment:10 start:1970

Colors     =
  id:canvas value:rgb(0.97,0.97,0.97)
  id:PA     value:green

Backgroundcolors = canvas:canvas

BarData =
  barset:Bürgermeister

PlotData=
  width:10 align:left fontsize:M shift:(5,-4) anchor:till
  barset:Bürgermeister

  from:1972 till:1990 color:PA text:"[[]]Valentin Bauer ( [[1972]] - [[1990]] )"
  from:1990 till:1996 color:PA text:"[[]]Bernd Oestemer ( [[1990]] - [[1996]] )"
  from:1996 till:2006 color:PA text:"[[]]Karl Mühlbauer, CSU ( [[1996]] - heute )"
  barset:skip
| Template:Zeitleiste Windows-Versionen | top next |

First version by Tkarcher on Tuesday, May 31, 2005, last update on Sunday, July 2, 2006
ImageSize = width:800 height:142
PlotArea  = width:720 height:112 left:65 bottom:25
AlignBars = justify

Colors =
  id:16BIT      value:redorange
  id:16BITFADE1 value:orange
  id:16BITFADE2 value:lightorange
  id:9XLINIE    value:green
  id:9XLINIEFADE1 value:yellowgreen
  id:9XLINIEFADE2 value:limegreen
  id:NTLINIE    value:magenta
  id:CELINIE    value:skyblue
  id:black      value:black

Period     = from:1985.5 till:2006.5
TimeAxis   = orientation:horizontal
ScaleMajor = unit:year increment:2 start:1986
ScaleMinor = unit:year increment:1  start:1986

PlotData=
  align:left textcolor:black fontsize:8 mark:(line,black) width:28 shift:(3,1)

  bar:16-Bit color:16BIT
  from:1985.83 till:1994.83 mark:(line,16BIT)
  from:1994.83 till:1995.83 color:16BITFADE1 mark:(line,16BITFADE1)
  from:1995.83 till:1996.83 color:16BITFADE2 mark:(line,16BITFADE2)
  at:1985.83  text:1.0
  at:1987     text:Windows 2.0
  at:1990.33  text:Windows~3.0
  at:1992     text:Windows~3.1
  at:1993.83  text:Windows 3.11

  bar:9x-Linie color:9XLINIE
  from:1995 till:2001.83 mark:(line,9XLINIE)
  from:2001.83 till:2002.83 mark:(line,9XLINIEFADE1) color:9XLINIEFADE1
  from:2002.83 till:2003.83 mark:(line,9XLINIEFADE2) color:9XLINIEFADE2
  at:1995  text:Windows 95
  at:1998  text:Windows 98
  at:2000.83  text:Windows ME

  bar:NT-Linie color:NTLINIE
  from:1993.5 till:end
  at:1993.5  text:NT~3.1
  at:1994.67   text:NT~3.5
  at:1995.33  text:NT~3.51
  at:1996.5   text:Windows~NT 4.0
  at:1999.92   text:Windows~2000
  at:2001.58 text:Windows~XP
  at:2003.17 text:Windows~Server 2003

  bar:CE-Linie color:CELINIE
  from:1996.83  till:end
  at:1996.83 text:CE~1.0
  at:1997.67 text:Windows~CE 2.0
  at:2000.25 text:Windows~CE 3.0
  at:2002.17 text:CE~4.0
  at:2003.67 text:Mobile~2003
  at:2005.75 text:Mobile~5.0
| Schwanfeld | top next |

Initial version by HAH on Tuesday, May 30, 2006
Colors=
  id:lightgrey value:gray(0.9)
  id:darkgrey  value:gray(0.7)
  id:sfondo value:rgb(1,1,1)
  id:barra value:rgb(0.6,0.7,0.8)

ImageSize  = width:300 height:200
PlotArea   = left:50 bottom:50 top:30 right:30
DateFormat = x.y
Period     = from:0 till:2500
TimeAxis   = orientation:vertical
AlignBars  = justify
ScaleMajor = gridcolor:darkgrey increment:1000 start:0
ScaleMinor = gridcolor:lightgrey increment:250 start:0
BackgroundColors = canvas:sfondo

BarData=
  bar:1970 text:1970
  bar:1987 text:1987
  bar:2000 text:2000

PlotData=
  color:barra width:40 align:center

  bar:1970 from:0 till: 1402
  bar:1987 from:0 till: 1643
  bar:2000 from:0 till: 2035

PlotData=

  bar:1970 at: 1402 fontsize:S text: 1.402 fontsize:M shift:(2,5)
  bar:1987 at: 1643 fontsize:S text: 1.643 fontsize:M shift:(2,5)
  bar:2000 at: 2035 fontsize:S text: 2.035 fontsize:M shift:(2,5)

TextData=
  fontsize:S pos:(20,20)
  text:"Einwohner auf dem Gebiet der Gemeinde Schwanfeld"
| Sulzheim (Unterfranken) | top next |

Initial version by HAH on Tuesday, May 30, 2006
Colors=
  id:lightgrey value:gray(0.9)
  id:darkgrey  value:gray(0.7)
  id:sfondo value:rgb(1,1,1)
  id:barra value:rgb(0.6,0.7,0.8)

ImageSize  = width:300 height:200
PlotArea   = left:50 bottom:50 top:30 right:30
DateFormat = x.y
Period     = from:0 till:2500
TimeAxis   = orientation:vertical
AlignBars  = justify
ScaleMajor = gridcolor:darkgrey increment:1000 start:0
ScaleMinor = gridcolor:lightgrey increment:250 start:0
BackgroundColors = canvas:sfondo

BarData=
  bar:1970 text:1970
  bar:1987 text:1987
  bar:2000 text:2000

PlotData=
  color:barra width:40 align:center

  bar:1970 from:0 till: 1792
  bar:1987 from:0 till: 1764
  bar:2000 from:0 till: 2005

PlotData=

  bar:1970 at: 1792 fontsize:S text: 1.792 fontsize:M shift:(2,15)
  bar:1987 at: 1764 fontsize:S text: 1.764 fontsize:M shift:(2,16)
  bar:2000 at: 2005 fontsize:S text: 2.005 fontsize:M shift:(2,5)

TextData=
  fontsize:S pos:(20,20)
  text:"Einwohner auf dem Gebiet der Gemeinde Sulzheim"
| Üchtelhausen | top next |

Initial version by HAH on Sunday, May 28, 2006
Colors=
  id:lightgrey value:gray(0.9)
  id:darkgrey  value:gray(0.7)
  id:sfondo value:rgb(1,1,1)
  id:barra value:rgb(0.6,0.7,0.8)

ImageSize  = width:300 height:200
PlotArea   = left:50 bottom:50 top:30 right:30
DateFormat = x.y
Period     = from:0 till:4500
TimeAxis   = orientation:vertical
AlignBars  = justify
ScaleMajor = gridcolor:darkgrey increment:1000 start:0
ScaleMinor = gridcolor:lightgrey increment:250 start:0
BackgroundColors = canvas:sfondo

BarData=
  bar:1970 text:1970
  bar:1987 text:1987
  bar:2000 text:2000

PlotData=
  color:barra width:40 align:center

  bar:1970 from:0 till:3305
  bar:1987 from:0 till:3717
  bar:2000 from:0 till:4102

PlotData=

  bar:1970 at: 3305 fontsize:S text: 3.305 fontsize:M shift:(2,5)
  bar:1987 at: 3717 fontsize:S text: 3.717 fontsize:M shift:(2,5)
  bar:2000 at: 4102 fontsize:S text: 4.102 fontsize:M shift:(2,5)

TextData=
  fontsize:S pos:(20,20)
  text:"Einwohner auf dem Gebiet der Gemeinde Üchtelhausen"
| Wasserlosen | top next |
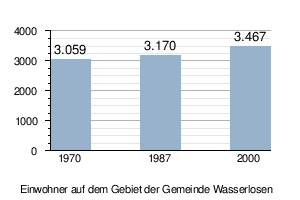
Initial version by HAH on Saturday, May 27, 2006
Colors=
  id:lightgrey value:gray(0.9)
  id:darkgrey  value:gray(0.7)
  id:sfondo value:rgb(1,1,1)
  id:barra value:rgb(0.6,0.7,0.8)

ImageSize  = width:300 height:200
PlotArea   = left:50 bottom:50 top:30 right:30
DateFormat = x.y
Period     = from:0 till:4000
TimeAxis   = orientation:vertical
AlignBars  = justify
ScaleMajor = gridcolor:darkgrey increment:1000 start:0
ScaleMinor = gridcolor:lightgrey increment:250 start:0
BackgroundColors = canvas:sfondo

BarData=
  bar:1970 text:1970
  bar:1987 text:1987
  bar:2000 text:2000

PlotData=
  color:barra width:40 align:center

  bar:1970 from:0 till: 3059
  bar:1987 from:0 till: 3170
  bar:2000 from:0 till: 3467

PlotData=

  bar:1970 at: 3059 fontsize:S text: 3.059 fontsize:M shift:(2,5)
  bar:1987 at: 3170 fontsize:S text: 3.170 fontsize:M shift:(2,5)
  bar:2000 at: 3467 fontsize:S text: 3.467 fontsize:M shift:(2,5)

TextData=
  fontsize:S pos:(20,20)
  text:"Einwohner auf dem Gebiet der Gemeinde Wasserlosen"
| Pyhrnbahn | top next |
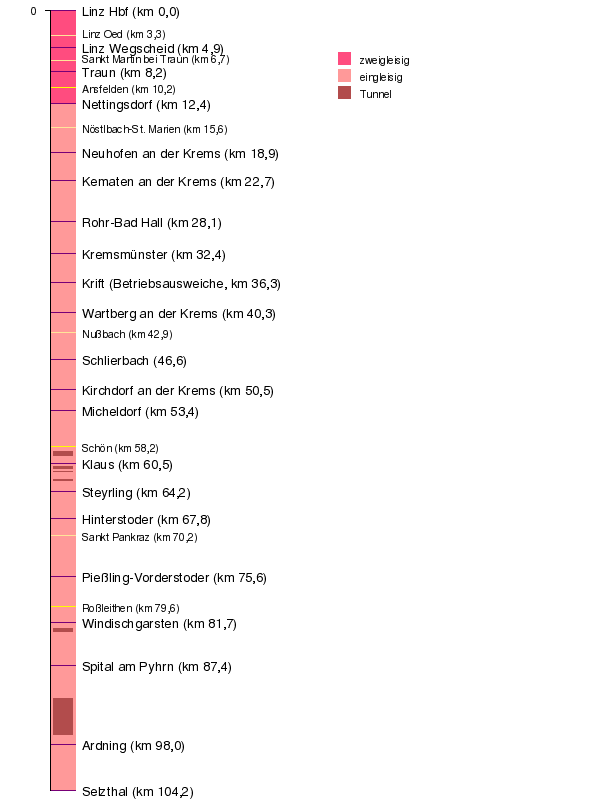
First version by Dralon on Sunday, June 5, 2005, last update on Wednesday, May 24, 2006
ImageSize  = width:600 height:800
PlotArea   = left:50 right:10 bottom:10 top:10
Legend     = columns:1 left:340 top:750 columnwidth:100
AlignBars  = early

DateFormat = yyyy
Period     = from:0 till:104233
TimeAxis   = orientation:vertical order:reverse
ScaleMajor = unit:year increment:200000 start:0
ScaleMinor = unit:year increment:200000 start:0

# there is no automatic collision detection,
# so shift texts up or down manually to avoid overlap

Define $dx  = 20 # shift text to right side of bar
Define $dyu = -3 # shift text down
Define $dy  = -6 # shift text down
Define $dyd = -9 # shift text down

Define $linebf   = mark:(line, bf)   fontsize:M
Define $linehst  = mark:(line, hst)  fontsize:S
Define $linehlst = mark:(line, hlst) fontsize:S

Colors =
 id:strecke2   value:magenta    legend:zweigleisig
 id:strecke    value:coral      legend:eingleisig
 id:tunnel     value:claret     legend:Tunnel
 id:hst        value:dullyellow # legend:Haltestelle
 id:hlst       value:yellow     # legend:Halte-_und_Ladestelle
 id:bf         value:purple     # legend:Bahnhof


PlotData=
 bar:Pyhrnbahn  color:strecke2 width:25 align:left fontsize:M from:0     till:12423
 bar:Pyhrnbahn  color:strecke  width:25 align:left fontsize:M from:12423 till:104233
 # Hungerbichltunnel:
 bar:Pyhrnbahn color:tunnel    width:19 align:left fontsize:M from:58894 till:59417
 # Posttunnel, Schloßtunnel, Fiedlerbrunntunnel:
 bar:Pyhrnbahn color:tunnel    width:19 align:left fontsize:M from:60891 till:61139
 bar:Pyhrnbahn color:tunnel    width:19 align:left fontsize:M from:61488 till:61594
 bar:Pyhrnbahn color:tunnel    width:19 align:left fontsize:M from:62546 till:62772
 # Schacherbauertunnel:
 bar:Pyhrnbahn color:tunnel    width:19 align:left fontsize:M from:82528 till:82982
 # Bosrucktunnel:
 bar:Pyhrnbahn color:tunnel    width:19 align:left fontsize:M from:91938 till:96705
 at:0      shift:($dx,$dy)  $linebf   text:Linz Hbf (km 0,0)
 at:3300   shift:($dx,$dyu) $linehst  text:Linz Oed (km 3,3)
 at:4932   shift:($dx,$dy)  $linebf   text:Linz Wegscheid (km 4,9)
 at:6664   shift:($dx,$dyu) $linehst  text:Sankt Martin bei Traun (km 6,7)
 at:8146   shift:($dx,$dy)  $linebf   text:Traun (km 8,2)
 at:10246  shift:($dx,$dy)  $linehlst text:Ansfelden (km 10,2)
 at:12423  shift:($dx,$dy)  $linebf   text:Nettingsdorf (km 12,4)
 at:15570  shift:($dx,$dy)  $linehst  text:Nöstlbach-St. Marien (km 15,6)
 at:18878  shift:($dx,$dy)  $linebf   text:Neuhofen an der Krems (km 18,9)
 at:22652  shift:($dx,$dy)  $linebf   text:Kematen an der Krems (km 22,7)
 at:28081  shift:($dx,$dy)  $linebf   text:Rohr-Bad Hall (km 28,1)
 at:32424  shift:($dx,$dy)  $linebf   text:Kremsmünster (km 32,4)
 at:36300  shift:($dx,$dy)  $linebf   text:Krift (Betriebsausweiche, km 36,3)
 at:40321  shift:($dx,$dy)  $linebf   text:Wartberg an der Krems (km 40,3)
 at:42900  shift:($dx,$dy)  $linehst  text:Nußbach (km 42,9)
 at:46566  shift:($dx,$dy)  $linebf   text:Schlierbach (46,6)
 at:50538  shift:($dx,$dy)  $linebf   text:Kirchdorf an der Krems (km 50,5)
 at:53362  shift:($dx,$dy)  $linebf   text:Micheldorf (km 53,4)
 at:58167  shift:($dx,$dy)  $linehlst text:Schön (km 58,2)
 at:60499  shift:($dx,$dy)  $linebf   text:Klaus (km 60,5)
 at:64182  shift:($dx,$dy)  $linebf   text:Steyrling (km 64,2)
 at:67758  shift:($dx,$dy)  $linebf   text:Hinterstoder (km 67,8)
 at:70150  shift:($dx,$dy)  $linehst  text:Sankt Pankraz (km 70,2)
 at:75566  shift:($dx,$dy)  $linebf   text:Pießling-Vorderstoder (km 75,6)
 at:79580  shift:($dx,$dy)  $linehlst text:Roßleithen (km 79,6)
 at:81724  shift:($dx,$dy)  $linebf   text:Windischgarsten (km 81,7)
 at:87422  shift:($dx,$dy)  $linebf   text:Spital am Pyhrn (km 87,4)
 at:98001  shift:($dx,$dy)  $linebf   text:Ardning (km 98,0)
 at:104233 shift:($dx,$dy)  $linebf   text:Selzthal (km 104,2)
| Allonnes | top next |

Initial version by Ttog on Friday, July 21, 2006
Colors=
  id:lightgrey value:gray(0.9)
  id:darkgrey  value:gray(0.7)
  id:sfondo value:rgb(1,1,1)
  id:bar value:rgb(0.6,0.7,0.8)

ImageSize  = width:400 height:373
PlotArea   = left:50 bottom:50 top:30 right:30
DateFormat = x.y
Period     = from:0 till:20000
TimeAxis   = orientation:vertical
AlignBars  = justify
ScaleMajor = gridcolor:darkgrey increment:5000 start:0
ScaleMinor = gridcolor:lightgrey increment:1000 start:0
BackgroundColors = canvas:sfondo

BarData=
  bar:1960 text:1960
  bar:1962 text:1962
  bar:1968 text:1968
  bar:1975 text:1975
  bar:1982 text:1982
  bar:1990 text:1990
  bar:1999 text:1999

PlotData=
  color:bar width:30 align:left

  bar:1960 from:0 till: 1400
  bar:1962 from:0 till: 4983
  bar:1968 from:0 till: 11570
  bar:1975 from:0 till: 15852
  bar:1982 from:0 till: 15623
  bar:1990 from:0 till: 13561
  bar:1999 from:0 till: 12332

PlotData=

  bar:1960 at: 1400 fontsize:S text: 1.400 shift:(-11,5)
  bar:1962 at: 4983 fontsize:S text: 4.983 shift:(-11,5)
  bar:1968 at: 11570 fontsize:S text: 11.570 shift:(-15,5)
  bar:1975 at: 15852 fontsize:S text: 15.852 shift:(-15,5)
  bar:1982 at: 15623 fontsize:S text: 15.623 shift:(-15,5)
  bar:1990 at: 13561 fontsize:S text: 13.561 shift:(-15,5)
  bar:1999 at: 12332 fontsize:S text: 12.332 shift:(-15,5)

TextData=
  fontsize:S pos:(20,20)
  text:Quelle INSEE
| Sekundärbahn Erlangen-Gräfenberg | top next |
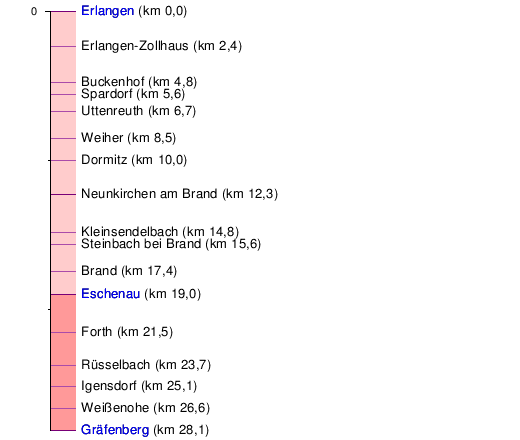
Initial version by Manfred Roth on Friday, August 19, 2005
ImageSize  = width:520 height:440
PlotArea   = left:50 right:0 bottom:10 top:10
AlignBars  = early

DateFormat = yyyy
Period     = from:0 till:28100
TimeAxis   = orientation:vertical order:reverse
ScaleMajor = unit:year increment:50000 start:0
ScaleMinor = unit:year increment:10000 start:0

# there is no automatic collision detection,
# so shift texts up or down manually to avoid overlap

Define $dx = 15  # shift text to right side of bar
Define $dy = -4  # shift text down

Define $cx = 225  # shift comment to right side of bar
Define $cy = -4  # shift comment down

Colors =
 id:strecke    value:coral       legend:Strecke_2005_noch_vorhanden
 id:abgetragen value:pink        legend:Strecke_abgetragen
 id:hst        value:lightpurple legend:Haltestelle
 id:bf         value:purple      legend:Bahnhof

Legend = orientation:vertical position:bottom

PlotData=
 bar:Seekuh color:abgetragen width:25 align:left fontsize:S from:0     till:19000
 at:0       shift:($dx,$dy) mark:(line, bf)   fontsize:M text: [[Erlangen]] (km 0,0)
 at:02400   shift:($dx,$dy) mark:(line, hst)  fontsize:M text: Erlangen-Zollhaus (km 2,4)
 at:04800   shift:($dx,$dy) mark:(line, hst)  fontsize:M text: Buckenhof (km 4,8)
 at:05600   shift:($dx,$dy) mark:(line, hst)  fontsize:M text: Spardorf (km 5,6)
 at:06700   shift:($dx,$dy) mark:(line, hst)  fontsize:M text: Uttenreuth (km 6,7)
 at:08500   shift:($dx,$dy) mark:(line, hst)  fontsize:M text: Weiher (km 8,5)
 at:10000   shift:($dx,$dy) mark:(line, hst)  fontsize:M text: Dormitz (km 10,0)
 at:12300   shift:($dx,$dy) mark:(line, bf)   fontsize:M text: Neunkirchen am Brand (km 12,3)
 at:14800   shift:($dx,$dy) mark:(line, hst)  fontsize:M text: Kleinsendelbach (km 14,8)
 at:15600   shift:($dx,$dy) mark:(line, hst)  fontsize:M text: Steinbach bei Brand (km 15,6)
 at:17400   shift:($dx,$dy) mark:(line, hst)  fontsize:M text: Brand (km 17,4)
 bar:Seekuh color:strecke width:25 align:left fontsize:S from:19000     till:28100
 at:19000   shift:($dx,$dy) mark:(line, bf)   fontsize:M text: [[Eschenau]] (km 19,0)
 at:21500   shift:($dx,$dy) mark:(line, hst)  fontsize:M text: Forth (km 21,5)
 at:23700   shift:($dx,$dy) mark:(line, hst)  fontsize:M text: Rüsselbach (km 23,7)
 at:25100   shift:($dx,$dy) mark:(line, hst)  fontsize:M text: Igensdorf (km 25,1)
 at:26600   shift:($dx,$dy) mark:(line, hst)  fontsize:M text: Weißenohe (km 26,6)
 at:28100   shift:($dx,$dy) mark:(line, bf)   fontsize:M text: [[Gräfenberg]] (km 28,1)
| Template:Zeitleiste Bundesminister für Verkehr, Bau- und Wohnungswesen | top next |

First version by 84.137.233.246 on Sunday, July 31, 2005, last update on Thursday, December 1, 2005
ImageSize	= width:260 height:200
PlotArea	= left:40 right:0 bottom:50 top:10
Legend          = columns:3 left:40 top:40 columnwidth:50

DateFormat	= dd/mm/yyyy
Period		= from:27/10/1998 till:18/09/2005
TimeAxis	= orientation:vertical format:yyyy

ScaleMajor	= unit:year increment:2 start:1999

Colors=
 id:CDU value:black
 id:SPD value:red	legend:SPD
 id:grau value:gray(0.8) # yellow bar and white lines are difficult to see

PlotData=
 bar:Innenminister color:CDU width:20 fontsize:M align:left shift:(20,-5) mark:(line,grau)

 from:start till:17/09/1999 text:[[Franz_Müntefering|Franz_Müntefering]] color:SPD
 from:29/09/1999 till:16/11/2000 text:[[Reinhard_Klimmt]] color:SPD
 from:20/11/2000 till:21/10/2002 text:[[Kurt_Bodewig]] color:SPD
 from:22/10/2002 till:end text:[[Manfred_Stolpe]] color:SPD
| Template:Erste Bürgermeister der Freien und Hansestadt Hamburg | top next |
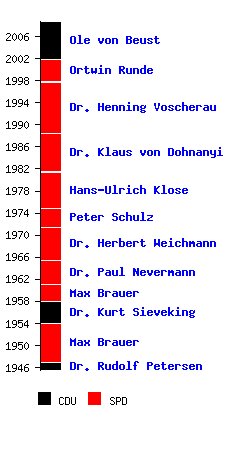
First version by 84.137.219.4 on Monday, August 1, 2005, last update on Monday, August 15, 2005
ImageSize	= width:250 height:450
PlotArea	= left:40 right:0 bottom:80 top:20
Legend		= columns:3 left:40 top:60 columnwidth:50

DateFormat	= dd/mm/yyyy
Period		= from:15/05/1945 till:31/10/2008
TimeAxis	= orientation:vertical format:yyyy

ScaleMajor	= unit:year increment:4 start:1946

Colors=
 id:CDU	value:black	legend:CDU
 id:SPD value:red	legend:SPD

PlotData=
 bar:Außenminister color:CDU width:20 fontsize:M align:left shift:(20,-5) mark:(line,white)

  from:start till:22/11/1946   color:CDU  text:[[Rudolf Petersen|Dr. Rudolf Petersen]]
  from:22/11/1946  till:02/12/1953   color:SPD  text:[[Max Brauer]]
  from:02/12/1953  till:04/12/1957   color:CDU  text:[[Kurt Sieveking|Dr. Kurt Sieveking]]
  from:04/12/1957  till:31/12/1960   color:SPD  text:[[Max Brauer]]
  from:01/01/1961  till:09/06/1965   color:SPD  text:[[Paul Nevermann|Dr. Paul Nevermann]]
  from:09/06/1965  till:09/06/1971   color:SPD  text:[[Herbert Weichmann|Dr. Herbert Weichmann]]
  from:09/06/1971  till:04/11/1974   color:SPD  text:[[Peter Schulz]]
  from:12/11/1974  till:22/05/1981   color:SPD  text:[[Hans-Ulrich Klose]]
  from:24/06/1981  till:08/06/1988   color:SPD  text:[[Klaus von Dohnanyi|Dr. Klaus von Dohnanyi]]
  from:08/06/1988  till:08/10/1997   color:SPD  text:[[Henning Vorscherau|Dr. Henning Voscherau]]
  from:12/11/1997  till:31/10/2001   color:SPD  text:[[Ortwin Runde]]
  from:31/10/2001  till:end    color:CDU  text:[[Ole von Beust]]
| Template:Zeitleiste Deutsche Vizekanzler | top next |

First version by 84.137.229.116 on Thursday, August 11, 2005, last update on Sunday, January 22, 2006
ImageSize	= width:260 height:600
PlotArea	= left:40 right:0 bottom:50 top:10
Legend          = columns:3 left:40 top:40 columnwidth:50

DateFormat	= dd/mm/yyyy
Period		= from:20/09/1949 till:22/01/2006
TimeAxis	= orientation:vertical format:yyyy

ScaleMajor	= unit:year increment:4 start:1950

Colors=
 id:CDU	  value:black	legend:CDU
 id:SPD   value:red	legend:SPD
 id:FDP   value:yellow	legend:FDP
 id:Grüne value:green   legend:Bündnis_90/Die_Grünen
 id:grau  value:gray(0.8) # yellow bar and white lines are difficult to see

PlotData=
 bar:Außenminister color:CDU width:20 fontsize:M align:left shift:(20,-5) mark:(line,grau)

 from:start till:29/10/1957 color:FDP   text:[[Franz_Blücher]]
 from:29/10/1957 till:16/10/1963 color:CDU   text:[[Ludwig_Erhard]]
 from:17/10/1963  till:28/10/1966 color:FDP   text:[[Erich_Mende]]
 from:08/11/1966  till:30/11/1966 color:CDU   text:[[Hans-Christoph_Seebohm]]
 from:01/12/1966  till:20/10/1969 color:SPD   text:[[Willy_Brandt]]
 from:21/10/1969  till:16/05/1974 color:FDP   text:[[Walter_Scheel]]
 from:17/05/1974  till:17/09/1982 color:FDP   text:[[Hans-Dietrich_Genscher]]
 from:17/09/1982  till:01/10/1982 color:SPD   text:[[Egon_Franke]]
 from:01/10/1982  till:17/05/1992 color:FDP   text:[[Hans-Dietrich_Genscher]]
 from:18/05/1992  till:21/01/1993 color:FDP   text:[[Jürgen_Möllemann]]
 from:21/01/1993  till:26/09/1998 color:FDP   text:[[Klaus_Kinkel]]
 from:28/10/1998  till:18/10/2005 color:Grüne text:[[Joschka_Fischer]]
 from:22/11/2005  till:end color:SPD text:[[Franz_Müntefering]]
| Template:Zeitleiste Deutsche Justizminister | top next |

First version by 84.137.240.92 on Thursday, August 11, 2005, last update on Tuesday, April 11, 2006
ImageSize	= width:315 height:800
PlotArea	= left:40 right:0 bottom:80 top:20
Legend		= columns:3 left:40 top:60 columnwidth:50

DateFormat	= dd/mm/yyyy
Period		= from:23/05/1949 till:01/05/2006
TimeAxis	= orientation:vertical format:yyyy

ScaleMajor	= unit:year increment:4 start:1950

Colors=
 id:CDU	value:black	legend:CDU
 id:CSU value:blue      legend:CSU
 id:SPD value:red	legend:SPD
 id:FDP value:yellow	legend:FDP
 id:DP  value:orange	legend:DP

PlotData=
 bar:Außenminister color:black width:20 fontsize:M align:left shift:(20,-5) mark:(line,white)

 from:20/09/1949 till:20/10/1953 text:[[Thomas_Dehler|Dr._Thomas_Dehler]] color:FDP
 from:20/10/1953 till:16/10/1956 text:[[Fritz_Neumayer]] color:FDP
 from:16/10/1956 till:29/10/1957 text:[[Hans-Joachim_von_Merkatz|Dr._Hans-Joachim_von_Merkatz]] color:DP
 from:29/10/1957 till:14/11/1961 text:[[Fritz_Schäffer|Fritz_Schäffer]] color:CSU
 from:14/11/1961 till:19/11/1962 text:[[Wolfgang_Stammberger|Dr._Wolfgang_Stammberger]] color:FDP
 from:13/12/1962 till:27/03/1965 text:[[Ewald_Bucher|Dr._Ewald_Bucher]] color:FDP
 from:01/04/1965 till:26/10/1965 text:[[Karl_Weber|Dr._Karl_Weber]] color:CDU
 from:26/10/1965 till:30/11/1966 text:[[Richard_Jaeger|Dr._Richard_Jaeger]] color:CSU
 from:01/12/1966 till:26/03/1969 text:[[Gustav_Heinemann|Dr._Dr._Gustav_Heinemann]] color:SPD
 from:26/03/1969 till:21/10/1969 text:[[Horst_Ehmke|Prof._Dr._Horst_Ehmke]] color:SPD
 from:22/10/1969 till:07/05/1974 text:[[Gerhard_Jahn]] color:SPD
 from:16/05/1974 till:22/01/1981 text:[[Hans-Jochen_Vogel|Dr._Hans-Jochen_Vogel]] color:SPD
 from:22/01/1981 till:01/10/1982 text:[[Jürgen_Schmude|Dr._Jürgen_Schmude]] color:SPD
 from:04/10/1982 till:18/01/1991 text:[[Hans_A._Engelhard]] color:FDP
 from:18/01/1991 till:18/05/1992 text:[[Klaus_Kinkel|Dr._Klaus_Kinkel]] color:FDP
 from:18/05/1992 till:17/01/1996 text:[[Sabine_Leutheusser-Schnarrenberger]] color:FDP
 from:17/01/1996 till:26/10/1998 text:[[Edzard_Schmidt-Jortzig|Prof._Dr._Edzard_Schmidt-Jortzig]] color:FDP
 from:27/10/1998 till:22/10/2002 text:[[Herta_Däubler-Gmelin|Prof._Dr._Herta_Däubler-Gmelin]] color:SPD
 from:22/10/2002 till:end text:[[Brigitte_Zypries]] color:SPD
| Template:Zeitleiste Deutsche Verteidigungsminister | top next |

First version by 84.137.191.95 on Saturday, August 13, 2005, last update on Thursday, June 15, 2006
ImageSize	= width:250 height:600
PlotArea	= left:40 right:0 bottom:80 top:20
Legend		= columns:3 left:40 top:60 columnwidth:50

DateFormat	= dd/mm/yyyy
Period		= from:07/06/1955 till:30/03/2007
TimeAxis	= orientation:vertical format:yyyy

ScaleMajor	= unit:year increment:4 start:1956

Colors=
 id:CDU	value:black	legend:CDU
 id:CSU value:blue      legend:CSU
 id:SPD value:red	legend:SPD

PlotData=
 bar:Außenminister color:CDU width:20 fontsize:M align:left shift:(20,-5) mark:(line,white)

 from:start till:16/10/1956 text:[[Theodor_Blank]] color:CDU
 from:16/10/1956 till:11/12/1962 text:[[Franz_Josef_Strauß]] color:CSU
 from:11/12/1962 till:01/12/1966 text:[[Kai-Uwe_von_Hassel]] color:CDU
 from:01/12/1966 till:21/09/1969 text:[[Gerhard_Schröder+(CDU)|Gerhard_Schröder]] color:CDU
 from:21/09/1969 till:10/07/1972 text:[[Helmut_Schmidt]] color:SPD
 from:10/07/1972 till:01/02/1978 text:[[Georg_Leber]] color:SPD
 from:17/02/1978 till:01/10/1982 text:[[Hans_Apel]] color:SPD
 from:04/10/1982 till:18/05/1988 text:[[Manfred_Wörner]] color:CDU
 from:18/05/1988 till:21/04/1989 text:[[Rupert_Scholz]] color:CDU
 from:21/04/1989 till:31/03/1992 text:[[Gerhard_Stoltenberg]] color:CDU
 from:02/04/1992 till:28/10/1998 text:[[Volker_Rühe]] color:CDU
 from:28/10/1998 till:19/07/2002 text:[[Rudolf_Scharping]] color:SPD
 from:19/07/2002 till:22/11/2005 text:[[Peter_Struck]] color:SPD
 from:22/11/2005 till:end text:[[Franz_Josef_Jung]] color:CDU
| Template:Zeitleiste Deutsche Landwirtschaftsminister | top next |

First version by 84.137.239.227 on Monday, August 15, 2005, last update on Thursday, November 24, 2005
ImageSize	= width:250 height:850
PlotArea	= left:40 right:0 bottom:80 top:20
Legend		= columns:3 left:40 top:60 columnwidth:50

DateFormat	= dd/mm/yyyy
Period		= from:20/09/1949 till:31/12/2007
TimeAxis	= orientation:vertical format:yyyy

ScaleMajor	= unit:year increment:4 start:1950

Colors=
 id:CDU	value:black	legend:CDU
 id:CSU value:blue      legend:CSU
 id:SPD value:red	legend:SPD
 id:Grüne value:green   legend:Bündnis_90/Die_Grünen
 id:FDP value:yellow	legend:FDP

PlotData=
 bar:Außenminister color:CDU width:20 fontsize:M align:left shift:(20,-5) mark:(line,white)

 from:start till:20/10/1953 text:[[Wilhelm_Niklas|Prof._Dr._Wilhelm_Niklas]] color:CSU
 from:20/10/1953 till:15/09/1959 text:[[Heinrich_Lübke|Heinrich_Lübke]] color:CDU
 from:14/10/1959 till:26/10/1965 text:[[Werner_Schwarz]] color:CDU
 from:26/10/1965 till:21/10/1969 text:[[Hermann_Höcherl|Hermann_Höcherl]] color:CSU
 from:22/10/1969 till:17/09/1982 text:[[Josef_Ertl]] color:FDP
 from:17/09/1982 till:01/10/1982 shift:(20,-10) text:[[Björn_Engholm|Björn_Engholm]] color:SPD
 from:04/10/1982 till:29/03/1983 text:[[Josef_Ertl]] color:FDP
 from:30/03/1983 till:21/01/1993 text:[[Ignaz_Kiechle]] color:CSU
 from:21/01/1993 till:26/10/1998 text:[[Jochen_Borchert]] color:CDU
 from:27/10/1998 till:12/01/2001 text:[[Karl-Heinz_Funke]] color:SPD
 from:12/01/2001 till:04/10/2005 text:[[Renate_Künast|Renate_Künast]] color:Grüne
 from:04/10/2005 till:22/11/2005 text:[[Jürgen_Trittin|Jürgen_Trittin]] color:Grüne
 from:22/11/2005 till:end text:[[Horst_Seehofer]] color:CSU
| Albreda | top next |

First version by Atamari on Tuesday, October 4, 2005, last update on Tuesday, July 11, 2006
ImageSize  = width:238 height:120
PlotArea = width:80% height:70% left:20% bottom:20%
AlignBars  = late

DateFormat = yyyy
Period     = from:0 till:2000
TimeAxis   = orientation:vertical
ScaleMajor = increment:500 start:0

PlotData=
  color:drabgreen
  bar:1993 from:start till:1382
  bar:2005 from:start till:1638
  bar:2006 from:start till:1656

TextData=
  pos:(100,110) fontsize:M text:Einwohnerentwicklung
| Barra (Gambia) | top next |

First version by Atamari on Thursday, October 6, 2005, last update on Tuesday, July 11, 2006
ImageSize  = width:238 height:120
PlotArea = width:80% height:70% left:20% bottom:20%
AlignBars  = late

DateFormat = yyyy
Period     = from:0 till:8000
TimeAxis   = orientation:vertical
ScaleMajor = increment:2000 start:0

PlotData=
  color:drabgreen
  bar:1983 from:start till:2504
  bar:1993 from:start till:4257
  bar:2005 from:start till:5323
  bar:2006 from:start till:5421

TextData=
  pos:(100,110) fontsize:M text:Einwohnerentwicklung
| Template:Zeitleiste Koalitionskriege | top next |

Initial version by 213.54.201.57 on Tuesday, August 30, 2005
DateFormat = yyyy
Period     = from:1792 till:1815
ScaleMajor = unit:year increment:1 start:1792
TimeAxis   = orientation:horizontal
AlignBars  = late
ImageSize  = width:1000 height:450
PlotArea   = left:10% right:20% top:10% bottom:10%
Define $dy = -25

Colors =
  id:phase     value:kelleygreen    legend:Phase
  id:feldzug   value:drabgreen      legend:Feldzug
  id:koalition value:tan2           legend:Koalition
  id:vertrag   value:rgb(0.6,0,0.6) legend:Vertrag

BarData =
  barset:phasen
  bar:feldzüge1
  bar:feldzüge2
  bar:feldzüge3
  bar:ereignisse1
  bar:ereignisse2
  bar:koalitionen

PlotData   =

  barset:phasen
    from:1792 till:1802 color:phase align:center text:Revolutionskriege
    from:1799 till:1815 color:phase align:center text:Napoleonische_Kriege
    from:1812 till:1815 color:phase align:center text:"[[Befreiungskriege]]"

  bar:feldzüge1 color:feldzug
    from:1796 till:1797 align:right text:Italien-~feldzug
    from:1806 till:1807 align:right text:Feldzug_gegen~Preußen
    from:1812 till:1813 align:right text:"[[Vaterländischer_Krieg|Russlandfeldzug]]"
    from:1814 till:1815 align:left text:Feldzüge_in~Frankreich

  bar:feldzüge2 color:feldzug
    from:1798 till:1799 align:right text:"[[Ägyptische_Expedition]]"
    from:1808 till:1814 color:feldzug align:center text:"[[Die_Napoleonischen_Kriege_auf_der_Iberischen_Halbinsel|Krieg_auf_der_Halbinsel]]"


  bar:feldzüge3
    from:1805 till:1806 align:right text:Feldzug_gegen~Österreich
    from:1809 till:1810 align:right text:Feldzug_gegen~Österreich
    from:1813 till:1814 align:left text:Feldzug_in_Thüringen,~Sachsen_und_Hessen

  bar:ereignisse1
    at:1799 text:"1799: Napoleon~wird [[Französisches_Konsulat|1. Konsul]]"
    at:1804 text:"1804: Napoleon krönt~sich zum [[Geschichte_Frankreichs#Erstes_Kaiserreich|Kaiser]]"
    at:1814 text:"1814: Napoleon wird~auf Elba verbannt"

  bar:ereignisse2
    at:1805 text:"1805: Beginn der~[[Kontinentalsperre]]"
    at:1815 text:"1815: Beginn~des [[Wiener_Kongress]]"

  bar:koalitionen
    from:1792 till:1797 color:koalition align:center text:1._Koalition shift:(0, $dy)
    at:1797 mark:(line,white)
    from:1797 till:1802 color:koalition align:center text:2._Koalition shift:(0, $dy)
    from:1805 till:1806 color:koalition align:right text:3._Koalition shift:(0, $dy)
    at:1806 mark:(line,white)
    from:1806 till:1807 color:koalition align:left text:4._Koalition shift:(0, $dy)
    from:1809 till:1810 color:koalition align:left text:5._Koalition shift:(0, $dy)
    from:1812 till:1814 color:koalition align:left text:6._Koalition shift:(0, $dy)
| Kerewan | top next |

First version by Atamari on Tuesday, August 30, 2005, last update on Wednesday, July 12, 2006
ImageSize  = width:238 height:120
PlotArea = width:80% height:70% left:20% bottom:20%
AlignBars  = late

DateFormat = yyyy
Period     = from:0 till:5000
TimeAxis   = orientation:vertical
ScaleMajor = increment:1000 start:0

PlotData=
  color:drabgreen
  bar:1983 from:start till:3173
  bar:1993 from:start till:3403
  bar:2005 from:start till:2751
  bar:2006 from:start till:2692

TextData=
  pos:(100,110) fontsize:M text:Einwohnerentwicklung
| Template:Zeitleiste Geologische Zeitskala | top next |

First version by Stefan h ? on Friday, September 2, 2005, last update on Monday, October 17, 2005
ImageSize   = width:275 height:800
PlotArea    = left:45 right:5 bottom:25 top:10
AlignBars   = justify

Colors =
  id:neogene             value:rgb(0.99215,0.8,0.54)
  id:paleogene           value:rgb(1,0.7019,0)
  id:cretaceous          value:rgb(0.5,0.764,0.1098)
  id:jurassic            value:rgb(0.302,0.706,0.5)
  id:triassic            value:rgb(0.403,0.765,0.716)
  id:permian             value:rgb(0.404,0.776,0.867)
  id:carboniferous       value:rgb(0.6,0.741,0.855)
  id:devonian            value:rgb(0.6,0.6,0.788)
  id:silurian            value:rgb(0.694,0.447,0.714)
  id:ordovician          value:rgb(0.976,0.506,0.651)
  id:cambrian            value:rgb(0.984,0.5,0.373)
  id:neoproterozoic      value:rgb(0.792,0.647,0.583)
  id:mesoproterozoic     value:rgb(0.867,0.761,0.533)
  id:paleoproterozoic    value:rgb(0.702,0.698,0.369)
  id:eoarchean           value:rgb(0.5,0.565,0.565)
  id:paleoarchean        value:rgb(0.6,0.592,0.569)
  id:mesoarchean         value:rgb(0.698,0.65,0.6)
  id:neoarchean          value:rgb(0.796,0.804,0.784)
  id:ediacaran           value:rgb(0.918,0.847,0.737)
  id:cryogenian          value:rgb(0.863,0.671,0.667)
  id:tonian              value:rgb(0.796,0.643,0.424)
  id:stratherian         value:rgb(1,1,0.8)   # light yellow
  id:calymmian           value:rgb(1,1,0.8)   # light yellow
  id:orosirian           value:rgb(1,1,0.8)   # light yellow
  id:rhyacian            value:rgb(1,1,0.8)   # light yellow
  id:siderian            value:rgb(1,1,0.8)   # light yellow
  id:ectasian            value:rgb(1,1,0.8)   # light yellow
  id:stenian             value:rgb(1,1,0.8)   # light yellow
  id:cenozoic            value:rgb(1,1,0)
  id:mesozoic            value:rgb(0.5,0.6784,0.3176)
  id:paleozoic           value:rgb(0.5,0.7098,0.835)
  id:phanerozoic         value:rgb(0.7019,0.886,0.819)
  id:proterozoic         value:rgb(0.8,0.85,0.568)
  id:archean             value:rgb(0.6,0.6784,0.6745)
  id:hadean              value:rgb(0.4,0.4,0.4)
  id:black               value:black
  id:white               value:white

Period      = from:-4567.2 till:0
TimeAxis    = orientation:vertical
ScaleMajor  = unit:year increment:500  start:-4500
ScaleMinor  = unit:year increment:100  start:-4500

Define $markred = text:"*" textcolor:red fontsize:10

TextData =
  pos:(10,13)  textcolor:black fontsize:8 text:Mio.
  pos:(10,3)   textcolor:black fontsize:8 text:Jahre

PlotData =
  align:center textcolor:black fontsize:8 mark:(line,black) width:75 shift:(0,-5)

  bar:Äon

  at:      0   $markred   shift:(0,-15)
  at:   -542   $markred   shift:(0,3)
  from: -542   till:    0   color:phanerozoic       text:[[Phanerozoikum|Phanero-~zoikum]] shift:(0,1.5)
  from:-2500   till: -542   color:proterozoic       text:[[Proterozoikum|Protero-~zoikum]] shift:(0,1.5)
  from:-3800   till:-2500   color:archean           text:[[Archaikum]]
  from:start   till:-3800   color:hadean            text:[[Hadaikum]]


  bar:Ära

  from:  -65.5 till:    0   color:cenozoic          text:[[Känozoikum]]
  from: -251   till:  -65.5 color:mesozoic          text:[[Mesozoikum]]
  from: -542   till: -251   color:paleozoic         text:[[Paläozoikum]]
  from:-1000   till: -542   color:neoproterozoic    text:[[Neoproterozoikum|Neoprote-~rozoikum]] shift:(0,1.5)
  from:-1600   till:-1000   color:mesoproterozoic   text:[[Mesoproterozoikum|Mesoprotero-~zoikum]] shift:(0,1.5)
  from:-2500   till:-1600   color:paleoproterozoic  text:[[Paläoproterozoikum|Paläoprotero-~zoikum]] shift:(0,1.5)
  from:-2800   till:-2500   color:neoarchean        text:[[Neoarchaikum]]
  from:-3200   till:-2800   color:mesoarchean       text:[[Mesoarchaikum|Meso-~archaikum]] shift:(0,1.5)
  from:-3600   till:-3200   color:paleoarchean      text:[[Paleäoarchaikum|Paläo-~archaikum]] shift:(0,1.5)
  from:-3800   till:-3600   color:eoarchean         text:[[Eoarchaikum]]
  from:start   till:-3800   color:white

  bar:Periode

  from:  -23.0 till:    0   color:neogene
  from:  -65.5 till:  -23.0 color:paleogene
  from: -145.5 till:  -65.5 color:cretaceous
  from: -199.6 till: -145.5 color:jurassic
  from: -251   till: -199.6 color:triassic
  from: -299   till: -251   color:permian
  from: -359.2 till: -299   color:carboniferous
  from: -416   till: -359.2 color:devonian
  from: -443.7 till: -416   color:silurian
  from: -488.3 till: -443.7 color:ordovician
  from: -542   till: -488.3 color:cambrian

  from: -630   till: -542   color:ediacaran         text:[[Ediacarium]]
  from: -850   till: -630   color:cryogenian        text:[[Cryogenium]]
  from:-1000   till: -850   color:tonian            text:[[Tonium]]
  from:-1200   till:-1000   color:mesoproterozoic   text:[[Stenium]]
  from:-1400   till:-1200   color:mesoproterozoic   text:[[Ectasium]]
  from:-1600   till:-1400   color:mesoproterozoic   text:[[Calymmium]]
  from:-1800   till:-1600   color:paleoproterozoic  text:[[Statherium]]
  from:-2050   till:-1800   color:paleoproterozoic  text:[[Orosirium]]
  from:-2300   till:-2050   color:paleoproterozoic  text:[[Rhyacium]]
  from:-2500   till:-2300   color:paleoproterozoic  text:[[Siderium]]
  from:start   till:-2500   color:white
| Template:Zeitleiste Geologische Zeitskala | top next |

First version by Stefan h ? on Friday, September 2, 2005, last update on Monday, October 17, 2005
ImageSize   = width:275 height:800
PlotArea    = left:45 right:5 bottom:25 top:10
AlignBars   = justify

Colors =
  id:neogene             value:rgb(0.99215,0.8,0.54)
  id:paleogene           value:rgb(1,0.7019,0)
  id:cretaceous          value:rgb(0.5,0.764,0.1098)
  id:jurassic            value:rgb(0.302,0.706,0.5)
  id:triassic            value:rgb(0.403,0.765,0.716)
  id:permian             value:rgb(0.404,0.776,0.867)
  id:carboniferous       value:rgb(0.6,0.741,0.855)
  id:devonian            value:rgb(0.6,0.6,0.788)
  id:silurian            value:rgb(0.694,0.447,0.714)
  id:ordovician          value:rgb(0.976,0.506,0.651)
  id:cambrian            value:rgb(0.984,0.5,0.373)
  id:cenozoic            value:rgb(1,1,0)
  id:mesozoic            value:rgb(0.5,0.6784,0.3176)
  id:paleozoic           value:rgb(0.5,0.7098,0.835)
  id:phanerozoic         value:rgb(0.7019,0.886,0.819)
  id:black               value:black
  id:white               value:white
  id:darkgreen           value:rgb(0,0.35,0)


Period      = from:-542    till:0
TimeAxis    = orientation:vertical
ScaleMajor  = unit:year increment:100  start:-500
ScaleMinor  = unit:year increment:10   start:-540

Define $markred   = text:"*" textcolor:red       fontsize:10
Define $markgreen = text:"*" textcolor:darkgreen fontsize:10

TextData =
  pos:(10,13)  textcolor:black fontsize:8 text:Mio.
  pos:(10,3)   textcolor:black fontsize:8 text:Jahre

PlotData =
  align:center textcolor:black fontsize:8 mark:(line,black) width:75 shift:(0,-5)

  bar:Äon
  at:      0   $markred  shift:(0,-15)
  at:   -542   $markred  shift:(0,3)
  from: -542   till:    0   color:phanerozoic       text:[[Phanerozoikum|Phanero-~zoikum]] shift:(0,1.5)

  bar:Ära
  at:      0   $markgreen shift:(0,-15)
  at:    -65.5 $markgreen shift:(0,3)
  from:  -65.5 till:    0   color:cenozoic          text:[[Känozoikum]]
  from: -251   till:  -65.5 color:mesozoic          text:[[Mesozoikum]]
  from: -542   till: -251   color:paleozoic         text:[[Paläozoikum]]

  bar:Periode fontsize:8
  from:  -23.0 till:    0   color:neogene           text:[[Neogen]]
  from:  -65.5 till:  -23.0 color:paleogene         text:[[Paläogen]]
  from: -145.5 till:  -65.5 color:cretaceous        text:[[Kreide (Geologie)|Kreide]]
  from: -199.6 till: -145.5 color:jurassic          text:[[Jura (Geologie)|Jura]]
  from: -251   till: -199.6 color:triassic          text:[[Trias (Geologie)|Trias]]
  from: -299   till: -251   color:permian           text:[[Perm (Geologie)|Perm]]
  from: -359.2 till: -299   color:carboniferous     text:[[Karbon]]
  from: -416   till: -359.2 color:devonian          text:[[Devon (Geologie)|Devon]]
  from: -443.7 till: -416   color:silurian          text:[[Silur (Geologie)|Silur]]
  from: -488.3 till: -443.7 color:ordovician        text:[[Ordovizium]]
  from: -542   till: -488.3 color:cambrian          text:[[Kambrium]]
| Template:Zeitleiste Geologische Zeitskala | top next |

First version by Stefan h ? on Friday, September 2, 2005, last update on Monday, October 17, 2005
ImageSize   = width:275 height:800
PlotArea    = left:45 right:5 bottom:25 top:10
AlignBars   = justify

Colors =
  id:neogene             value:rgb(0.99215,0.8,0.54)
  id:paleogene           value:rgb(1,0.7019,0)
  id:cenozoic            value:rgb(1,1,0)
  id:holocene            value:rgb(1,1,0.702)
  id:pleistocene         value:rgb(1,0.922,0.384)
  id:pliocene            value:rgb(1,0.922,0.675)
  id:miocene             value:rgb(1,0.871,0)
  id:oligocene           value:rgb(0.918,0.776,0.447)
  id:eocene              value:rgb(0.918,0.678,0.263)
  id:paleocene           value:rgb(0.92,0.576,0.005)
  id:black               value:black
  id:white               value:white
  id:darkgreen           value:rgb(0,0.35,0)

Period      = from:-65.5   till:0
TimeAxis    = orientation:vertical
ScaleMajor  = unit:year increment:10   start:-60
ScaleMinor  = unit:year increment:1    start:-65

Define $markgreen = text:"*" textcolor:darkgreen fontsize:10

TextData =
  pos:(10,13)  textcolor:black fontsize:8 text:Mio.
  pos:(10,3)   textcolor:black fontsize:8 text:Jahre

PlotData =
  align:center textcolor:black fontsize:8 mark:(line,black) width:75 shift:(0,-5)

  bar:Ära
  at:      0   $markgreen shift:(0,-15)
  at:  start   $markgreen shift:(0,3)
  from:start   till:    0   color:cenozoic          text:[[Känozoikum]]

  bar:Periode
  from:  -23.0 till:    0   color:neogene           text:[[Neogen]]
  from:start   till:  -23.0 color:paleogene         text:[[Paläogen]]

  bar:Epoche
  from:   -0.1 till:    0   color:holocene
  from:   -1.8 till:   -0.1 color:pleistocene       text:[[Pleistozän]]
  from:   -5.3 till:   -1.8 color:pliocene          text:[[Pliozän]]
  from:  -23.0 till:   -5.3 color:miocene           text:[[Miozän]]
  from:  -33.9 till:  -23.0 color:oligocene         text:[[Oligozän]]
  from:  -55.8 till:  -33.9 color:eocene            text:[[Eozän]]
  from:start   till:  -55.8 color:paleocene         text:[[Paläozän]]
| Template:Zeitleiste Ta-Yuan | top next |

First version by Ixitixel on Monday, September 5, 2005, last update on Wednesday, October 12, 2005
ImageSize  = width:500 height:550
PlotArea   = width:450 height:530 left:50 bottom:10

DateFormat = yyyy
Period     = from:-329 till:150
TimeAxis   = orientation:vertical
ScaleMajor = unit:year increment:50 start:-329

# there is no automatic collision detection,
# so shift texts up or down manually to avoid overlap

Define $dx = 25 # shift text to right side of bar

PlotData=
  bar:Leaders color:red width:25 mark:(line,white) align:left fontsize:S

  from:start till:-250 shift:($dx,0)   text:Hellenistische Herrschaft, Alexander der Große, Seleukiden
  from:-250  till:-160 shift:($dx,0)    text:Königreich der Gräko-Baktrer
  at:-155 mark:(line,black) shift:(15,-4)             text:Einfall der Yüe-tschi
  from:-160  till:-130 shift:($dx,3)    text:Herrschaft der Saken
  from:-130  till:end shift:($dx,-5)     text:Annäherung an das Kaiserreich China, Zeit der Seidenstraße
  at:-104 mark:(line,black) shift:(15,-4)            text:Angriff der Chinesen um Pferde zu erobern
| Template:Zeitleiste Ministerpräsidenten von Rheinland-Pfalz | top next |

First version by Chefarzt on Saturday, September 10, 2005, last update on Wednesday, May 31, 2006
ImageSize = width:220 height:400
PlotArea  = left:50 right:0 bottom:40 top:10
Legend    = columns:2 left:15 top:25 columnwidth:50

DateFormat = yyyy
Period     = from:1947 till:2006
TimeAxis   = orientation:vertical format:yyyy
ScaleMajor = unit:year increment:5 start:1947

Colors=
  id:CDU  value:gray(0.25) legend:CDU
  id:SPD  value:red    legend:SPD

PlotData=
  bar:Leaders width:25 mark:(line,white) align:left fontsize:S

  from:start till:1947 shift:(25,5) color:CDU text:[[Wilhelm Boden|Dr. Wilhelm Boden (CDU)]]~bis 13. Juli 1947
  from:1947  till:1969 shift:(25,5) color:CDU text:[[Peter Altmeier|Dr. h. c. Peter Altmeier ]]
  from:1969  till:1976 shift:(25,5) color:CDU text:[[Helmut Kohl|Dr. Helmut Kohl]]
  from:1976  till:1988 shift:(25,5) color:CDU text:[[Bernhard Vogel|Dr. Bernhard Vogel]]
  from:1988  till:1991 shift:(25,5) color:CDU text:[[Carl-Ludwig Wagner|Dr. Carl-Ludwig Wagner]]
  from:1991  till:1994 shift:(25,5) color:SPD text:[[Rudolf Scharping]]
  from:1994  till:end shift:(25,5) color:SPD text:[[Kurt Beck]]
| Template:Zeitleiste Paläobotanik | top next |

First version by Stefan h on Tuesday, September 20, 2005, last update on Tuesday, May 16, 2006
ImageSize   = width:800 height:110
PlotArea    = left:90 right:5 bottom:25 top:10
AlignBars   = justify

Colors =
  id:neophytikum         value:rgb(0.7,1,0.7)
  id:mesophytikum        value:rgb(0.6,0.9,0.6)
  id:paleophytikum       value:rgb(0.5,0.8,0.5)
  id:eophytikum          value:rgb(0.4,0.7,0.4)
  id:cenozoic            value:rgb(1,1,0)
  id:mesozoic            value:rgb(0.5,0.6784,0.3176)
  id:paleozoic           value:rgb(0.5,0.7098,0.835)
  id:phanerozoic         value:rgb(0.7019,0.886,0.819)
  id:black               value:black
  id:white               value:white


Period      = from:-542    till:0
TimeAxis    = orientation:horizontal
ScaleMajor  = unit:year increment:100  start:-500
ScaleMinor  = unit:year increment:10   start:-540

TextData =
  pos:(10,10)  textcolor:black fontsize:8 text:Millionen Jahre

PlotData =
  align:center textcolor:black fontsize:8 mark:(line,black) width:25 shift:(0,-5)

  bar:Äon
  from: -542   till:    0   color:phanerozoic       text:[[Phanerozoikum]]

  bar:Ära
  from:  -65.5 till:    0   color:cenozoic          text:[[Känozoikum]]
  from: -251   till:  -65.5 color:mesozoic          text:[[Mesozoikum]]
  from: -542   till: -251   color:paleozoic         text:[[Paläozoikum]]

  bar:Paläobotanik
  from:  -95   till:    0   color:neophytikum       text:[[Neophytikum]]
  from: -251   till:  -95   color:mesophytikum      text:[[Mesophytikum]]
  from: -443.7 till: -251   color:paleophytikum     text:[[Paläophytikum]]
  from: -542   till: -443.7 color:eophytikum        text:[[Eophytikum]]
| Chiesanuova | top next |

Initial version by Robert Weemeyer on Wednesday, March 8, 2006
Colors=
  id:lightgrey value:gray(0.9)
  id:darkgrey  value:gray(0.7)
  id:sfondo value:rgb(1,1,1)
  id:barra value:rgb(0.6,0.7,0.8)

ImageSize  = width:455 height:373
PlotArea   = left:50 bottom:50 top:30 right:30
DateFormat = x.y
Period     = from:0 till:950
TimeAxis   = orientation:vertical
AlignBars  = justify
ScaleMajor = gridcolor:darkgrey increment:50 start:0
ScaleMinor = gridcolor:lightgrey increment:10 start:0
BackgroundColors = canvas:sfondo

BarData=
  bar:1861 text:1861
  bar:1871 text:1871
  bar:1881 text:1881
  bar:1901 text:1901
  bar:1911 text:1911
  bar:1921 text:1921
  bar:1931 text:1931
  bar:1936 text:1936
  bar:1951 text:1951
  bar:1961 text:1961
  bar:1971 text:1971
  bar:1981 text:1981
  bar:1991 text:1991
  bar:2001 text:2001

PlotData=
  color:barra width:20 align:left

  bar:1861 from:0 till: 814
  bar:1871 from:0 till: 914
  bar:1881 from:0 till: 892
  bar:1901 from:0 till: 843
  bar:1911 from:0 till: 671
  bar:1921 from:0 till: 555
  bar:1931 from:0 till: 472
  bar:1936 from:0 till: 477
  bar:1951 from:0 till: 377
  bar:1961 from:0 till: 298
  bar:1971 from:0 till: 238
  bar:1981 from:0 till: 205
  bar:1991 from:0 till: 208
  bar:2001 from:0 till: 199

PlotData=

  bar:1861 at: 814 fontsize:S text: 814 shift:(-8,5)
  bar:1871 at: 914 fontsize:S text: 914 shift:(-10,5)
  bar:1881 at: 892 fontsize:S text: 892 shift:(-10,5)
  bar:1901 at: 843 fontsize:S text: 843 shift:(-10,5)
  bar:1911 at: 671 fontsize:S text: 671 shift:(-10,5)
  bar:1921 at: 555 fontsize:S text: 555 shift:(-10,5)
  bar:1931 at: 472 fontsize:S text: 472 shift:(-10,5)
  bar:1936 at: 477 fontsize:S text: 477 shift:(-10,5)
  bar:1951 at: 377 fontsize:S text: 377 shift:(-10,5)
  bar:1961 at: 298 fontsize:S text: 298 shift:(-10,5)
  bar:1971 at: 238 fontsize:S text: 238 shift:(-10,5)
  bar:1981 at: 205 fontsize:S text: 205 shift:(-10,5)
  bar:1991 at: 208 fontsize:S text: 208 shift:(-10,5)
  bar:2001 at: 199 fontsize:S text: 199 shift:(-10,5)
| Bakau | top next |

First version by Atamari on Monday, October 3, 2005, last update on Tuesday, July 11, 2006
ImageSize  = width:238 height:120
PlotArea = width:80% height:70% left:20% bottom:20%
AlignBars  = late

DateFormat = yyyy
Period     = from:0 till:50000
TimeAxis   = orientation:vertical
ScaleMajor = increment:10000 start:0

PlotData=
  color:drabgreen
  bar:1963 from:start till:3563
  bar:1973 from:start till:9337
  bar:1983 from:start till:20177
  bar:1993 from:start till:28882
  bar:2005 from:start till:43098
  bar:2006 from:start till:45529

TextData=
  pos:(100,110) fontsize:M text:Einwohnerentwicklung
| Kanilai | top next |

First version by Atamari on Tuesday, October 4, 2005, last update on Wednesday, July 12, 2006
ImageSize  = width:238 height:120
PlotArea = width:80% height:70% left:20% bottom:20%
AlignBars  = late

DateFormat = yyyy
Period     = from:0 till:1000
TimeAxis   = orientation:vertical
ScaleMajor = increment:250 start:0

PlotData=
  color:drabgreen
  bar:1993 from:start till:390
  bar:2005 from:start till:664
  bar:2006 from:start till:689

TextData=
  pos:(100,110) fontsize:M text:Einwohnerentwicklung
| Farafenni | top next |

First version by Atamari on Tuesday, October 4, 2005, last update on Wednesday, July 12, 2006
ImageSize  = width:238 height:120
PlotArea = width:80% height:70% left:20% bottom:20%
AlignBars  = late

DateFormat = yyyy
Period     = from:0 till:50000
TimeAxis   = orientation:vertical
ScaleMajor = increment:10000 start:0

PlotData=
  color:drabgreen
  bar:1983 from:start till:10168
  bar:1993 from:start till:20956
  bar:2005 from:start till:29867
  bar:2006 from:start till:30418

TextData=
  pos:(100,110) fontsize:M text:Einwohnerentwicklung
| Soma (Gambia) | top next |

First version by Atamari on Tuesday, October 4, 2005, last update on Thursday, July 13, 2006
ImageSize  = width:238 height:120
PlotArea = width:80% height:70% left:20% bottom:20%
AlignBars  = late

DateFormat = yyyy
Period     = from:0 till:12000
TimeAxis   = orientation:vertical
ScaleMajor = increment:4000 start:0

PlotData=
  color:drabgreen
  bar:1983 from:start till:4789
  bar:1993 from:start till:7988
  bar:2005 from:start till:9869
  bar:2006 from:start till:10005

TextData=
  pos:(100,110) fontsize:M text:Einwohnerentwicklung
| Gründerväter der Vereinigten Staaten | top next |
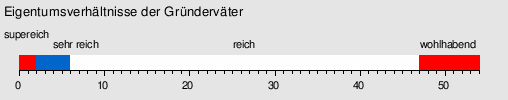
First version by Sebastian Wallroth ? on Friday, October 7, 2005, last update on Wednesday, October 12, 2005
ImageSize  = width:510 height:100
PlotArea   = width:460 height:30 left:20 bottom:30
TimeAxis   = orientation:horizontal
Period     = from:0 till:54
ScaleMajor = unit:year increment:10 start:0
ScaleMinor = unit:year increment:1 start:0
AlignBars  = early
Colors     =
  id:canvas value:gray(0.9)
BackgroundColors = canvas:canvas
PlotData =
  width:15 color:red
  bar:test from:0 till:2 shift:(0,25) align:center text:supereich
  width:15 color:blue
  bar:test from:2 till:6 shift:(0,15) align:left text:sehr reich
  width:15 color:white
  bar:test from:6 till:47 shift:(0,15) align:center text:reich
  width:15 color:red
  bar:test from:47 till:54 shift:(0,15) align:center text:wohlhabend
TextData =
  pos:(5,100) fontsize:M
  text:Eigentumsverhältnisse der Gründerväter
| Gründerväter der Vereinigten Staaten | top next |
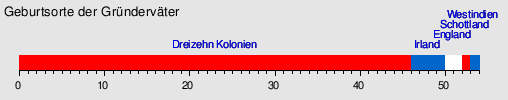
First version by Sebastian Wallroth ? on Friday, October 7, 2005, last update on Wednesday, October 12, 2005
ImageSize  = width:510 height:100
PlotArea   = width:460 height:30 left:20 bottom:30
TimeAxis   = orientation:horizontal
Period     = from:0 till:54
ScaleMajor = unit:year increment:10 start:0
ScaleMinor = unit:year increment:1 start:0
AlignBars  = early
Colors     =
  id:canvas value:gray(0.9)
BackgroundColors = canvas:canvas
PlotData =
  width:15 color:red
  bar:test from:0 till:46 shift:(0,15) align:center text:[[Dreizehn Kolonien]]
  width:15 color:blue
  bar:test from:46 till:50 shift:(0,15) align:center text:[[Irland]]
  width:15 color:white
  bar:test from:50 till:52 shift:(0,25) align:center text:[[England]]
  width:15 color:red
  bar:test from:52 till:53 shift:(0,35) align:center text:[[Schottland]]
  width:15 color:blue
  bar:test from:53 till:54 shift:(0,45) align:center text:[[Westindien]]
TextData =
  pos:(5,100) fontsize:M
  text:Geburtsorte der Gründerväter
| Gründerväter der Vereinigten Staaten | top next |

First version by Sebastian Wallroth ? on Friday, October 7, 2005, last update on Wednesday, October 12, 2005
ImageSize  = width:510 height:100
PlotArea   = width:460 height:30 left:20 bottom:30
TimeAxis   = orientation:horizontal
Period     = from:0 till:54
ScaleMajor = unit:year increment:10 start:0
ScaleMinor = unit:year increment:1 start:0
AlignBars  = early
Colors     =
  id:canvas value:gray(0.9)
BackgroundColors = canvas:canvas
PlotData =
  width:15 color:red
  bar:test from:0 till:1 shift:(0,15) align:right text:90+
  width:15 color:blue
  bar:test from:1 till:4 shift:(0,15) align:center text:80+
  width:15 color:white
  bar:test from:4 till:19 shift:(0,15) align:center text:70+
  width:15 color:red
  bar:test from:19 till:39 shift:(0,15) align:center text:60+
  width:15 color:blue
  bar:test from:39 till:47 shift:(0,15) align:center text:50+
  width:15 color:white
  bar:test from:47 till:52 shift:(0,15) align:center text:40+
  width:15 color:red
  bar:test from:52 till:54 shift:(0,15) align:center text:30+
TextData =
  pos:(5,100) fontsize:M
  text:Sterbealter der Gründerväter
| Yundum | top next |

First version by Atamari on Wednesday, October 5, 2005, last update on Thursday, July 13, 2006
ImageSize  = width:238 height:120
PlotArea = width:80% height:70% left:20% bottom:20%
AlignBars  = late

DateFormat = yyyy
Period     = from:0 till:10000
TimeAxis   = orientation:vertical
ScaleMajor = increment:2000 start:0

PlotData=
  color:drabgreen
  bar:1993 from:start till:3545
  bar:2005 from:start till:8240
  bar:2006 from:start till:8735

TextData=
  pos:(100,110) fontsize:M text:Einwohnerentwicklung
| Ghana Town | top next |
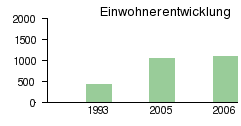
First version by Atamari on Saturday, October 8, 2005, last update on Wednesday, July 12, 2006
ImageSize  = width:238 height:120
PlotArea = width:80% height:70% left:20% bottom:20%
AlignBars  = late

DateFormat = yyyy
Period     = from:0 till:2000
TimeAxis   = orientation:vertical
ScaleMajor = increment:500 start:0

PlotData=
  color:drabgreen
  bar:1993 from:start till:452
  bar:2005 from:start till:1051
  bar:2006 from:start till:1114

TextData=
  pos:(100,110) fontsize:M text:Einwohnerentwicklung
| Bijilo | top next |

First version by Atamari on Saturday, October 8, 2005, last update on Tuesday, July 11, 2006
ImageSize  = width:238 height:120
PlotArea = width:80% height:70% left:20% bottom:20%
AlignBars  = late

DateFormat = yyyy
Period     = from:0 till:8000
TimeAxis   = orientation:vertical
ScaleMajor = increment:2000 start:0

PlotData=
  color:drabgreen
  bar:1993 from:start till:1542
  bar:2005 from:start till:3584
  bar:2006 from:start till:3800

TextData=
  pos:(100,110) fontsize:M text:Einwohnerentwicklung
| Essau | top next |

First version by Atamari on Sunday, October 9, 2005, last update on Tuesday, July 11, 2006
ImageSize  = width:238 height:120
PlotArea = width:80% height:70% left:20% bottom:20%
AlignBars  = late

DateFormat = yyyy
Period     = from:0 till:7500
TimeAxis   = orientation:vertical
ScaleMajor = increment:2500 start:0

PlotData=
  color:drabgreen
  bar:1983 from:start till:2050
  bar:1993 from:start till:4486
  bar:2005 from:start till:5907
  bar:2006 from:start till:6019

TextData=
  pos:(100,110) fontsize:M text:Einwohnerentwicklung
| Template:Zeitleiste Fuldaer Raum | top next |
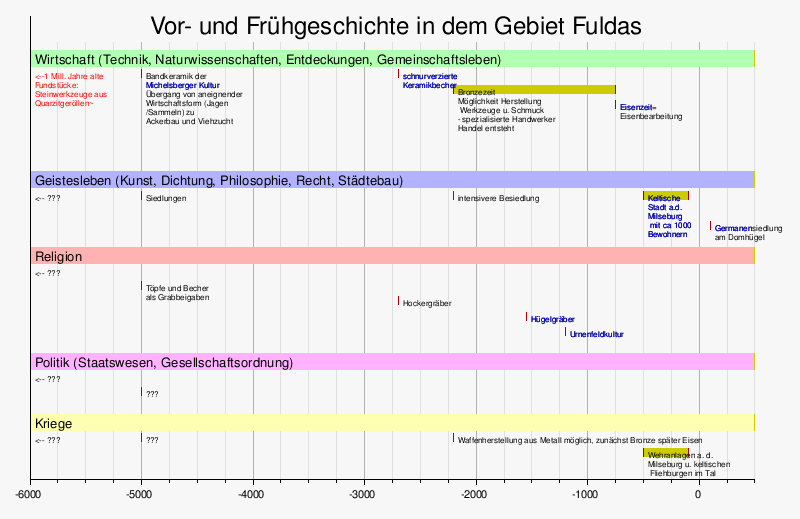
Initial version by Ixitixel on Wednesday, October 12, 2005
Preset    = TimeHorizontal_AutoPlaceBars_UnitYear
ImageSize = width:800 barincrement:16
PlotArea  = left:30 right:45 bottom:40

Colors     =
  id:canvas  value:rgb(0.97,0.97,0.97)
  id:grid1   value:gray(0.7)
  id:grid2   value:gray(0.88)
  id:black   value:rgb(0,0,0)
  id:section value:rgb(0.8,0.8,0)
  id:mark1   value:rgb(0.7,0,0)
  id:years   value:gray(0.5)
  id:eon    value:rgb(1,0.7,1)   # light purple
  id:blau  value:rgb(0.7,0.7,1) # hellblau
  id:rot value:rgb(1,0.7,0.7) # hellrot
  id:grün    value:rgb(0.7,1,0.7) # hellgrün
  id:gelb    value:rgb(1,1,0.7)   # hellgelb
  id:limegreen    value:limegreen #
BackgroundColors = canvas:canvas

Period     = from:-6000 till:500
ScaleMajor = unit:year increment:1000 start:-6000 gridcolor:grid1
ScaleMinor = unit:year increment:250 start:-6000 gridcolor:grid2
AlignBars  = justify

BarData=

  bar:title
# bar:periods
  bar:dummy0 # empty bar functions as separator
  bar:section1
  barset:Wirtschaft
  bar:dummy1
  bar:section2
  barset:Geistesleben
  bar:dummy2
  bar:section3
  barset:Religion
  bar:dummy3
  bar:section4
  barset:Politik
  bar:dummy4
  bar:section5
  barset:Kriege
  bar:dummy5


# explanation: attribute 'barset' instead of 'bar' means consecutive data lines are automatically placed on new bar
#              data lines are lines containing at: or from: & till: attributes
#              'barset:break' means 'reset barcounter' = next line will be placed at first bar in barset
#              'barset:skip'  means 'increment barcounter' = skip one bar for next data line (to allow extra space
#                                                                              for text containing line break = ~)
PlotData =

  mark:(line,black)
  width:16
  fontsize:S


  fontsize:M
  width:16
  color:section
  mark:(line,section)
  shift:(5,-6)

  bar:title    from:start till:end text:"Vor- und Frühgeschichte in dem Gebiet Fuldas" fontsize:XL anchor:middle align:center width:25 color:canvas mark:(line,canvas)
  bar:section1 color:grün from:start till:end text:"Wirtschaft (Technik, Naturwissenschaften, Entdeckungen, Gemeinschaftsleben)"
  bar:section2 color:blau from:start till:end text:"Geistesleben (Kunst, Dichtung, Philosophie, Recht, Städtebau)"
  bar:section3 color:rot from:start till:end text:"Religion"
  bar:section4 color:eon from:start till:end text:"Politik (Staatswesen, Gesellschaftsordnung)"
  bar:section5 color:gelb from:start till:end text:"Kriege"


  fontsize:XS
  mark:(line,mark1)
  width:8
  barset:Wirtschaft
  at:-6000 text:"<--1 Mill. Jahre alte~Fundstücke:~Steinwerkzeuge aus~Quarzitgeröllen~~~~" textcolor:red
  barset:break

  at:-5000 text:"Bandkeramik der~[[Michelsberger Kultur]]~Übergang von aneignender~Wirtschaftsform (Jagen~/Sammeln) zu~Ackerbau und Viehzucht"
  barset:break
  at:-2700 text:"[[Schnurkeramikkultur|schnurverzierte~Keramikbecher]]"
  from:-2200 till:-750 text:"Bronzezeit"~Möglichkeit Herstellung~ Werkzeuge u. Schmuck~- spezialisierte Handwerker~Handel entsteht"
 at:-750 text:"[[Eisenzeit]]=~Eisenbearbeitung

  barset:skip
  barset:skip
  barset:skip

  fontsize:XS
  barset:Geistesleben
    at:-6000 text:"<-- ???"
  barset:skip
  barset:break
  at:-5000 text:"Siedlungen"
  barset:break
  at:-2200 text:"intensivere Besiedlung"
  barset:break
  from:-500 till:-100 text:"[[Oppidum Milseburg|Keltische~Stadt a.d.~Milseburg~ mit ca 1000~Bewohnern]]"
  barset:skip
  at:100 text:"[[Germanen]]siedlung~am Domhügel"


  barset:Religion
    at:-6000 text:"<-- ???"
    at:-5000 text:"Töpfe und Becher~als Grabbeigaben"
    at:-2700 text:"Hockergräber"
    at:-1550 text:"[[Hügelgrab|Hügelgräber]]"
    at:-1200 text:"[[Urnenfeldkultur]]"


  barset:Politik
    at:-6000 text:"<-- ???"
  at:-5000 text:"???"


  barset:Kriege
  at:-6000 text:"<-- ???"
  barset:break
  at:-5000 text:"???"
  barset:break
  at:-2200 text:"Waffenherstellung aus Metall möglich, zunächst Bronze später Eisen"
   from:-500 till:-100 text:"Wehranlagen a. d.~Milseburg u. keltischen~ Fliehburgen im Tal"

TextData =
  textcolor:black fontsize:XS
  pos:(30,2)  text:
  pos:(620,2) text:
| Template:Zeitleiste Deutsche Pfadfinderschaft Sankt Georg | top next |

First version by Ixitixel on Wednesday, October 12, 2005, last update on Sunday, March 12, 2006
ImageSize  = width:855 height:400
PlotArea   = width:720 height:375 left:130 bottom:20
AlignBars  = justify
#Dateformat = dd/mm/yyyy # European date format

Colors =
  id:Verband value:rgb(0.7,0.7,1) # light yellow
  id:Ereignisse value:rgb(1,0.7,0.7) # light red
  id:Diözesen   value:rgb(1,1,0.7)   # light blue

Period      = from:1920 till:2005
TimeAxis    = orientation:horizontal
ScaleMajor  = unit:year increment:20 start:1920
ScaleMinor  = unit:year increment:10 start:1930

PlotData=
  align:center textcolor:black fontsize:8 mark:(line,black) width:25 shift:(0,-5)
  bar:Bundesverband color:Verband
  from: 1929   till: end    text:DPSG
  from: 1938   till: 1945   text:"Verbot durch~Hitler-Regime" shift:(0,2) color:White
  bar:Aachen color:Diözesen
  from: 1930   till: end    text:Diözesanverband Aachen
  bar:Augsburg color:Diözesen
  from: 1932   till: end    text:Diözesanverband Augsburg
  bar:Bamberg color:Diözesen
  from: 1931   till: end    text:Diözesanverband Bamberg
  bar:Berlin color:Diözesen
  from: 1929   till: end    text:Diözesanverband Berlin
  bar:Essen color:Diözesen
  from: 1959   till: end    text:Diözesanverband Essen
  bar:Freiburg color:Diözesen
  from: 1932   till: end    text:Diözesanverband Freiburg
  bar:Fulda color:Diözesen
  from: 1931   till: end    text:Diözesanverband Fulda
  bar:Hamburg color:Diözesen
  from: 1995   till: end    align:right text:Diözesanverband Hamburg
  bar:Hildesheim color:Diözesen
  from: 1949   till: end    align:right text:Diözesanverband Hildesheim
  bar:Münster color:Diözesen
  from: 1932   till: end    text:Diözesanverband Münster
  bar:Paderborn color:Diözesen
  from: 1931   till: end    text:Diözesanverband Paderborn
  bar:Passau color:Diözesen
  from: 1952   till: end    text:Diözesanverband Passau
  bar:Regensburg color:Diözesen
  from: 1931   till: end    text:Diözesanverband Regensburg
  bar:Rottenburg-Stuttgart color:Diözesen
  from: 1932   till: end    text:Diözesanverband Rottenburg-Stuttgart
  bar:Speyer color:Diözesen
  from: 1930   till: end    text:Diözesanverband Speyer
  bar:Ereignisse color:Ereignisse
  from: 1971   till: end    text:Öffnung der DPSG für Mädchen und Frauen
| Lamin (Gambia) | top next |
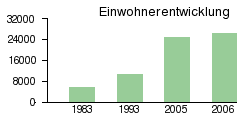
First version by Atamari on Sunday, October 16, 2005, last update on Wednesday, July 12, 2006
ImageSize  = width:238 height:120
PlotArea = width:80% height:70% left:20% bottom:20%
AlignBars  = late

DateFormat = yyyy
Period     = from:0 till:32000
TimeAxis   = orientation:vertical
ScaleMajor = increment:8000 start:0

PlotData=
  color:drabgreen
  bar:1983 from:start till:5798
  bar:1993 from:start till:10668
  bar:2005 from:start till:24797
  bar:2006 from:start till:26287

TextData=
  pos:(100,110) fontsize:M text:Einwohnerentwicklung
| Gunjur | top next |

First version by Atamari on Sunday, October 16, 2005, last update on Wednesday, July 12, 2006
ImageSize  = width:238 height:120
PlotArea = width:80% height:70% left:20% bottom:20%
AlignBars  = late

DateFormat = yyyy
Period     = from:0 till:20000
TimeAxis   = orientation:vertical
ScaleMajor = increment:5000 start:0

PlotData=
  color:drabgreen
  bar:1963 from:start till:3561
  bar:1973 from:start till:4677
  bar:1983 from:start till:7115
  bar:1993 from:start till:9983
  bar:2005 from:start till:14088
  bar:2006 from:start till:14364

TextData=
  pos:(100,110) fontsize:M text:Einwohnerentwicklung
| Tendaba | top next |

First version by Atamari on Sunday, October 16, 2005, last update on Thursday, July 13, 2006
ImageSize  = width:238 height:120
PlotArea = width:80% height:70% left:20% bottom:20%
AlignBars  = late

DateFormat = yyyy
Period     = from:0 till:1000
TimeAxis   = orientation:vertical
ScaleMajor = increment:250 start:0

PlotData=
  color:drabgreen
  bar:1993 from:start till:385
  bar:2005 from:start till:420
  bar:2006 from:start till:421

TextData=
  pos:(100,110) fontsize:M text:Einwohnerentwicklung
| Bansang | top next |

First version by Atamari on Wednesday, October 19, 2005, last update on Tuesday, July 11, 2006
ImageSize  = width:238 height:120
PlotArea = width:80% height:70% left:20% bottom:20%
AlignBars  = late

DateFormat = yyyy
Period     = from:0 till:8000
TimeAxis   = orientation:vertical
ScaleMajor = increment:2000 start:0

PlotData=
  color:drabgreen
  bar:1983 from:start till:3963
  bar:1993 from:start till:5971
  bar:2005 from:start till:7615
  bar:2006 from:start till:7732

TextData=
  pos:(100,110) fontsize:M text:Einwohnerentwicklung
| Template:Zeitleiste Bürgermeister der Gemeinde Freigericht (Hessen) | top next |

First version by 213.138.54.66 on Thursday, October 20, 2005, last update on Tuesday, March 7, 2006
ImageSize  = width:240 height:400
PlotArea   = left:40 right:0 bottom:60 top:10
Legend     = orientation:horizontal position:bottom

DateFormat = dd/mm/yyyy
Period     = from:01/01/1970 till:31/12/2010
TimeAxis   = orientation:vertical format:yyyy

ScaleMajor = unit:year increment:5 start:1970
ScaleMinor = unit:year increment:1 start:1970

Colors=
 id:CDU	value:black	legend:CDU
 id:SPD	value:red	legend:SPD
 id:UWG value:orange	legend:UWG

PlotData=
 bar:Bürgermeister color:black width:15 fontsize:M align:left shift:(20,-5) mark:(line,white)

 from:01/01/1970 till:10/07/1970 shift:(20,-15) text:Georg_Kreis color:CDU
 from:11/07/1970 till:30/09/1971 text:Dr._Horst_Eberhard_Theis color:CDU
 from:01/10/1971 till:30/09/1975 text:Robert_Braatz color:CDU
 from:01/10/1975 till:15/03/1986 text:Franz_Schilling color:CDU
 from:16/03/1986 till:21/12/1988 text:Walter_Streb color:CDU
 from:01/01/1989 till:31/12/2006 text:Manfred_W._Franz color:CDU
| Gambisara | top next |
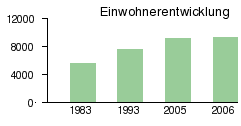
First version by Atamari on Thursday, October 20, 2005, last update on Wednesday, July 12, 2006
ImageSize  = width:238 height:120
PlotArea = width:80% height:70% left:20% bottom:20%
AlignBars  = late

DateFormat = yyyy
Period     = from:0 till:12000
TimeAxis   = orientation:vertical
ScaleMajor = increment:4000 start:0

PlotData=
  color:drabgreen
  bar:1983 from:start till:5572
  bar:1993 from:start till:7702
  bar:2005 from:start till:9210
  bar:2006 from:start till:9314

TextData=
  pos:(100,110) fontsize:M text:Einwohnerentwicklung
| Brufut | top next |

First version by Atamari on Thursday, October 20, 2005, last update on Tuesday, July 11, 2006
ImageSize  = width:238 height:120
PlotArea = width:80% height:70% left:20% bottom:20%
AlignBars  = late

DateFormat = yyyy
Period     = from:0 till:25000
TimeAxis   = orientation:vertical
ScaleMajor = increment:5000 start:0

PlotData=
  color:drabgreen
  bar:1983 from:start till:5121
  bar:1993 from:start till:8644
  bar:2005 from:start till:20092
  bar:2006 from:start till:21299

TextData=
  pos:(100,110) fontsize:M text:Einwohnerentwicklung
| Template:Ligazugehörigkeit Eintracht Frankfurt | top next |
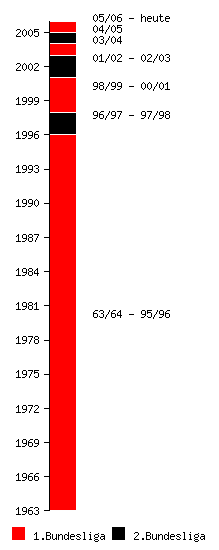
First version by Snipermatze on Thursday, October 20, 2005, last update on Friday, October 21, 2005
ImageSize = width:220 height:550
PlotArea  = left:50 right:0 bottom:40 top:20
Legend    = columns:2 left:15 top:25 columnwidth:100

DateFormat = yyyy
Period     = from:1963 till:2006
TimeAxis   = orientation:vertical format:yyyy
ScaleMajor = unit:year increment:3 start:1963

Colors=
  id:ErsteLiga  value:red legend:1.Bundesliga
  id:ZweiteLiga  value:black    legend:2.Bundesliga

PlotData=
  bar:Leaders width:25 mark:(line,white) align:left fontsize:S

  from:start till:1996 shift:(25,5)  color:ErsteLiga text: 63/64 - 95/96
  from:1996  till:1998 shift:(25,5)    color:ZweiteLiga text: 96/97 - 97/98
  from:1998  till:2001  shift:(25,5)  color:ErsteLiga text: 98/99 - 00/01
  from:2001  till:2003  shift:(25,5)  color:ZweiteLiga text: 01/02 - 02/03
  from:2003  till:2004  shift:(25,5)  color:ErsteLiga text: 03/04
  from:2004  till:2005  shift:(25,5)  color:ZweiteLiga text: 04/05
  from:2005  till:end  shift:(25,5)  color:ErsteLiga text: 05/06 - heute
| Sanyang | top next |

First version by Atamari on Sunday, October 23, 2005, last update on Thursday, July 13, 2006
ImageSize  = width:238 height:120
PlotArea = width:80% height:70% left:20% bottom:20%
AlignBars  = late

DateFormat = yyyy
Period     = from:0 till:7500
TimeAxis   = orientation:vertical
ScaleMajor = increment:2500 start:0

PlotData=
  color:drabgreen
  bar:1983 from:start till:1843
  bar:1993 from:start till:4435
  bar:2005 from:start till:5333
  bar:2006 from:start till:5532

TextData=
  pos:(100,110) fontsize:M text:Einwohnerentwicklung
| Bwiam | top next |
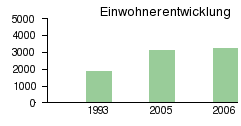
First version by Atamari on Sunday, October 23, 2005, last update on Tuesday, July 11, 2006
ImageSize  = width:238 height:120
PlotArea = width:80% height:70% left:20% bottom:20%
AlignBars  = late

DateFormat = yyyy
Period     = from:0 till:5000
TimeAxis   = orientation:vertical
ScaleMajor = increment:1000 start:0

PlotData=
  color:drabgreen
  bar:1993 from:start till:1851
  bar:2005 from:start till:3152
  bar:2006 from:start till:3269

TextData=
  pos:(100,110) fontsize:M text:Einwohnerentwicklung
| Salikenne | top next |

First version by Atamari on Saturday, October 29, 2005, last update on Thursday, July 13, 2006
ImageSize  = width:238 height:120
PlotArea = width:80% height:70% left:20% bottom:20%
AlignBars  = late

DateFormat = yyyy
Period     = from:0 till:5000
TimeAxis   = orientation:vertical
ScaleMajor = increment:1000 start:0

PlotData=
  color:drabgreen
  bar:1983 from:start till:3362
  bar:1993 from:start till:3560
  bar:2005 from:start till:3805
  bar:2006 from:start till:3817

TextData=
  pos:(100,110) fontsize:M text:Einwohnerentwicklung
| Kuntaur | top next |
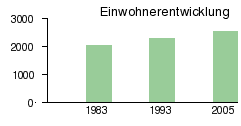
First version by Atamari on Saturday, October 29, 2005, last update on Wednesday, July 12, 2006
ImageSize  = width:238 height:120
PlotArea = width:80% height:70% left:20% bottom:20%
AlignBars  = late

DateFormat = yyyy
Period     = from:0 till:3000
TimeAxis   = orientation:vertical
ScaleMajor = increment:1000 start:0

PlotData=
  color:drabgreen
  bar:1983 from:start till:2059
  bar:1993 from:start till:2286
  bar:2005 from:start till:2534
  bar:2005 from:start till:2540

TextData=
  pos:(100,110) fontsize:M text:Einwohnerentwicklung
| Garowol | top next |
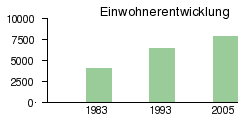
First version by Atamari on Saturday, October 29, 2005, last update on Wednesday, July 12, 2006
ImageSize  = width:238 height:120
PlotArea = width:80% height:70% left:20% bottom:20%
AlignBars  = late

DateFormat = yyyy
Period     = from:0 till:10000
TimeAxis   = orientation:vertical
ScaleMajor = increment:2500 start:0

PlotData=
  color:drabgreen
  bar:1983 from:start till:4128
  bar:1993 from:start till:6512
  bar:2005 from:start till:7781
  bar:2005 from:start till:7884

TextData=
  pos:(100,110) fontsize:M text:Einwohnerentwicklung
| Sabi | top next |

First version by Atamari on Saturday, October 29, 2005, last update on Thursday, July 13, 2006
ImageSize  = width:238 height:120
PlotArea = width:80% height:70% left:20% bottom:20%
AlignBars  = late

DateFormat = yyyy
Period     = from:0 till:10000
TimeAxis   = orientation:vertical
ScaleMajor = increment:2500 start:0

PlotData=
  color:drabgreen
  bar:1983 from:start till:4128
  bar:1993 from:start till:4734
  bar:2005 from:start till:7738
  bar:2006 from:start till:7976

TextData=
  pos:(100,110) fontsize:M text:Einwohnerentwicklung
| Sibanor | top next |

First version by Atamari on Saturday, October 29, 2005, last update on Thursday, July 13, 2006
ImageSize  = width:238 height:120
PlotArea = width:80% height:70% left:20% bottom:20%
AlignBars  = late

DateFormat = yyyy
Period     = from:0 till:7500
TimeAxis   = orientation:vertical
ScaleMajor = increment:2500 start:0

PlotData=
  color:drabgreen
  bar:1993 from:start till:2631
  bar:2005 from:start till:3891
  bar:2006 from:start till:3990

TextData=
  pos:(100,110) fontsize:M text:Einwohnerentwicklung
| Busumbala | top next |

First version by Atamari on Sunday, October 30, 2005, last update on Tuesday, July 11, 2006
ImageSize  = width:238 height:120
PlotArea = width:80% height:70% left:20% bottom:20%
AlignBars  = late

DateFormat = yyyy
Period     = from:0 till:10000
TimeAxis   = orientation:vertical
ScaleMajor = increment:2500 start:0

PlotData=
  color:drabgreen
  bar:1993 from:start till:3619
  bar:2005 from:start till:8412
  bar:2006 from:start till:8917

TextData=
  pos:(100,110) fontsize:M text:Einwohnerentwicklung
| Wellingara | top next |

First version by Atamari on Sunday, October 30, 2005, last update on Thursday, July 13, 2006
ImageSize  = width:238 height:120
PlotArea = width:80% height:70% left:20% bottom:20%
AlignBars  = late

DateFormat = yyyy
Period     = from:0 till:12000
TimeAxis   = orientation:vertical
ScaleMajor = increment:4000 start:0

PlotData=
  color:drabgreen
  bar:1983 from:start till:2135
  bar:1993 from:start till:7663
  bar:2005 from:start till:9456
  bar:2006 from:start till:10257

TextData=
  pos:(100,110) fontsize:M text:Einwohnerentwicklung
| Allunhari | top next |

First version by Atamari on Sunday, October 30, 2005, last update on Tuesday, July 11, 2006
ImageSize  = width:238 height:120
PlotArea = width:80% height:70% left:20% bottom:20%
AlignBars  = late

DateFormat = yyyy
Period     = from:0 till:6000
TimeAxis   = orientation:vertical
ScaleMajor = increment:2000 start:0

PlotData=
  color:drabgreen
  bar:1983 from:start till:2914
  bar:1993 from:start till:4571
  bar:2005 from:start till:5443
  bar:2006 from:start till:5515

TextData=
  pos:(100,110) fontsize:M text:Einwohnerentwicklung
| Diabugu | top next |

First version by Atamari on Sunday, October 30, 2005, last update on Tuesday, July 11, 2006
ImageSize  = width:238 height:120
PlotArea = width:80% height:70% left:20% bottom:20%
AlignBars  = late

DateFormat = yyyy
Period     = from:0 till:5000
TimeAxis   = orientation:vertical
ScaleMajor = increment:1000 start:0

PlotData=
  color:drabgreen
  bar:1993 from:start till:2874
  bar:2005 from:start till:3722
  bar:2006 from:start till:3790

TextData=
  pos:(100,110) fontsize:M text:Einwohnerentwicklung
| Koina | top next |
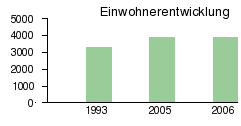
First version by Atamari on Sunday, October 30, 2005, last update on Wednesday, July 12, 2006
ImageSize  = width:238 height:120
PlotArea = width:80% height:70% left:20% bottom:20%
AlignBars  = late

DateFormat = yyyy
Period     = from:0 till:5000
TimeAxis   = orientation:vertical
ScaleMajor = increment:1000 start:0

PlotData=
  color:drabgreen
  bar:1993 from:start till:3300
  bar:2005 from:start till:3870
  bar:2006 from:start till:3909

TextData=
  pos:(100,110) fontsize:M text:Einwohnerentwicklung
| Badja Kunda | top next |

First version by Atamari on Sunday, October 30, 2005, last update on Tuesday, July 11, 2006
ImageSize  = width:238 height:120
PlotArea = width:80% height:70% left:20% bottom:20%
AlignBars  = late

DateFormat = yyyy
Period     = from:0 till:4000
TimeAxis   = orientation:vertical
ScaleMajor = increment:1000 start:0

PlotData=
  color:drabgreen
  bar:1993 from:start till:2846
  bar:2005 from:start till:3568
  bar:2006 from:start till:3623

TextData=
  pos:(100,110) fontsize:M text:Einwohnerentwicklung
| Template:Zeitleiste Wichtige Philosophen | top next |
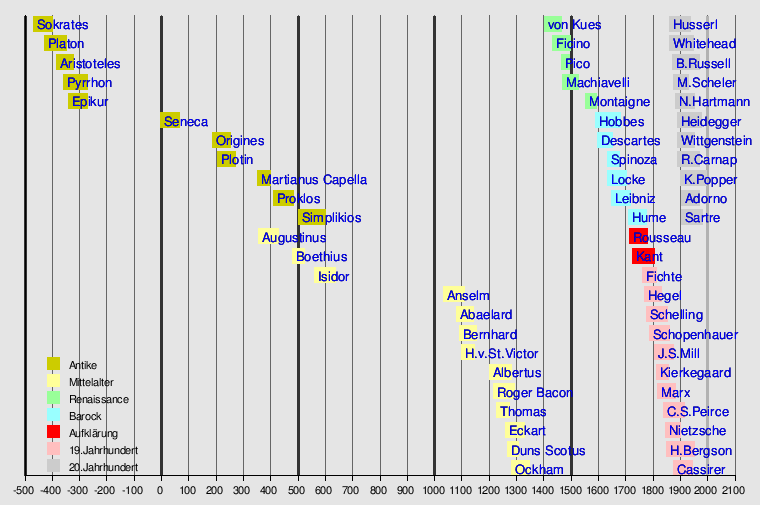
First version by Markus Mueller on Sunday, November 6, 2005, last update on Tuesday, May 16, 2006
Preset    = TimeHorizontal_AutoPlaceBars_UnitYear
ImageSize = width:760

Colors =
  id:White         value:gray(0.9)
  id:lightGray     value:gray(0.7)
  id:gray          value:gray(0.4)
  id:darkGray      value:gray(0.2)

  id:ant      value:rgb(0.8,0.8,0)   legend:Antike
  id:mit      value:rgb(1,1,0.6)     legend:Mittelalter
  id:ren      value:rgb(0.6,1,0.6)   legend:Renaissance
  id:bar      value:rgb(0.6,1,1)     legend:Barock
  id:auf      value:rgb(1,0,0)       legend:Aufklärung
  id:neu      value:rgb(1,0.75,0.75) legend:19.Jahrhundert
  id:zwa      value:rgb(0.8,0.8,0.8) legend:20.Jahrhundert

BackgroundColors = canvas:White

Period     = from:-500 till:2100
ScaleMajor = unit:year increment:100 start:-500 gridcolor:gray
Legend     = orientation:vertical left:49 top:150

LineData =
  at:-500 color:darkGray layer:back
  at:0 color:darkGray layer:back
  at:500 color:darkGray layer:back
  at:1000 color:darkGray layer:back
  at:1500 color:darkGray layer:back
  at:2000 color:lightGray layer:back

BarData=
  barset:Philosophen

PlotData=

# set defaults
  width:15 fontsize:M textcolor:black align:left anchor:from shift:(4,-6)

  barset:Philosophen
# from:-625 till:-545 color:ant text:[[Thales von Milet|Thales]]
 from:-469 till:-399  color:ant text:[[Sokrates]]
 from:-427  till:-347  color:ant text:[[Platon]]
 from:-384  till:-322 color:ant text:[[Aristoteles]]
 from:-360  till:-270 color:ant text:[[Pyrrhon von Elis|Pyrrhon]]
 from:-341 till:-270  color:ant text:[[Epikur]]
 from:-4  till:65 color:ant text:[[Seneca]]
 from:185 till:253 color:ant text:[[Origines]]
 from:205 till:270 color:ant text:[[Plotin]]
 from:350 till:400 color:ant text:[[Martianus Capella]]
 from:410 till:485 color:ant text:[[Proklos]]
 from:500 till:599 color:ant text:[[Simplikios]]
 from:354 till:430 color:mit text:[[Augustinus]]
 from:480 till:524 color:mit text:[[Boethius]]
 from:560 till:636 color:mit text:[[Isidor von Sevilla|Isidor]]
 from:1033 till:1109 color:mit text:[[Anselm von Canterbury|Anselm]]
 from:1079 till:1142 color:mit text:[[Abaelard]]
 from:1090 till:1153 color:mit text:[[Bernhard von Clairvaux|Bernhard]]
 from:1097 till:1147 color:mit text:[[Hugo von Sankt Victor|H.v.St.Victor]]
 from:1200 till:1280 color:mit text:[[Albertus Magnus|Albertus]]
 from:1214 till:1294 color:mit text:[[Roger Bacon]]
 from:1225 till:1274 color:mit text:[[Thomas von Aquin|Thomas]]
 from:1260 till:1328 color:mit text:[[Meister Eckart|Eckart]]
 from:1266 till:1308 color:mit text:[[Johannes Duns Scotus|Duns Scotus]]
 from:1280 till:1347 color:mit text:[[Wilhelm von Ockham|Ockham]]
 barset:break
 from:1401 till:1464 color:ren text:[[Nikolaus von Kues|von Kues]]
 from:1433 till:1499 color:ren text:[[Marsilio Ficino|Ficino]]
 from:1463 till:1494 color:ren text:[[Pico della Mirandola|Pico]]
 from:1469 till:1527 color:ren text:[[Niccolò Machiavelli|Machiavelli]]
 from:1553 till:1592 color:ren text:[[Michel de Montaigne|Montaigne]]
 from:1588 till:1679 color:bar text:[[Thomas Hobbes|Hobbes]]
 from:1596 till:1650 color:bar text:[[René Descartes|Descartes]]
 from:1632 till:1677 color:bar text:[[Baruch Spinoza|Spinoza]]
 from:1632 till:1704 color:bar text:[[John Locke|Locke]]
 from:1646 till:1716 color:bar text:[[Leibniz]]
 from:1711 till:1776 color:bar text:[[David Hume|Hume]]
 from:1712 till:1778 color:auf text:[[Rousseau]]
 from:1724 till:1804 color:auf text:[[Immanuel Kant|Kant]]
 from:1762 till:1814 color:neu text:[[Fichte]]
 from:1770 till:1831 color:neu text:[[Hegel]]
 from:1775 till:1854 color:neu text:[[Schelling]]
 from:1788 till:1860 color:neu text:[[Arthur Schopenhauer|Schopenhauer]]
 from:1806 till:1873 color:neu text:[[John Stuart Mill|J.S.Mill]]
 from:1813 till:1855 color:neu text:[[Sören Kierkegaard|Kierkegaard]]
 from:1818 till:1883 color:neu text:[[Karl Marx|Marx]]
 from:1839 till:1914 color:neu text:[[Charles Sanders Peirce|C.S.Peirce]]
 from:1844 till:1900 color:neu text:[[Friedrich Nietzsche|Nietzsche]]
 from:1849 till:1951 color:neu text:[[Henri Bergson|H.Bergson]]
 from:1874 till:1945 color:neu text:[[Ernst Cassirer|Cassirer]]
 barset:break
 from:1859 till:1938 color:zwa text:[[Edmund Husserl|Husserl]]
 from:1861 till:1947 color:zwa text:[[Alfred North Whitehead|Whitehead]]
 from:1872 till:1970 color:zwa text:[[Bertrand Russell|B.Russell]]
 from:1874 till:1928 color:zwa text:[[Max Scheler|M.Scheler]]
 from:1882 till:1950 color:zwa text:[[Nicolai Hartmann|N.Hartmann]]
 from:1889 till:1976 color:zwa text:[[Martin Heidegger|Heidegger]]
 from:1889 till:1951 color:zwa text:[[Ludwig Wittgenstein|Wittgenstein]]
 from:1891 till:1970 color:zwa text:[[Rudolf Carnap|R.Carnap]]
 from:1902 till:1994 color:zwa text:[[Karl Raimund Popper|K.Popper]]
 from:1903 till:1969 color:zwa text:[[Theodor W. Adorno|Adorno]]
 from:1905 till:1980 color:zwa text:[[Jean-Paul Sartre|Sartre]]
| Template:Rheinischer Münzverein | top next |

First version by Saharadesertfox on Wednesday, November 9, 2005, last update on Thursday, November 10, 2005
ImageSize	= width:1600 height:740                          #increase hight with new bars (barincrement:20)
PlotArea	= left:10 right:10 top:10 bottom:30
Legend          = left:500 top:130 columns:3 columnwidth:70
TimeAxis	= orientation:horizontal format:yyyy
AlignBars       = Justify
DateFormat      = yyyy
Period          = from:1300 till:1487

Colors =
  id:canvas        value:rgb(0.97,0.97,0.97)	# Hintergrundfarbe
  id:RMV           value:yellow2		# light yellow
  id:Mainz         value:yelloworange
  id:Linedatacolor value:brightblue             # rgb(0.60,0.60,0.60) = hellgrau
  id:Gridcolour    value:rgb(0.70,0.70,0.70)
  id:balkenfarbe01 value:rgb(0.95,0.74,0.36)
  id:Münzverträge  value:drabgreen
  id:Mainz         value:red                    Legend:Mainz
  id:Trier         value:blue                   Legend:Trier
  id:Pfalz         value:green                  Legend:Pfalz
  id:Köln          value:black                  Legend:Köln
  id:Jülich        value:yellow                 Legend:Jülich
  id:Luxembourg    value:purple                 Legend:Luxembourg

BackgroundColors = canvas:canvas

ScaleMajor = unit:year increment:5 start:1340 gridcolor:gridcolour

TimeAxis   = orientation:horizontal format:yyyy

BarData=                        # Auf Sortierung achten
  bar:RMV			# Definition für Überschriftenfeld
  bar:Münzverträge              # Münzvertragsvereinbarungen Goldgulden betreffend
  bar:1354_IX_24
  bar:1371_VIII_10
  bar:1372_III_08
  bar:1374_XI_10
  bar:1385_XI_26
  bar:1386_VI_08
  bar:1391_I_26
  bar:1393/1394
  bar:1399_IX_19
  bar:1404_III_05
  bar:1409_VIII_15
  bar:1417_III_08
  bar:1417_XII_02
  bar:1419_III_20
  bar:1420_V_19
  bar:1425_VI_12
  bar:1425_VIII_15
  bar:1428_ca._(Datum_unbestimmt)
  bar:1437_IX_17
  bar:1444_IV_20
  bar:1454_X_29
  bar:1464_X_11
  bar:1477_VI_29
  bar:1488_IX_01

PlotData=
  width:20 fontsize:8 textcolor:black align:left anchor:from shift:(10,-4) color:balkenfarbe01 # set defaults

  bar:RMV
  from:start till:end  width:58 color:black
  at:1390 Text:Goldgulden_des~Rheinischen_Münzverein shift:(0,13) textcolor:canvas fontsize:XL

# Münzverträge

  bar:Münzverträge
  from:1354 till:end text:Münzverträge_Goldgulden_betreffend color:white
  bar:1354_IX_24
  at:1303 Text:1354_IX_24_=_Mainz/Trier/Köln_(10_Jahre)
  from:1354 till:1364 width:2 color:Mainz
  from:1354 till:1364 width:8 color:Trier
  from:1354 till:1364 width:15 color:Köln shift:(0,-6) Text:FG_3,469_Gramm textcolor:white fontsize:S

  bar:1371_VIII_10
  at:1303 text:1371_VIII_10_=_Trier/Luxembourg_(_4_Jahre)
  from:1371 till:1375 width:8 color:Trier
  from:1371 till:1375 width:15 color:Luxembourg shift:(0,-6)  Text:3,396 textcolor:white fontsize:M

  bar:1372_III_08
  at:1303 text:1372_III_08_=_Trier/Köln_(_2_Jahre)
  from:1372 till:1374 width:8  color:Trier
  from:1372 till:1374 width:15 color:Köln Text:___=_FG_3,469g fontsize:L

  bar:1374_XI_10
  at:1303 text:1374_XI_10_=_Trier/Köln_(_2_Jahre)
  from:1374 till:1376 width:8  color:Trier
  from:1374 till:1376 width:15 color:Köln Text:___=_FG_3,469g fontsize:L

  bar:1385_XI_26
  at:1303 text:1385_XI_26_=_Mainz/Trier/Köln/Pfalz_(10_Jahre)
  from:1385 till:1395 width:2 color:Mainz
  from:1385 till:1395 width:8 color:Trier
  from:1385 till:1395 width:15 color:Köln
  from:1385 till:1395 width:20 color:Pfalz shift:(0,-6) text:3,396 textcolor:white fontsize:L

  bar:1386_VI_08
  at:1303  text:1386_VI_08_=_Mainz/Trier/Köln/Pfalz_(10_Jahre)
  from:1386 till:1396 width:2 color:Mainz
  from:1386 till:1396 width:8 color:Trier
  from:1386 till:1396 width:15 color:Köln
  from:1386 till:1396 width:20 color:Pfalz shift:(0,-6)  text:3,396 textcolor:white fontsize:L

  bar:1391_I_26
  at:1303  text:1391_I_26_=_Mainz/Trier/Köln/Pfalz_(10_Jahre)
  from:1391 till:1401 width:2 color:Mainz
  from:1391 till:1401 width:8 color:Trier
  from:1391 till:1401 width:15 color:Köln
  from:1391 till:1401 width:20 color:Pfalz shift:(0,-6)  text:3,396 textcolor:white fontsize:L

  bar:1393/1394
  at:1303 text:1393/1394_mündliche_Übereinkunft
  from:1393 till:1394 width:8 color:Mainz
  from:1393 till:1394 width:15 color:Trier

  bar:1399_IX_19
  at:1303  text:1399_IX_19_=_Mainz/Trier/Köln/Pfalz_(10_Jahre)
  from:1399 till:1409 width:2 color:Mainz
  from:1399 till:1409 width:8 color:Trier
  from:1399 till:1409 width:15 color:Köln
  from:1399 till:1409 width:20 color:Pfalz shift:(0,-6) text:3,322 textcolor:white fontsize:L

  bar:1404_III_05
  at:1303 text:1404_III_05_=_Mainz/Trier/Köln/Pfalz_(10_Jahre)
  from:1404 till:1414 width:2 color:Mainz
  from:1404 till:1414 width:8 color:Trier
  from:1404 till:1414 width:15 color:Köln
  from:1404 till:1414 width:20 color:Pfalz shift:(0,-6) text:3,322 textcolor:white fontsize:L

  bar:1409_VIII_15
  at:1303 text:1409_VIII_15_=_Mainz/Trier/Köln/_(2_Jahre)
  from:1409 till:1411 width:2 color:Mainz
  from:1409 till:1411 width:8 color:Trier
  from:1409 till:1411 width:15 color:Köln text:___=_3,248 fontsize:L

  bar:1417_III_08
  at:1303 text:1417_III_08_=_Mainz/Trier/Köln/Pfalz_(20_Jahre)
  from:1417 till:1437 width:2 color:Mainz
  from:1417 till:1437 width:8 color:Trier
  from:1417 till:1437 width:15 color:Köln
  from:1417 till:1437 width:20 color:Pfalz  shift:(2,-4) text:3,248 textcolor:white fontsize:L
  at:1437  text:=_Vertrag_kam_nicht_zustande

  bar:1417_XII_02
  at:1303 text:1417_XII_02_=_Mainz/Trier/Pfalz/Jülich_(12_Jahre)
  from:1417 till:1429 width:2 color:Mainz
  from:1417 till:1429 width:8 color:Trier
  from:1417 till:1429 width:15 color:Pfalz
  from:1417 till:1429 width:30 color:Jülich  shift:(0,-6) text:2,953 textcolor:white fontsize:L

  bar:1419_III_20
  at:1303 text:1419_III_20_=_Mainz/Trier/Köln/Pfalz/Jülich_(6_Jahre)
  from:1419 till:1425 width:2 color:Mainz
  from:1419 till:1425 width:8 color:Trier
  from:1419 till:1425 width:15 color:Köln
  from:1419 till:1425 width:20 color:Pfalz
  from:1419 till:1425 width:30 color:Jülich  shift:(0,-6) text:2,777 textcolor:white fontsize:L

  bar:1420_V_19
  at:1303 text:1420_V_19_=_Mainz/Trier/Köln/Pfalz_(12_Jahre)
  from:1420 till:1432 width:2 color:Mainz
  from:1420 till:1432 width:8 color:Trier
  from:1420 till:1432 width:15 color:Köln
  from:1420 till:1432 width:20 color:Pfalz  shift:(0,-6) text:2,777 textcolor:white fontsize:L

  bar:1425_VI_12
  at:1303 text:1425_VI_12_=_Mainz/Trier/Köln/Pfalz_(12_Jahre)
  from:1425 till:1437 width:2 color:Mainz
  from:1425 till:1437 width:8 color:Trier
  from:1425 till:1437 width:15 color:Köln
  from:1425 till:1437 width:20 color:Pfalz shift:(0,-6) text:2,777 textcolor:white fontsize:L

  bar:1425_VIII_15
  at:1303 text:1425_VIII_15_=_Mainz/Trier/Köln/Pfalz/Reichserbkämmerer_Konrad_v._Weinsberg_(12_Jahre)
  from:1425 till:1437 width:2 color:Mainz
  from:1425 till:1437 width:8 color:Trier
  from:1425 till:1437 width:15 color:Köln
  from:1425 till:1437 width:20 color:Pfalz shift:(2,-4) text:2,777 textcolor:white fontsize:L
  at:1437  text:=_Vertrag_kam_nicht_zustande

  bar:1428_ca._(Datum_unbestimmt)
  at:1303 text:1428_um_(Datum_unbestimmt)_=_Mainz/Trier/Köln/Pfalz_(12_Jahre)
  from:1428 till:1440 width:2 color:Mainz
  from:1428 till:1440 width:8 color:Trier
  from:1428 till:1440 width:15 color:Köln
  from:1428 till:1440 width:20 color:Pfalz  shift:(2,-4) text:2,777 textcolor:white fontsize:L

  bar:1437_IX_17
  at:1303 text:1437_IX_17_=_Mainz/Trier/Köln/Pfalz_(6_Jahre)
  from:1437 till:1443 width:2 color:Mainz
  from:1437 till:1443 width:8 color:Trier
  from:1437 till:1443 width:15 color:Köln
  from:1437 till:1443 width:20 color:Pfalz  shift:(2,-4) text:2,777 textcolor:white fontsize:L

  bar:1444_IV_20
  at:1303 text:1444_IV_20_=_Mainz/Trier/Köln/Pfalz_(6_Jahre)
  from:1444 till:1450 width:2 color:Mainz
  from:1444 till:1450 width:8 color:Trier
  from:1444 till:1450 width:15 color:Köln
  from:1444 till:1450 width:20 color:Pfalz  shift:(2,-4) text:2,777 textcolor:white fontsize:L

  bar:1454_X_29
  at:1303 text:1454_X_29_=_Mainz/Trier/Köln/Pfalz_(10_Jahre)
  from:1454 till:1464 width:2 color:Mainz
  from:1454 till:1464 width:8 color:Trier
  from:1454 till:1464 width:15 color:Köln
  from:1454 till:1464 width:20 color:Pfalz shift:(2,-4) text:2,7226 textcolor:white fontsize:L

  bar:1464_X_11
  at:1303 text:1464_X_11_=_Mainz/Trier/Köln/Pfalz_(20_Jahre)
  from:1464 till:1484 width:2 color:Mainz
  from:1464 till:1484 width:8 color:Trier
  from:1464 till:1484 width:15 color:Köln
  from:1464 till:1484 width:20 color:Pfalz shift:(2,-4) text:2,696 textcolor:white fontsize:L

  bar:1477_VI_29
  at:1303 text:1477_VI_29_=_Mainz/Trier/Pfalz/Jülich_(10_Jahre)
  from:1477 till:1487 width:2 color:Mainz
  from:1477 till:1487 width:8 color:Trier
  from:1477 till:1487 width:15 color:Pfalz
  from:1477 till:1487 width:30 color:Jülich shift:(0,-6) text:2,696 textcolor:white fontsize:L

LineData=
# LineData der Münzverträge
  at:1354 color:Münzverträge layer:back width:0.3
  at:1371 color:Münzverträge layer:back
  at:1372 color:Münzverträge layer:back
  at:1374 color:Münzverträge layer:back
  at:1385 color:Münzverträge layer:back
  at:1386 color:Münzverträge layer:back
  at:1391 color:Münzverträge layer:back
  at:1393 color:Münzverträge layer:back
  at:1399 color:Münzverträge layer:back
  at:1404 color:Münzverträge layer:back
  at:1409 color:Münzverträge layer:back
  at:1417 color:Münzverträge layer:back
  at:1419 color:Münzverträge layer:back
  at:1420 color:Münzverträge layer:back
  at:1425 color:Münzverträge layer:back
  at:1425 color:Münzverträge layer:back
  at:1428 color:Münzverträge layer:back
  at:1437 color:Münzverträge layer:back
  at:1444 color:Münzverträge layer:back
  at:1454 color:Münzverträge layer:back
  at:1464 color:Münzverträge layer:back
  at:1477 color:Münzverträge layer:back
| Template:Wasserreichste Flüsse Deutschlands | top next |

First version by Saharadesertfox on Wednesday, November 16, 2005, last update on Wednesday, July 12, 2006
TimeAxis	= orientation:horizontal format:yyyy
ImageSize	= width:800 height:auto barincrement:25
PlotArea 	= left:10 right:10 top:10 bottom:40
AlignBars  	= justify

Colors =
  id:canvas        	value:rgb(0.97,0.97,0.97)


BackgroundColors = canvas:canvas

Period     = from:0 till:2500
ScaleMajor = unit:year increment:100 start:0 gridcolor:drabgreen


BarData=
  barset:Flüsse

PlotData=
  width:20 fontsize:L textcolor:black align:left color:skyblue shift:(0,-6)


  barset:Flüsse

  from:start till:end width:20 color:drabgreen Text:Die_14_wasserreichsten_Flüsse_in_Deutschland fontsize:15  align:center

  from:start till:2300 text:[[Rhein]]_2300_m³/s_(Emmerich)
  from:start till:1470 text:[[Donau]]_1490 m³/s_(Passau)
  from:start till:735  text:[[Inn]]_735_m³/s_(Passau)
  from:start till:700  text:[[Elbe]]_700_m³/s_(Hamburg)
  from:start till:450  text:[[Oder]]_450_m³/s_(Schwedt)
  from:start till:300  text:[[Weser]]_300_m³/s_(Bremerhaven)
  from:start till:290  text:[[Mosel]]_290_m³/s_(Koblenz)
  from:start till:251  text:[[Salzach]]_251_m³/s_(Burghausen)
  from:start till:225  text:[[Main]]_225_m³/s_(Raunheim)
  from:start till:190  text:[[Lech]]_190_m³/s_(Augsburg)
  from:start till:175  text:[[Isar]]_175_m³/s_(Plattling)
  from:start till:145  text:[[Neckar]]_145_m³/s_(Mannheim)
  from:start till:115  text:[[Havel]]_115_m³/s_(Havelberg)
  from:start till:110  text:[[Saale]]_110_m³/s_(Calbe)
| Atlantische Hurrikansaison 2005 | top next |

First version by 84.132.121.63 on Sunday, November 27, 2005, last update on Sunday, April 16, 2006
ImageSize = width:800 height:auto barincrement:20
PlotArea  = top:10 bottom:30 right:130 left:20
AlignBars = early

DateFormat = dd/mm/yyyy
Period     = from:01/05/2005 till:31/01/2006
TimeAxis   = orientation:horizontal
ScaleMajor = grid:black unit:month increment:1 start:01/05/2005
# ScaleMinor = grid:blue unit:day increment:7 start:01/05/2005

Colors     =
  id:canvas      value:rgb(0.97,0.97,0.97)
  id:PA   value:green
  id:GP   value:red

Backgroundcolors = canvas:canvas

BarData =
  barset:Hurrikane
  bar:Monat

PlotData=

  barset:Hurrikane width:5 align:left fontsize:S shift:(5,-4) anchor:till
  from:08/06/2005 till:11/06/2005 color:PA text:"Arlene"
  from:28/06/2005 till:29/06/2005 color:PA text:"Bret"
  from:03/07/2005 till:06/07/2005 color:PA text:"Cindy"
  from:04/07/2005 till:11/07/2005 color:PA text:"Dennis"
  from:11/07/2005 till:21/07/2005 color:PA text:"[[Hurrikan Emily|Emily]]"
  from:21/07/2005 till:29/07/2005 color:PA text:"Franklin"
  from:23/07/2005 till:25/07/2005 color:PA text:"Gert"
  from:02/08/2005 till:08/08/2005 color:PA text:"Harvey"
  from:04/08/2005 till:18/08/2005 color:PA text:"Irene"
  from:22/08/2005 till:23/08/2005 color:PA text:"Jose"
  from:23/08/2005 till:30/08/2005 color:PA text:"[[Hurrikan Katrina|Katrina]]"
  from:28/08/2005 till:02/09/2005 color:PA text:"Lee"
  from:01/09/2005 till:10/09/2005 color:PA text:"Maria"
  from:05/09/2005 till:10/09/2005 color:PA text:"Nate"
  from:06/09/2005 till:17/09/2005 color:PA text:"Ophelia"
  from:17/09/2005 till:23/09/2005 color:PA text:"Philippe"
  from:18/09/2005 till:24/09/2005 color:PA text:"[[Hurrikan Rita|Rita]]"
  from:01/10/2005 till:05/10/2005 color:PA text:"[[Hurrikan Stan|Stan]]"
  from:04/10/2005 till:04/10/2005 color:PA text:"unbenannter Subtropischer Sturm"
  from:05/10/2005 till:06/10/2005 color:PA text:"Tammy"
  from:09/10/2005 till:11/10/2005 color:PA text:"[[Hurrikan Vince|Vince]]"
  from:15/10/2005 till:25/10/2005 color:PA text:"[[Hurrikan Wilma|Wilma]]"
  from:22/10/2005 till:24/10/2005 color:PA text:"[[Tropischer Wirbelsturm Alpha|Alpha]]"
  from:27/10/2005 till:30/10/2005 color:PA text:"Beta"
  from:13/11/2005 till:20/11/2005 color:PA text:"Gamma"
  from:23/11/2005 till:28/11/2005 color:PA text:"Delta"
  from:29/11/2005 till:08/12/2005 color:PA text:"Epsilon"
  from:30/12/2005 till:06/01/2006 color:PA text:"Zeta"
    barset:skip

  bar:Monat width:5 align:center fontsize:S shift:(0,-20) anchor:middle color:canvas
  from:01/05/2005 till:01/06/2005 text:Mai
  from:01/06/2005 till:01/07/2005 text:Juni
  from:01/07/2005 till:01/08/2005 text:Juli
  from:01/08/2005 till:01/09/2005 text:August
  from:01/09/2005 till:01/10/2005 text:September
  from:01/10/2005 till:01/11/2005 text:Oktober
  from:01/11/2005 till:01/12/2005 text:November
  from:01/12/2005 till:31/12/2005 text:Dezember
  from:01/01/2006 till:31/01/2006 text:Januar
| Universitätsbibliothek Stuttgart | top next |

Initial version by Jörg Langner on Tuesday, December 6, 2005
ImageSize  = width:270 height:1220
PlotArea   = width:115 height:1200 left:40 bottom:10
Colors =
  id:red value:rgb(1,0,0)

DateFormat = yyyy
Period     = from:1829 till:2006
TimeAxis   = orientation:vertical
ScaleMajor = unit:year increment:10 start:1930
BackgroundColors = canvas:white
Define $dx = 20 # shift text to right side of bar

PlotData =
  bar:Chairmen color:red width:25 mark:(line,blue) align:left fontsize:S

  from:1829  till:1829 shift:($dx,0)  text:Gründung
  from:1939  till:1945 shift:($dx,0)  text:große Bestandsverluste im 2. WK
  from:1957  till:1957 shift:($dx,0)  text:Neuer Universitätsbereich Vaihingen
  from:1961  till:1962 shift:($dx,0)  text:Neubau Bibliothek der Technischen Hochschule
  from:1962  till:1962 shift:($dx,0)  text:Einweihung des Neubaus
  from:1967  till:1967 shift:($dx,0)  text:Aus Technischer Hochschule wird Universität
  from:1972  till:1972 shift:($dx,0)  text:Unwetter: Wasserschaden
  from:2006  till:2006 shift:($dx,0)  text:Umbau Kataloghalle Stadtmitte
| Kaiserlich-königliche österreichische Staatsbahnen | top next |

First version by Blieb on Thursday, December 8, 2005, last update on Sunday, February 12, 2006
ImageSize  = width:1100 height:1080
PlotArea   = width:1080 height:1060 left:0 bottom:20
TimeAxis  = orientation:horizontal # dummy, required
Period    = from:1825 till:1920 # dummy, required
Define $s = fontsize:M
Colors =
  id:red        value:coral
  id:blue       value:skyblue
  id:green      value:limegreen
  id:yellow     value:yellow
  id:lightgrey  value:gray(0.9)
BackgroundColors = bars:lightgrey canvas:lightgrey
AlignBars=justify
DateFormat = yyyy
ScaleMajor = gridcolor:black unit:year increment:5 start:1830
PlotData=
  bar:MM        from:1839       till:1852 color:green
                at:1840         text:"[[Milano-Monza]]"
                from:1852       till:1858 color:blue
                from:1858       till:1918 color:red
  bar:LVF       from:1844       till:1858 color:orange
                at:1845         text:"[[Lombardisch-Venetianische Ferdinands Eisenbahn-Gesellschaft|LVF]]"
                from:1851       till:1858 color:blue
                at:1854         text:"[[Lombardisch-Venetianische Staatsbahn|LVStB]]"
                from:1858       till:1918 color:red
  bar:Ti        from:1857       till:1858 color:green
                from:1858       till:1918 color:red
                at:1857         text:"[[Tiroler Staatsbahn|Ti]]"
                at:1890         text:"[[Südbahn-Gesellschaft|Südbahn (SB)]]"
  bar:SStB      from:1844       till:1858 color:blue
                from:1858       till:1918 color:red
                at:1845         text:"[[Südliche Staatsbahn]]"
  bar:OStB      from:1846       till:1850 color:green
                from:1850       till:1858 color:orange
                from:1858       till:1892 color:blue
                from:1892       till:1918 color:yellow
                at:1847         text:"[[Krakau-Obersleschische Bahn|Kr.-Ob.]]"
                at:1851         text:"[[Östliche Staatsbahn|Östl. Staatsbahn]]"
                at:1859         text:"[[Carl Ludwig-Bahn]]"
  bar:NStB      from:1845       till:1855 color:blue
                from:1855       till:1909 color:red
                from:1909       till:1918 color:yellow
                at:1846         text:"[[Nördliche Staatsbahn]]"
  bar:SOStB     from:1845       till:1850 color:orange
                from:1850       till:1855 color:green
                from:1855       till:1909 color:red
                from:1909       till:1918 color:yellow
                at:1846         text:"[[Ungarische Zentralbahn|Ung.Zentr.]]"
                at:1851         text:"[[Südöstliche Staatsbahn|SöStB]]"
                at:1886         text:"[[Staats-Eisenbahn-Gesellschaft]] (StEG)"
  bar:Raaber    from:1841       till:1855 color:blue
                from:1855       till:1909 color:red
                from:1909       till:1918 color:yellow
                at:1845         text:"[[Österreichische Ostbahn|Wien-Raaber-Bahn]]"
  bar:BrünnR    from:1856       till:1879 color:green
                from:1879       till:1909 color:red
                from:1909       till:1918 color:yellow
                at:1857         text:"[[Brünn-Rossitzer Eisenbahn]]"
  bar:KFNB      from:1837       till:1906 color:blue
                from:1906       till:1918 color:yellow
                at:1865         text:"[[Österreichische Nordbahn|Kaiser-Ferdinands-Nordbahn]] (KFNB)"
  bar:Pferd     from:1827       till:1859 color:green
                from:1859       till:1884 color:red
                from:1884       till:1918 color:yellow
                at:1835         text:"[[Pferdeeisenbahn Budweis-Linz-Gmunden|Erste Eisenbahn-Gesellschaft]]"
                at:1865         text:"[[Österreichische Westbahn|Kaiserin Elisabeth Bahn]]
  bar:Dalm      from:1877       till:1884 color:blue
                from:1884       till:1918 color:yellow
                at:1878         text:"[[Dalmatiner Staatsbahn|Dalm.Stb.]]"
  bar:Dnie      from:1872       till:1884 color:green
                from:1884       till:1918 color:yellow
                at:1878         text:"[[Dniester Bahn]]"
  bar:Istr      from:1876       till:1884 color:blue
                from:1884       till:1918 color:yellow
                at:1877         text:"[[Istrianer Staatsbahn|Istr.Stb.]]"
  bar:Rakonitz  from:1872       till:1884 color:green
                from:1884       till:1918 color:yellow
                at:1873         text:"[[Rakonitz-Protiviner Bahn]]"
  bar:BCB       from:1881       till:1910 color:blue
                from:1910       till:1918 color:yellow
                at:1890         text:"[[Böhmische Commerzialbahnen]]"
  bar:BNB       from:1865       till:1867 color:blue
                from:1867       till:1883 color:green
                from:1883       till:1908 color:red
                from:1908       till:1918 color:yellow
                at:1865         text:"[[Turnau-Kralup-Prag|TKP]]"
                at:1868         text:"[[Böhmische Nordbahn|Turnau-Kralup-Prag & BNB]]"
                at:1890         text:"[[Böhmische Nordbahn]]"
  bar:BWB       from:1867       till:1894 color:orange
                from:1894       till:1918 color:yellow
                at:1875         text:"[[Böhmische Westbahn]]"
  bar:BozMer    from:1881       till:1906 color:blue
                from:1906       till:1918 color:yellow
                at:1890         text:"[[Bozen-Meraner Bahn]]"
  bar:DuxB      from:1871       till:1892 color:green
                from:1892       till:1918 color:yellow
                at:1875         text:"[[Dux-Bodenbacher Eisenbahn]] (DBE)"
  bar:EPPK      from:1872       till:1884 color:blue
                from:1884       till:1918 color:yellow
                at:1873         text:"[[Eisenbahn Pilsen-Priesen-Komotau)|Pilsen-Priesen(-Komotau)]]"
                at:1900         text:"[[kkStB|kaiserlich-königliche]]"
  bar:EUGE      from:1872       till:1889 color:green
                from:1889       till:1918 color:yellow
                at:1873         text:"[[Erste Ungarisch-Galizische Eisenbahn]]"
                at:1900         text:"[[kkStB|österreichische]]"
  bar:EAB       from:1873       till:1892 color:blue
                from:1892       till:1918 color:yellow
                at:1880         text:"[[Erzherzog Albrecht-Bahn]]"
                at:1900         text:"[[kkStB|Staatsbahnen]]"
  bar:KFJB      from:1868       till:1884 color:green
                from:1884       till:1918 color:yellow
                at:1870         text:"[[Franz-Josefs-Bahn|Kaiser Franz Josefs-Bahn]]"
                at:1900         text:"[[kkStB]]"
  bar:KTB       from:1881       till:1906 color:orange
                from:1906       till:1918 color:yellow
                at:1890         text:"[[Kremstalbahn]]"
  bar:KRB       from:1868       till:1884 color:blue
                from:1884       till:1918 color:yellow
                at:1873         text:"[[Rudolfsbahn|Kronprinz Rudolf-Bahn]]"
  bar:LCJE      from:1866       till:1889 color:green
                from:1889       till:1918 color:yellow2
                at:1871         text:"[[Lemberg-Czernowitz-Jassy Eisenbahn-Gesellschaft|Lemberg-Czernowitz-Jassy Eisenbahn]]"
  bar:MGB       from:1871       till:1895 color:blue
                from:1895       till:1918 color:yellow
                at:1880         text:"[[Mährische Grenzbahn]] (MGB)"
  bar:MSCB      from:1872       till:1895 color:green
                from:1895       till:1918 color:yellow
                at:1873         text:"[[Mährisch-Schlesische Centralbahn]] (MSCB)"
  bar:Mühl      from:1888       till:1900 color:green
                from:1900       till:1918 color:yellow2
                at:1889         text:"[[Mühlkreisbahn]]"
  bar:NÖSWB     from:1877       till:1882 color:blue
                from:1882       till:1918 color:yellow
                at:1878         text:"[[Niderösterreichische Südwestbahnen|NÖSWB]]"
  bar:ÖLEG      from:1880       till:1894 color:green
                from:1894       till:1918 color:yellow
                at:1882         text:"[[Österreichische Lokaleisenbahngesellschaft|ÖLEG]]"
  bar:ÖNWB      from:1868       till:1908 color:red
                from:1908       till:1918 color:yellow
                at:1869         text:"[[Österreichische Nordwestbahn|Österreichische Nordwestbahn (ÖNWB) & Süd-Norddeutsche Verbindungsbahn]]"
  bar:PD        from:1872       till:1892 color:blue
                from:1892       till:1918 color:yellow
                at:1880         text:"[[Prag-Duxer Eisenbahn]] (PD)"
  bar:TL        from:1873       till:1884 color:green
                from:1884       till:1918 color:yellow
                at:1874         text:"[[Tarnow-Leluchower Staatsbahn|Tarnow-Leluchow Stb.]]"
  bar:UWB       from:1871       till:1889 color:blue
                from:1889       till:1918 color:yellow
                at:1874         text:"[[Ungarische Westbahn]] (UWB)"
  bar:VB        from:1872       till:1885 color:green
                from:1885       till:1918 color:yellow
                at:1874         text:"[[Vorarlberger Bahn]] (VB)"
  bar:ATE       from:1858       till:1918 color:orange
                at:1884         text:"[[Aussig-Teplitzer Eisenbahn]] (A.T.E.)"
  bar:BEB       from:1855       till:1918 color:red
                at:1864         text:"[[Buschtiehrader Eisenbahn]] (BEB)"
  bar:NLB       from:1880       till:1918 color:orange
                at:1884         text:"[[Neutitscheiner Lokalbahn]] (NLB)"
  bar:StStB     from:1881       till:1918 color:red
                at:1884         text:"[[Stauding-Stramberger Eisenbahn]] (StStB)"
  bar:KsOd      from:1869       till:1918 color:orange
                at:1874         text:"[[Kaschau-Oderberger Bahn]] (Ks.Od.)"
| Buchhandel, München 1500-1850 | top next |

Initial version by Stefan h on Saturday, December 17, 2005
ImageSize  = width:800 height:1600
PlotArea   = width:768 height:1560 left:32 bottom:20
AlignBars  = justify

Colors =
  id:Hibler         value:rgb(0.8,0.6,0.8)
  id:Hertzroy       value:rgb(1,0.6,0.6)
  id:Straub         value:rgb(1,0.7,0.6)
  id:Schobser       value:rgb(0.7,0.7,1)
  id:Heinrich       value:rgb(0.7,0.9,0.9)
  id:Lutzenkirchner value:rgb(0.8,0.8,1)

DateFormat  = yyyy
Period      = from:1500 till:1870
TimeAxis    = orientation:vertical order:reverse
ScaleMajor  = unit:year increment:50 start:1500
ScaleMinor  = unit:year increment:10 start:1500

Define $dx = -60
Define $dy = 0

PlotData =
  align:left textcolor:black fontsize:8 mark:(line,black) width:128

  bar:Hibler color:Hibler
  from:1698 till:1744 shift:($dx,$dy) text:1698~Johann Hibler~1677-98 Angestellter~der Buchhandlung~von Geldern~Konzession für~kleine Bücher
  from:1744 till:1748 shift:($dx,$dy) text:1744 Johann Hibler, Sohn
  from:1748 till:1753 shift:($dx,$dy) text:1748 Johann Gastl, Kauf
  from:1753 till:1766 shift:($dx,$dy) text:1753~Johann Gastl, Sohn
  from:1766 till:1784 shift:($dx,$dy) text:1766~Johann Nepomuk Fritz~Schwiegersohn
  from:1784 till:1810 shift:($dx,$dy) text:1784~Josef Lentner~heiratet Witwe Fritz
  from:1810 till:1841 shift:($dx,$dy) text:1810~Ignaz Lentner~Sohn
  from:1841 till:1856 shift:($dx,$dy) text:1841~Wilhelm Keck~Kauf
  from:1856 till:1870 shift:($dx,$dy) text:1856-1870

  bar:Hertzroy color:Hertzroy
  from:1609 till:1625 shift:($dx,$dy) text:1609~Johann Hertzroy~aus Ingolstadt
  from:1625 till:1645 shift:($dx,$dy) text:1625~Cornelius Leysser~heiratet Witwe Hertzroy
  from:1645 till:1685 shift:($dx,$dy) text:1645~Johann Wagner~kauft Buchladen~Rindermarkt 3~führt ab 1669 mit~Schwiegerssohn~einen zweiten Laden
  from:1685 till:1691 shift:($dx,$dy) text:1685 von Geldern
  from:1691 till:1701 shift:($dx,$dy) text:1691 Witwe von Geldern
  from:1701 till:1733 shift:($dx,$dy) text:1701-33~Johann Jacob Remy~Schwiegerssohn,~hinterläßt Betrieb~1733 verschuldet
  from:1752 till:1766 shift:($dx,$dy) text:1752~Franz Xaver Crätz~Kauf
  from:1766 till:1786 shift:($dx,$dy) text:1766~Josef Alois Crätz~Sohn~Geschäft~Kaufingerstr. 5
  from:1786 till:1816 shift:($dx,$dy) text:1786~Josef Lindauer
  from:1816 till:1823 shift:($dx,$dy) text:1816 Lindauer, Sohn
  from:1823 till:1852 shift:($dx,$dy) text:1823~C. F. Sauer~ehemaliger~Geschäftsführer~heiratet Witwe Sauer
  from:1852 till:1870 shift:($dx,$dy) text:1852-1870

  bar:Straub color:Straub
  from:1645 till:1692 shift:($dx,$dy) text:1645~Lucas Straub~heiratet Witwe Leysser~erhält Konzession für~Betrieb einer Druckerei
  from:1692 till:1733 shift:($dx,$dy) text:1692~Lucas Straub~Sohn
  from:1733 till:1765 shift:($dx,$dy) text:1733~Johann Jacob Vötter~heiratet Witwe Straub
  from:1765 till:1785 shift:($dx,$dy) text:1765~Anna M. Vötter~Witwe
  from:1785 till:1807 shift:($dx,$dy) text:1785-1807~Anton Franz~ehemaliger Faktor

  bar:Schobser color:Schobser
  from:1500 till:1530 shift:($dx,$dy) text:1500~Johann Schobser~aus Augsburg
  from:1530 till:1564 shift:($dx,$dy) text:1530~Andreas Schobser~Sohn
  from:1564 till:1610 shift:($dx,$dy) text:1564~Adam Berg
  from:1610 till:1629 shift:($dx,$dy) text:1610~Anna Berg~Witwe
  from:1629 till:1634 shift:($dx,$dy) text:1629 A. Berg, Sohn
  from:1634 till:1655 shift:($dx,$dy) text:1634~Michael Segen~heiratet Witwe Berg
  from:1655 till:1668 shift:($dx,$dy) text:1655~Johann Wilhelm Schell~Schwiegersohn
  from:1668 till:1696 shift:($dx,$dy) text:1668~Sebastian Rauch~heiratet Witwe
  from:1696 till:1703 shift:($dx,$dy) text:1696 Rauch, Witwe
  from:1703 till:1723 shift:($dx,$dy) text:1703~Matthias Riedl~Erbe
  from:1723 till:1748 shift:($dx,$dy) text:1723~Magdalena Riedl~Witwe
  from:1748 till:1756 shift:($dx,$dy) color:Straub text:1748 Geschäftsführung~durch Johann Jacob Vötter
  from:1756 till:1785 shift:($dx,$dy) text:1756?~Johann Christoph Mayer~nach dessen Tod~Geschäftsführung~durch Witwe Mayer
  from:1785 till:1826 shift:($dx,$dy) text:1785~Josef Zängl~Schwiegersohn
  from:1826 till:1850 shift:($dx,$dy) text:1826~Josef Rösl~Kauf
  from:1850 till:1868 shift:($dx,$dy) text:1850~Heinrich Rösl~Sohn
  from:1868 till:1870 shift:($dx,-5)  text:1868-1870

  bar:Heinrich color:Heinrich
  from:1597 till:1654 shift:($dx,$dy) text:1597-1654~Nicolaus Heinrich~aus Frankfurt~heiratet Tochter Bergs~in zweiter Ehe;~Papiererswitwe~Margaretha Wurm
  from:1656 till:1710 shift:($dx,$dy) text:1656~Johannes Jäcklin~aus Hüflingen, Schwaben~Konzession für~Druck und Verlag,~später auch für~Buchhandel~Geschäft am Rindermarkt
  from:1710 till:1717 shift:($dx,$dy) text:1710~Susanna Jäcklin, Tochter
  from:1717 till:1750 shift:($dx,$dy) text:1717~Heinrich Theodor v. Cöln~heiratet Jäcklins Tochter
  from:1750 till:1789 shift:($dx,$dy) text:1750~Franz Josef Thuielle~Konzession für~Druck und Verlag
  from:1789 till:1822 shift:($dx,$dy) text:1789~Franz Josef Hübschmann~Kauf
  from:1822 till:1839 shift:($dx,$dy) text:1822~Kajetan Hübschmann &~B. Spockmair
  from:1839 till:1854 shift:($dx,$dy) text:1839~Martin Strazzer~Kauf
  from:1854 till:1870 shift:($dx,$dy) text:1854-1870

  bar:Lutzenkirchner color:Lutzenkirchner
  from:1751 till:1756 shift:($dx,$dy) text:1751 Lutzenkirchner
  from:1756 till:1778 shift:($dx,$dy) text:1756~Johann Theodor Osten~heiratet Witwe~Lutzenkirchner
  from:1778 till:1807 shift:($dx,$dy) text:1778~Johann Baptist Strobl~aus Aichach~Kauf
  from:1807 till:1859 shift:($dx,$dy) text:1807~Ernst August~Fleischmann~Kauf
  from:1859 till:1870 shift:($dx,$dy) text:1859-1870
| Template:Zeitleiste Mobilfunksysteme | top next |
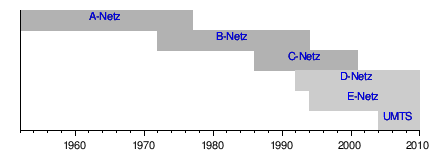
First version by VanGore on Sunday, January 22, 2006, last update on Wednesday, April 19, 2006
ImageSize  = width:440 height:150
PlotArea   = width:400 height:120 left:20 bottom:20
AlignBars  = justify

DateFormat = yyyy
Period     = from:1952 till:2010
TimeAxis   = orientation:horizontal
ScaleMajor = unit:year increment:10 start:1960
ScaleMinor = unit:year increment:2 start:1952

Colors     =
  id:analog        value:gray(0.7)
  id:digital       value:gray(0.8)

BarData=
 bar:A
 bar:B
 bar:C
 bar:D
 bar:E
 bar:UMTS

PlotData=
#  textcolor:white (macht er leider nicht, da es links sind vanGore)

  bar:A width:20 color:analog align:center
  from:start till:1977 text:[[A-Netz]]
#  at:1972 mark:(line,white)

  bar:B width:20 color:analog align:center
  from:1972 till:1994 text:[[B-Netz]]
#  at:1986 mark:(line,white)

  bar:C width:20 color:analog align:center
  from:1986  till:2001 text:[[C-Netz]]
#  at:1992 mark:(line,white)

  bar:D width:20 color:digital align:center
  from:1992  till:end text:[[D-Netz]]

  bar:E width:20 color:digital align:center
  from:1994  till:end text:[[E-Netz]]
#  at:2004 mark:(line,white)

  bar:UMTS width:20 color:digital align:center
  from:2004  till:end text:[[Universal Mobile Telecommunications System|UMTS]]
| Template:Zeitleiste Ciutat Pubilla de la Sardana | top next |
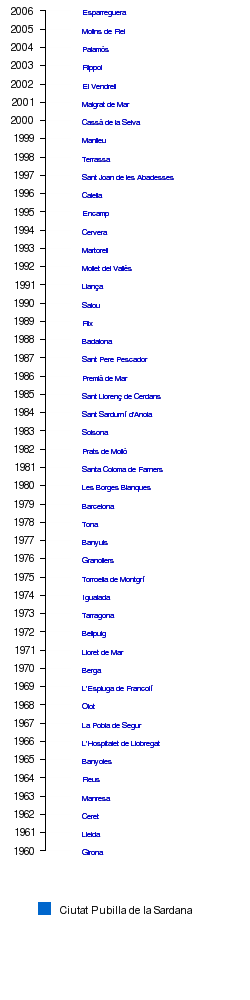
First version by Wamito on Tuesday, January 24, 2006, last update on Thursday, June 1, 2006
ImageSize = width:250 height:1000
PlotArea  = width:30 height:840 left:45 bottom:150
Legend    = columns:1 left:40 top:100
AlignBars = early

DateFormat = yyyy
Period     = from:1960 till:2006
TimeAxis   = orientation:vertical
ScaleMajor = unit:year increment:1 start:1960

Colors=

  id:ger  value:blue      legend: Ciutat_Pubilla_de_la_Sardana


PlotData=
  bar:Leaders width:25 mark:(line,white) align:left fontsize:XS shift:(25,-5) anchor:middle

  from:start till:1960 color:ger   text:"[[Girona]]"
  from:1961  till:1961 color:ger   text:"[[Lleida]]"
  from:1962  till:1962 color:ger   text:"[[Ceret]]"
  from:1963  till:1963 color:ger   text:"[[Manresa]]"
  from:1964  till:1964 color:ger   text:"[[Reus]]"
  from:1965  till:1965 color:ger   text:"[[Banyoles]]"
  from:1966  till:1966 color:ger   text:"[[L'Hospitalet de Llobregat]]"
  from:1967  till:1967 color:ger   text:"[[La Pobla de Segur]]"
  from:1968  till:1968 color:ger   text:"[[Olot]]"
  from:1969  till:1969 color:ger   text:"[[L'Espluga de Francolí]]"
  from:1970  till:1970 color:ger   text:"[[Berga]]"
  from:1971  till:1971 color:ger   text:"[[Lloret de Mar]]"
  from:1972  till:1972 color:ger   text:"[[Bellpuig]]"
  from:1973  till:1973 color:ger   text:"[[Tarragona]]"
  from:1974  till:1974 color:ger   text:"[[Igualada]]"
  from:1975  till:1975 color:ger   text:"[[Torroella de Montgrí]]"
  from:1976  till:1976 color:ger   text:"[[Granollers]]"
  from:1977  till:1977 color:ger   text:"[[Banyuls]]"
  from:1978  till:1978 color:ger   text:"[[Tona]]"
  from:1979  till:1979 color:ger   text:"[[Barcelona]]"
  from:1980  till:1980 color:ger   text:"[[Les Borges Blanques]]"
  from:1981  till:1981 color:ger   text:"[[Santa Coloma de Farners]]"
  from:1982  till:1982 color:ger   text:"[[Prats de Molló]]"
  from:1983  till:1983 color:ger   text:"[[Solsona]]"
  from:1984  till:1984 color:ger   text:"[[Sant Sardurní d'Anoia]]"
  from:1985  till:1985 color:ger   text:"[[Sant Llorenç de Cerdans]]"
  from:1986  till:1986 color:ger   text:"[[Premià de Mar]]"
  from:1987  till:1987 color:ger   text:"[[Sant Pere Pescador]]"
  from:1988  till:1988 color:ger   text:"[[Badalona]]"
  from:1989  till:1989 color:ger   text:"[[Flix]]"
  from:1990  till:1990 color:ger   text:"[[Salou]]"
  from:1991  till:1991 color:ger   text:"[[Llança]]"
  from:1992  till:1992 color:ger   text:"[[Mollet del Vallès]]"
  from:1993  till:1993 color:ger   text:"[[Martorell]]"
  from:1994  till:1994 color:ger   text:"[[Cervera]]"
  from:1995  till:1995 color:ger   text:"[[Encamp]]"
  from:1996  till:1996 color:ger   text:"[[Calella]]"
  from:1997  till:1997 color:ger   text:"[[Sant Joan de les Abadesses]]"
  from:1998  till:1998 color:ger   text:"[[Terrassa]]"
  from:1999  till:1999 color:ger   text:"[[Manlleu]]"
  from:2000  till:2000 color:ger   text:"[[Cassà de la Selva]]"
  from:2001  till:2001 color:ger   text:"[[Malgrat de Mar]]"
  from:2002  till:2002 color:ger   text:"[[El Vendrell]]"
  from:2003  till:2003 color:ger   text:"[[Rippol]]"
  from:2004  till:2004 color:ger   text:"[[Palamós]]"
  from:2005  till:2005 color:ger   text:"[[Molins de Rei]]"
  from:2006  till:2006 color:ger   text:"[[Esparreguera]]"
| Thalia (Buchhandel) | top next |

Initial version by 62.47.37.94 ? on Wednesday, January 11, 2006
ImageSize  = width:150 height:200
PlotArea   = width:100 height:150 left:50 bottom:20
AlignBars  = late

DateFormat = yyyy
Period     = from:0 till:3500
TimeAxis   = orientation:vertical
ScaleMajor = unit:year increment:500 start:0

PlotData=
  color:green width:20
  bar:2003 from:start till:2405
  bar:2004 from:start till:2792
  bar:2005 from:start till:3097

TextData=
  pos:(20,110) fontsize:M text:
| Thalia (Buchhandel) | top next |
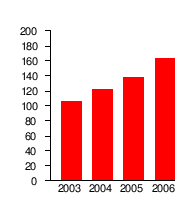
Initial version by 62.47.37.94 ? on Wednesday, January 11, 2006
ImageSize  = width:175 height:200
PlotArea   = width:125 height:150 left:50 bottom:20
AlignBars  = late

DateFormat = yyyy
Period     = from:0 till:200
TimeAxis   = orientation:vertical
ScaleMajor = unit:year increment:20 start:0

PlotData=
  color:red width:20
  bar:2003 from:start till:106
  bar:2004 from:start till:122
  bar:2005 from:start till:138
  bar:2006 from:start till:163

TextData=
  pos:(20,110) fontsize:M text:
| Thalia (Buchhandel) | top next |
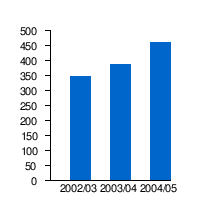
Initial version by 62.47.37.94 ? on Wednesday, January 11, 2006
ImageSize = width:200 height:200 PlotArea = width:120 height:150 left:50 bottom:20 AlignBars = late DateFormat = yyyy Period = from:0 till:500 TimeAxis = orientation:vertical ScaleMajor = unit:year increment:50 start:0 PlotData= color:blue width:20 bar:2002/03 from:start till:349 bar:2003/04 from:start till:387 bar:2004/05 from:start till:461 TextData= pos:(20,110) fontsize:M text:
| Template:Zeitleiste Münchner Bürgermeister | top next |

First version by Kandro3 on Wednesday, January 25, 2006, last update on Thursday, January 26, 2006
ImageSize = width:200 height:320 PlotArea = left:40 right:0 bottom:50 top:10 Legend = columns:3 left:40 top:40 columnwidth:50 DateFormat = dd/mm/yyyy Period = from:01/01/1948 till:01/01/2008 TimeAxis = orientation:vertical format:yyyy ScaleMajor = unit:year increment:6 start:1948 Colors= id:CSU value:black legend:CSU id:SPD value:red legend:SPD id:grau value:gray(0.8) PlotData= bar:Münchner_Bürgermeister color:CSU width:20 fontsize:M align:left shift:(20,-5) mark:(line,grau) from:01/07/1948 till:26/03/1960 color:SPD text:[[Thomas_Wimmer]] from:27/03/1960 till:10/06/1972 color:SPD text:[[Hans-Jochen_Vogel]] from:11/06/1972 till:04/03/1978 color:SPD text:[[Georg_Kronawitter]] from:05/03/1978 till:17/03/1984 color:CSU text:[[Erich_Kiesl]] from:18/03/1984 till:30/06/1993 color:SPD text:[[Georg_Kronawitter]] from:12/09/1993 till:end color:SPD text:[[Christian_Ude]]
| Geschichte Eschweilers | top next |

Initial version by Eschweiler on Tuesday, July 4, 2006
ImageSize = width:800 height:80 PlotArea = width:700 height:50 left:50 bottom:25 DateFormat = yyyy Period = from:800 till:2050 TimeAxis = orientation:horizontal ScaleMajor = unit:year increment:100 start:800 Define $dx = 25 # shift text to right side of bar PlotData= bar:Leadors color:red width:15 mark: (line,white) align:left fontsize:S color:blue from:800 till:960 shift:(-25,15) text:Frankenreich color:yellow from:960 till:1140 shift:(-40,15) text:Hl. Röm. Reich color:blue from:1140 till:1250 shift:(-40,15) text:Niederlothringen color:yellow from:1250 till:1420 shift:(-25,15) text:Domkapitel color:blue from:1420 till:1790 shift:(-30,15) text:Herzogtum Jülich color:yellow from:1790 till:1815 shift:(-10,15) text:Frk. color:blue from:1815 till:1945 shift:(-20,15) text:Preußen color:yellow from:1945 till:end shift:(-20,15) text:Nordrhein-Westfalen
| Template:Zeitleiste FIFA-Weltrangliste | top next |

First version by Denkfabrikant on Tuesday, February 7, 2006, last update on Monday, February 20, 2006
ImageSize = width:140 height:800 PlotArea = left:40 right:0 bottom:10 top:10 DateFormat = dd/mm/yyyy Period = from:01/01/1993 till:01/06/2006 ScaleMajor = unit:year increment:1 start:1993 TimeAxis = orientation:vertical format:yyyy Colors = id:Brasilien value:yellow id:Deutschland value:gray(0.25) id:Frankreich value:blue id:Italien value:red PlotData= bar:Leaders width:25 mark:(line,white) align:left fontsize:S from:01/08/1993 till:01/09/1993 shift:(20,-8) text:"[[Deutsche Fußballnationalmannschaft|Deutschland]]" color:Deutschland from:01/09/1993 till:01/11/1993 shift:(20,-6) text:"[[Brasilianische Fußballnationalmannschaft|Brasilien]]" color:Brasilien from:01/11/1993 till:01/12/1993 shift:(20,-3) text:"[[Italienische Fußballnationalmannschaft|Italien]]" color:Italien from:01/12/1993 till:01/04/1994 shift:(20,-3) text:"[[Deutsche Fußballnationalmannschaft|Deutschland]]" color:Deutschland from:01/04/1994 till:01/06/1994 shift:(20,-5) text:"[[Brasilianische Fußballnationalmannschaft|Brasilien]]" color:Brasilien from:01/06/1994 till:01/07/1994 shift:(20,-2) text:"[[Deutsche Fußballnationalmannschaft|Deutschland]]" color:Deutschland from:01/07/1994 till:01/05/2001 shift:(20,0) text:"[[Brasilianische Fußballnationalmannschaft|Brasilien]]" color:Brasilien from:01/05/2001 till:01/06/2002 shift:(20,0) text:"[[Französische Fußballnationalmannschaft|Frankreich]]" color:Frankreich from:01/06/2002 till:end shift:(20,0) text:"[[Brasilianische Fußballnationalmannschaft|Brasilien]]" color:Brasilien
| Grafschaft Hauenstein | top next |

First version by G-Boll on Thursday, March 9, 2006, last update on Tuesday, April 25, 2006
ImageSize = width:760 height:120 PlotArea = width:640 height:60 left:100 bottom:35 TimeAxis = orientation:horizontal DateFormat = yyyy Period = from:900 till:1946 AlignBars = early ScaleMajor = unit:year increment:100 start:900 Colors = id:canvas value:rgb(1,1,0.85) BackgroundColors = canvas:canvas PlotData = bar:Vorgeschichte from:900 till:1325 width:20 color:claret align:center textcolor:white fontsize:10 text:Landnahme shift:(0,-4) bar:Grafschaft from:1326 till:1805 width:20 color:green align:center textcolor:white fontsize:10 text:Hauenstein shift:(0,-4) at:1333 mark:(line,white) align:right textcolor:teal fontsize:10 text:"Entstehung der Einungen" shift:(20,-23) at:1433 mark:(line,white) align:left textcolor:teal fontsize:10 text:"Einungsverfassung" shift:(-10,-23) bar:Großherzogtum from:1806 till:1945 width:20 color:yellow2 align:center textcolor:darkblue fontsize:10 text:Baden shift:(0,-4)
| Template:Wasserreichste Flüsse Bayerns | top next |

First version by 84.155.94.86 on Thursday, March 2, 2006, last update on Wednesday, July 12, 2006
TimeAxis = orientation:horizontal format:yyyy ImageSize = width:800 height:auto barincrement:25 PlotArea = left:10 right:10 top:10 bottom:40 AlignBars = justify Colors = id:canvas value:rgb(0.97,0.97,0.97) BackgroundColors = canvas:canvas Period = from:0 till:1525 ScaleMajor = unit:year increment:100 start:0 gridcolor:drabgreen BarData= barset:Flüsse PlotData= width:20 fontsize:M textcolor:black align:left color:skyblue shift:(0,-6) barset:Flüsse from:start till:end width:20 color:drabgreen Text:Die_wasserreichsten_Flüsse_in_Bayern fontsize:12 align:center from:start till:1490 text:[[Donau]]_1490 m³/s_(Passau, nach der Innmündung) from:start till:740 text:[[Inn]]_740_m³/s_(Passau) from:start till:250 text:[[Salzach]]_250_m³/s_(Burghausen) from:start till:190 text:[[Lech]]_190_m³/s_(Augsburg) from:start till:175 text:[[Isar]]_175_m³/s_(Plattling) from:start till:164 text:[[Main]]_164_m³/s_(Kleinheubach) from:start till:77 text:[[Vils (Lech)|Vils]]_77_m³/s_(Vils) from:start till:75 text:[[Iller]]_75_m³/s_(Senden) from:start till:52 text:[[Alz]]_52_m³/s_(Seebruck, vor Alzkanalausleitung) from:start till:51 text:[[Regnitz]]_51_m³/s_(Bamberg) from:start till:50 text:[[Naab]]_50_m³/s_(Heitzenhofen) from:start till:45 text:[[Amper]]_45_m³/s_(Inkofen) from:start till:40 text:[[Regen (Fluss)|Regen]]_40_m³/s_(Regensburg) from:start till:39 text:[[Saalach]]_39_m³/s_(Siezenheim) from:start till:37 text:[[Loisach]]_37_m³/s_(Wolfratshausen) from:start till:35 text:[[Tiroler Achen]]_35_m³/s_(Staudach) from:start till:32 text:[[Wertach (Fluss)|Wertach]]_32_m³/s_(Augsburg) from:start till:25 text:[[Altmühl]]_25_m³/s_(Kelheim)
| Template:Zeitleiste Beauftragte der Bundesregierung für Menschenrechtspolitik und humanitäre Hilfe | top next |

First version by Sum on Monday, March 6, 2006, last update on Wednesday, March 8, 2006
ImageSize = width:240 height:300 PlotArea = left:40 right:0 bottom:60 top:10 Legend = orientation:horizontal position:bottom DateFormat = dd/mm/yyyy Period = from:01/01/1998 till:31/12/2006 TimeAxis = orientation:vertical format:yyyy ScaleMajor = unit:year increment:2 start:1998 Colors= id:CDU value:black legend:CDU id:B90Gr value:green legend:B90/Grüne PlotData= bar:Menschenrechtsbeauftragte color:black width:15 fontsize:M align:left shift:(20,-5) mark:(line,white) from:01/11/1998 till:28/02/2003 shift:(20,-15) text:[[Gerd_Poppe]] color:B90Gr from:01/03/2003 till:31/12/2004 text:[[Claudia_Roth]] color:B90Gr from:01/01/2005 till:14/02/2006 text:[[Tom_Koenigs]] color:B90Gr from:08/03/2006 till:31/12/2006 text:[[Günter_Nooke]] color:CDU
| Template:Zeitleiste Reichsjustizminister | top next |
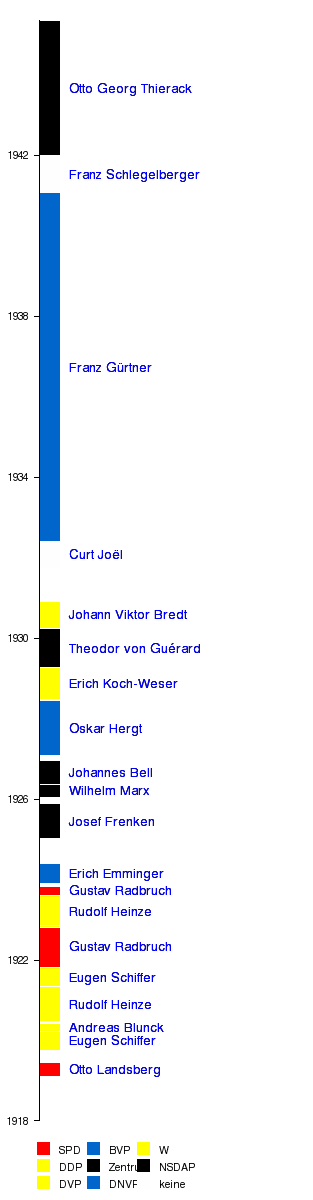
First version by Kandschwar on Wednesday, April 5, 2006, last update on Saturday, April 15, 2006
ImageSize = width:315 height:1200 PlotArea = left:40 right:0 bottom:80 top:20 Legend = columns:3 left:40 top:60 columnwidth:50 DateFormat = dd/mm/yyyy Period = from:01/01/1918 till:08/05/1945 TimeAxis = orientation:vertical format:yyyy ScaleMajor = unit:year increment:4 start:1918 Colors= id:SPD value:red legend:SPD id:DDP value:yellow legend:DDP id:DVP value:yellow legend:DVP id:BVP value:blue legend:BVP id:Z value:black legend:Zentrum id:DNVP value:blue legend:DNVP id:W value:yellow legend:W id:NSDAP value:black legend:NSDAP id:parteilos value:white legend:keine PlotData= bar:Außenminister color:black width:20 fontsize:M align:left shift:(20,-5) mark:(line,white) from:13/02/1919 till:20/06/1919 text:[[Otto_Landsberg]] color:SPD from:03/10/1919 till:26/03/1920 text:[[Eugen_Schiffer]] color:DDP from:27/03/1920 till:08/06/1920 text:[[Andreas_Blunck]] color:DDP from:25/06/1920 till:04/05/1921 text:[[Rudolf_Heinze]] color:DVP from:10/05/1921 till:22/10/1921 text:[[Eugen_Schiffer]] color:DDP from:26/10/1921 till:14/11/1922 text:[[Gustav_Radbruch]] color:SPD from:22/10/1922 till:12/08/1923 text:[[Rudolf_Heinze]] color:DVP from:13/08/1923 till:03/11/1923 text:[[Gustav_Radbruch]] color:SPD from:30/11/1923 till:26/05/1924 text:[[Erich_Emminger]] color:BVP from:05/01/1925 till:21/11/1925 text:[[Josef_Frenken]] color:Z from:20/01/1926 till:12/05/1926 text:[[Wilhelm_Marx]] color:Z from:12/05/1926 till:17/12/1926 text:[[Johannes_Bell]] color:Z from:29/01/1927 till:12/06/1928 text:[[Oskar_Hergt]] color:DNVP from:28/06/1928 till:13/04/1929 text:[[Erich_Koch-Weser]] color:DDP from:13/04/1929 till:27/03/1930 text:[[Theodor_von_Guérard]] color:Z from:30/03/1930 till:05/12/1930 text:[[Johann_Viktor_Bredt]] color:W from:09/10/1931 till:30/05/1932 text:[[Curt_Joël]] color:parteilos from:01/06/1932 till:29/01/1941 text:[[Franz_Gürtner]] color:DNVP from:30/01/1941 till:01/01/1942 text:[[Franz_Schlegelberger]] color:parteilos from:02/01/1942 till:08/05/1945 text:[[Otto_Georg_Thierack]] color:NSDAP
| Rütschenhausen | top next |

First version by HAH on Wednesday, April 12, 2006, last update on Thursday, May 4, 2006
ImageSize = width:800 height:auto barincrement:15 PlotArea = top:10 bottom:30 right:130 left:20 AlignBars = early DateFormat = yyyy Period = from:1900 till:2000 TimeAxis = orientation:horizontal ScaleMajor = unit:year increment:10 start:1900 Colors = id:canvas value:rgb(0.97,0.97,0.97) id:PA value:green Backgroundcolors = canvas:canvas BarData = barset:Bürgermeister PlotData= width:10 align:left fontsize:M shift:(5,-4) anchor:till barset:Bürgermeister from:1907 till:1911 color:PA text:"[[]]Adam Wischer ([[1907]] - [[1911]])" from:1912 till:1918 color:PA text:"[[]]Nikolaus Manger ([[1912]] - [[1918]])" from:1918 till:1928 color:PA text:"[[]]Franz Schneider ([[1918]] - [[1928]])" from:1928 till:1939 color:PA text:"[[]]Anton Wischer ([[1928]] - [[1939]])" from:1939 till:1945 color:PA text:"[[]]Fridolin Kempf ([[1939]] - [[1945]])" from:1945 till:1960 color:PA text:"[[]]Alfons Wolz ([[1945]] - [[1960]])" from:1960 till:1978 color:PA text:"[[]]Alfred Fischer ([[1960]] - [[1978]])" barset:skip
| Geschichte Emdens | top next |

First version by Matthias Süßen on Tuesday, April 11, 2006, last update on Wednesday, April 12, 2006
ImageSize = width:800 height:80 PlotArea = width:700 height:50 left:50 bottom:25 DateFormat = yyyy Period = from:800 till:2050 TimeAxis = orientation:horizontal ScaleMajor = unit:year increment:100 start:800 Define $dx = 25 # shift text to right side of bar PlotData= bar:Leadors color:red width:15 mark: (line,white) align:left fontsize:S color:red from:800 till:1464 shift:(-40,15) text:Zeit der friesischen Freiheit und der Häuptlinge color:green from:1464 till:1744 shift:(-40,15) text:Grfs./Fst. Ostfriesland color:red from:1744 till:1815 shift:(-12,15) text:Prß. color:green from:1815 till:1866 shift:(-12,15) text:Han. color:red from:1866 till:1946 shift:(-10,15) text:Prß. color:green from:1946 till:end shift:(-30,15) text:Niedersachsen
| Verein und Institut für Ostbairische Heimatforschung | top next |

Initial version by Stefan Daller on Friday, April 14, 2006
Dateformat = mm/dd/yyyy Period = from:08/11/1926 till:04/14/2006 TimeAxis = orientation:horizontal ImageSize = width:800 height:100 PlotArea = width:90% height:90% left:10% bottom:10% PlotData = bar:Verein from:start till:end color:red bar:Institut from:start till:end color:blue color:red fontsize:S bar:Verein from:08/11/1926 till:02/22/1963 align:center text:Sittler bar:Verein from:02/22/1963 till:05/01/1984 align:center text:Brichta bar:Verein from:05/01/1984 till:08/12/1984 align:right text:Schäffer bar:Verein from:08/12/1984 till:11/17/1987 align:left text:Brichta bar:Verein from:11/17/1987 till:04/14/2006 align:center text:Plenk at:02/22/1963 mark:(line,white) at:05/01/1984 mark:(line,white) at:08/12/1984 mark:(line,white) at:11/17/1987 mark:(line,white) color:blue bar:Institut from:08/11/1926 till:05/10/1944 align:right text:Heuwieser bar:Institut from:05/10/1944 till:01/01/1947 align:center text:Mayer-Pfannholz bar:Institut from:01/01/1947 till:01/01/1969 align:center text:Oswald bar:Institut from:01/01/1969 till:01/01/1973 align:center text:Leidl & Hubensteiner bar:Institut from:01/01/1973 till:01/01/1994 align:right text:Leidl bar:Institut from:01/01/1994 till:04/14/2006 align:center text:Boshof at:05/10/1944 mark:(line,white) at:01/01/1947 mark:(line,white) at:01/01/1969 mark:(line,white) at:01/01/1973 mark:(line,white) at:01/01/1994 mark:(line,white)
| Präsidentschaftswahlen in Gambia 1996 | top next |

Initial version by Atamari on Saturday, April 22, 2006
ImageSize = width:180 height:50 PlotArea = left:30 right:30 top:0 bottom:20 DateFormat = x.y Period = from:0 till:100 TimeAxis = orientation:horizontal ScaleMajor = unit:year increment:20 start:0 ScaleMinor = unit:year increment:5 start:0 Colors = id:grau value:gray(0.8) PlotData = from:100 till:97.1 color:claret from:97.1 till:91.6 color:blue from:91.6 till:55.8 color:yellow from:55.8 till:0.0 color:green TextData = pos:(5,5) text:%
| Präsidentschaftswahlen in Gambia 2001 | top next |

Initial version by Atamari on Saturday, April 22, 2006
ImageSize = width:180 height:50 PlotArea = left:30 right:30 top:0 bottom:20 DateFormat = x.y Period = from:0 till:100 TimeAxis = orientation:horizontal ScaleMajor = unit:year increment:20 start:0 ScaleMinor = unit:year increment:5 start:0 Colors = id:grau value:gray(0.8) PlotData = from:100 till:97.1 color:claret from:97.1 till:93.2 color:white from:93.2 till:85.7 color:blue from:85.7 till:52.8 color:yellow from:52.8 till:0.0 color:green TextData = pos:(5,5) text:%
| Lengfeld (Odenwald) | top next |

Initial version by Dennis140 on Thursday, July 27, 2006
ImageSize = width:800 height:80 PlotArea = width:700 height:50 left:50 bottom:25 DateFormat = yyyy Period = from:500 till:2050 TimeAxis = orientation:horizontal ScaleMajor = unit:year increment:100 start:500 Define $dx = 25 # shift text to right side of bar PlotData= bar:Leadors color:red width:15 mark: (line,white) align:left fontsize:S color:blue from:500 till:766 shift:(-30,15) text:Franken color:yellow from:766 till:1390 shift:(-40,15) text:Fulda color:blue from:1390 till:1504 shift:(-20,15) text:Kurpfalz color:yellow from:1504 till:1507 shift:(-5,15) text:H. color:blue from:1507 till:1626 shift:(-20,15) text:Kurpfalz color:yellow from:1626 till:1648 shift:(-5,15) text:H. color:blue from:1648 till:1803 shift:(-20,15) text:(Kur)Pfalz color:yellow from:1803 till:end shift:(-20,15) text:Hessen
| Präsidentschaftswahlen in Kap Verde 2006 | top next |

Initial version by Bohr on Monday, May 8, 2006
ImageSize = width:180 height:50 PlotArea = left:30 right:30 top:0 bottom:20 DateFormat = x.y Period = from:0 till:100 TimeAxis = orientation:horizontal ScaleMajor = unit:year increment:20 start:0 ScaleMinor = unit:year increment:5 start:0 Colors = id:grau value:gray(0.8) PlotData = from:100 till:51 color:claret from:51 till:0.0 color:green TextData = pos:(5,5) text:%
| Parlamentswahlen in Kap Verde 2006 | top next |

First version by Bohr on Monday, May 8, 2006, last update on Friday, May 19, 2006
ImageSize = width:180 height:50 PlotArea = left:30 right:30 top:0 bottom:20 DateFormat = x.y Period = from:0 till:100 TimeAxis = orientation:horizontal ScaleMajor = unit:year increment:20 start:0 ScaleMinor = unit:year increment:5 start:0 Colors = id:grau value:gray(0.8) PlotData = from:100 till:99.6 color:claret from:99.6 till:99.0 color:white from:99.0 till:96.4 color:blue from:96.4 till:52.2 color:yellow from:52.2 till:0 color:green TextData = pos:(5,5) text:%
| Wülfershausen (Wasserlosen) | top next |

Initial version by HAH on Friday, May 26, 2006
ImageSize = width:800 height:auto barincrement:15 PlotArea = top:10 bottom:30 right:130 left:20 AlignBars = early DateFormat = yyyy Period = from:1900 till:2000 TimeAxis = orientation:horizontal ScaleMajor = unit:year increment:10 start:1900 Colors = id:canvas value:rgb(0.97,0.97,0.97) id:PA value:green Backgroundcolors = canvas:canvas BarData = barset:Bürgermeister PlotData= width:10 align:left fontsize:M shift:(5,-4) anchor:till barset:Bürgermeister from:1906 till:1918 color:PA text:"[[]]Georg Nöth ([[1906]] - [[1918]])" from:1920 till:1933 color:PA text:"[[]]Ambros Benkert ([[1920]] - [[1933]])" from:1933 till:1945 color:PA text:"[[]]Silverius Heil ([[1933]] - [[1945]])" from:1945 till:1948 color:PA text:"[[]]Ambros Benkert ([[1945]] - [[1948]])" from:1948 till:1956 color:PA text:"[[]]Georg Brux ([[1948]] - [[1956]])" from:1956 till:1960 color:PA text:"[[]]Richard Nöth ([[1956]] - [[1960]])" from:1960 till:1966 color:PA text:"[[]]Franz Metzger ([[1960]] - [[1966]])" from:1966 till:1978 color:PA text:"[[]]Leo Heil ([[1966]] - [[1978]])" barset:skip
| Spiritualized® | top next |

First version by 83.129.172.36 on Wednesday, June 7, 2006, last update on Friday, July 21, 2006
TimeAxis = orientation:horizontal format:yyyy ImageSize = width:850 height:350 PlotArea = width:800 height:300 bottom:20 left:20 Colors = id:canvas value:rgb(1,1,1) id:grid1 value:rgb(0.5,0.5,0.5) id:grid2 value:gray(0.5) id:bars value:rgb(0.9,0.9,0.9) BackgroundColors = canvas:canvas Period = from:1988 till:2010 ScaleMajor = unit:year increment:1 start:1988 gridcolor:grid1 BarData= barset:Bands LineData = at:1990 color:grid2 layer:back at:1992 color:grid2 layer:back at:1995 color:grid2 layer:back at:1997 color:grid2 layer:back at:1999 color:grid2 layer:back PlotData= # set defaults width:15 fontsize:S textcolor:black align:left anchor:from shift:(10,-4) color:bars barset:Bands from:1990 till:2007 text:"Jason Pierce" from:1999 till:2007 text:"John Coxon" from:1990 till:1997 text:"[[Keyboard]]: Kate Radley" from:1997 till:2004 text:"Tim Lewis" from:1990 till:1994 text:"[[Gitarre]]: Mark Refoy" from:1995 till:1999 text:"Mike Mooney" from:1999 till:2007 text:"Doggen" from:1990 till:1992 text:"[[Bass]]: Will Caruthers" from:1992 till:1999 text:"Sean Cook" from:1999 till:2003 text:"Martin Shallards" from:1990 till:1994 text:"[[Schlagzeug]]: Jonny Mattock" from:1995 till:1999 text:"Damon Reece" from:1999 till:2004 text:"Kev Bales" from:1999 till:2004 text:"Tom Edwards (Percussions)" at:1990 text: from:1997 till:2003 text:"[[Saxophon]]:Raymond Dickaty" at:1990 text:
| Präsidentschaftswahlen in Gambia 1992 | top next |

Initial version by Atamari on Sunday, June 11, 2006
ImageSize = width:180 height:50 PlotArea = left:30 right:30 top:0 bottom:20 DateFormat = x.y Period = from:0 till:100 TimeAxis = orientation:horizontal ScaleMajor = unit:year increment:20 start:0 ScaleMinor = unit:year increment:5 start:0 Colors = id:grau value:gray(0.8) PlotData = from:100 till:88.7 color:claret from:88.7 till:80.7 color:blue from:80.7 till:58.5 color:white from:58.5 till:0.0 color:magenta TextData = pos:(5,5) text:%
| Präsidentschaftswahlen in Gambia 1987 | top next |

Initial version by Atamari on Tuesday, June 13, 2006
ImageSize = width:180 height:50 PlotArea = left:30 right:30 top:0 bottom:20 DateFormat = x.y Period = from:0 till:100 TimeAxis = orientation:horizontal ScaleMajor = unit:year increment:20 start:0 ScaleMinor = unit:year increment:5 start:0 Colors = id:grau value:gray(0.8) PlotData = from:100.0 till:86.3 color:blue from:86.3 till:61.1 color:white from:61.1 till:0.0 color:magenta TextData = pos:(5,5) text:%
| Präsidentschaftswahlen in Gambia 1982 | top next |
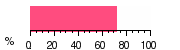
Initial version by Atamari on Wednesday, June 14, 2006
ImageSize = width:180 height:50 PlotArea = left:30 right:30 top:0 bottom:20 DateFormat = x.y Period = from:0 till:100 TimeAxis = orientation:horizontal ScaleMajor = unit:year increment:20 start:0 ScaleMinor = unit:year increment:5 start:0 Colors = id:grau value:gray(0.8) PlotData = from:100.0 till:72.4 color:white from:72.4 till:0.0 color:magenta TextData = pos:(5,5) text:%
| Präsidentschaftswahlen in Gambia 2006 | top next |
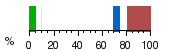
Initial version by Atamari on Wednesday, June 14, 2006
ImageSize = width:180 height:50 PlotArea = left:30 right:30 top:0 bottom:20 DateFormat = x.y Period = from:0 till:100 TimeAxis = orientation:horizontal ScaleMajor = unit:year increment:20 start:0 ScaleMinor = unit:year increment:5 start:0 Colors = id:grau value:gray(0.8) PlotData = from:100 till:80.0 color:claret from:80.0 till:75.0 color:white from:75.0 till:70.0 color:blue from:10.0 till:10.0 color:yellow from:5.0 till:0.0 color:green TextData = pos:(5,5) text:%
| Constitutional Referendum 1996 | top next |
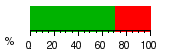
Initial version by Atamari on Thursday, June 15, 2006
ImageSize = width:180 height:50 PlotArea = left:30 right:30 top:0 bottom:20 DateFormat = x.y Period = from:0 till:100 TimeAxis = orientation:horizontal ScaleMajor = unit:year increment:20 start:0 ScaleMinor = unit:year increment:5 start:0 Colors = id:grau value:gray(0.8) PlotData = from:100 till:70.37 color:red from:70.37 till:0.0 color:green TextData = pos:(5,5) text:%
| Template:Zeitleiste Periodisierung des Nordgermanischen detailliert | top next |

Initial version by Werner.schaefke on Monday, June 19, 2006
ImageSize = width:800 height:250 PlotArea = left:80 right:15 bottom:25 top:15 AlignBars = early Colors = id:urn value:rgb(0.7,0.7,1) id:period value:rgb(1,0.7,0.7) id:an value:rgb(1,0.7,0.5) id:mn value:rgb(1,0.8,0.6) id:nn value:rgb(1,0.9,0.7) id:awn2 value:rgb(1,0.4,0.4) id:awn value:rgb(1,0.5,0.5) id:anorw value:rgb(1,0.5,0.4) id:mnorw value:rgb(1,0.6,0.5) id:norw value:rgb(1,0.7,0.6) id:aisl value:rgb(0.9,0.5,0.5) id:nisl value:rgb(0.9,0.6,0.6) id:aon value:rgb(0.4,0.6,0.2) id:aon2 value:rgb(0.4,0.7,0.3) id:aon3 value:rgb(0.4,0.8,0.4) id:adk value:rgb(0.5,0.7,0.2) id:amdk value:rgb(0.6,0.8,0.2) id:jmdk value:rgb(0.7,0.9,0.2) id:andk value:rgb(0.8,1,0.2) id:jndk value:rgb(0.9,1,0.2) id:rsw value:rgb(0.4,0.6,0.3) id:aasw value:rgb(0.4,0.7,0.4) id:jasw value:rgb(0.4,0.8,0.5) id:answ value:rgb(0.4,0.9,0.6) id:jnsw value:rgb(0.4,1,0.7) id:white value:rgb(1,1,1) id:black value:black Period = from:800 till:2000 TimeAxis = orientation:horizontal ScaleMajor = unit:year increment:50 start:800 ScaleMinor = unit:year increment:25 start:1350 #Define $markgreen = text:"*" textcolor:green shift:(0,3) fontsize:10 PlotData= align:center textcolor:black fontsize:10 mark:(line,black) width:30 shift:(0,-5) bar:Allgemein #at: 1350 align:right $markgreen #at: start align:left $markgreen from: 1550 till: 2000 text:Neunordisch color:nn mark:(line,nn) from: 1350 till: 1550 text:Mittelnordisch color:mn mark:(line,mn) from: 800 till: 1350 text:Altnordisch color:an mark:(line,an) bar:Westnordisch width:25 from: 800 till: 1350 text:Altwestnordisch from: 1050 till: 1350 color:awn mark:(line,awn) from: 800 till: 1050 color:awn2 mark:(line,awn2) bar:Norwegisch color:anorw width:25 from: 1530 till: 2000 text:[[Norwegische_Sprache|Norwegisch]] color:norw mark:(line,norw) from: 1350 till: 1530 text:Mittelnorwegisch color:mnorw mark:(line,mnorw) from: 1050 till: 1350 text:[[Altnorwegisch]] color:anorw mark:(line,anorw) from: 800 till: 1050 text:Altwestnordisch from: 800 till: 1050 color:awn2 mark:(line,awn2) bar:Isländisch color:period width:25 from: 1540 till: 2000 text:[[Isländische_Sprache|Neuisländisch]] color:nisl mark:(line,nisl) from: 1050 till: 1540 text:[[Altisländisch]] color:aisl mark:(line,aisl) from: 800 till: 1050 text:der_Wikingerzeit from: 800 till: 1050 color:awn2 mark:(line,awn2) bar:Ostnordisch width:25 from: 800 till: 1375 text:Altostnordisch from: 1225 till: 1375 color:aon3 mark:(line,aon3) from: 1100 till: 1225 color:aon2 mark:(line,aon2) from: 800 till: 1100 color:aon mark:(line,aon) #from: 600 till: 800 color:urn bar:Dänisch width:25 from: 1700 till: 2000 text:jüngeres~Neudänisch color:jndk shift:(0,2) fontsize:8 mark:(line,jndk) from: 1500 till: 1700 text:älteres~[[Dänische_Sprache|Neudänisch]] color:andk shift:(0,2) fontsize:8 mark:(line,andk) from: 1300 till: 1500 text:jüngeres~Mitteldänisch color:jmdk shift:(0,2) fontsize:8 mark:(line,jmdk) from: 1100 till: 1300 text:älteres~Mitteldänisch color:amdk shift:(0,2) fontsize:8 mark:(line,amdk) from: 800 till: 1100 text:[[Altdänisch]] color:adk mark:(line,adk) bar:Schwedisch width:25 from: 1732 till: 2000 text:jüngeres~Neuschwedisch shift:(0,2) fontsize:8 color:jnsw mark:(line,jnsw) from: 1526 till: 1732 text:älteres~[[Schwedische_Sprache|Neuschwedisch]] shift:(0,2) fontsize:8 color:answ mark:(line,answ) from: 1375 till: 1526 text:jüngeres~Altschwedisch shift:(0,2) fontsize:8 color:jasw mark:(line,jasw) from: 1225 till: 1375 text:älteres~[[Altschwedisch]] shift:(0,2) fontsize:8 color:aasw mark:(line,aasw) from: 800 till: 1225 text:Runenschwedisch color:rsw mark:(line,rsw)
| Template:Zeitleiste Linux-Distribution | top next |

Initial version by VanGore on Monday, June 19, 2006
ImageSize = width:440 height:250 PlotArea = width:400 height:220 left:20 bottom:20 AlignBars = justify DateFormat = yyyy Period = from:1990 till:2010 TimeAxis = orientation:horizontal ScaleMajor = unit:year increment:10 start:1990 ScaleMinor = unit:year increment:2 start:1992 Colors = id:Linux value:gray(0.7) id:SLS value:gray(0.9) id:Debian value:claret BarData= bar:Linux bar:SLS bar:Slackware bar:RedHatLinux bar:MandrivaLinux bar:SuseLinux bar:Debian bar:Knoppix bar:Ubuntu bar:GentooLinux PlotData= # width=0.3 bar:Linux width:10 color:Linux align:center from:1991 till:end text:[[Linux]] bar:SLS width:20 color:SLS align:center from:1992 till:1994 text:[[Softlanding Linux System|SLS]] # at:1992 mark:(line,white) bar:Slackware width:20 color:SLS align:center from:1993 till:2010 text:[[Slackware]] # at:1994 mark:(line,white) bar:RedHatLinux width:20 color:SLS align:center from:1994 till:end text:[[Red Hat Linux]] bar:MandrivaLinux width:20 color:SLS align:center from:1998 till:end text:[[Mandriva Linux]] bar:SuseLinux width:20 color:SLS align:center from:1994 till:end text:[[Suse Linux]] bar:Debian width:20 color:Debian align:center from:1994 till:end text:[[Debian GNU/Linux|Debian]] # at:2004 mark:(line,white) bar:Knoppix width:20 color:Debian align:center from:2002 till:end text:[[Knoppix]] bar:Ubuntu width:20 color:Debian align:center from:2004 till:end text:[[Ubuntu]] bar:GentooLinux width:20 color:Linux align:center from:2002 till:end text:[[Gentoo Linux]]
| Template:Zeitleiste Periodisierung des Isländischen | top next |

Initial version by Werner.schaefke on Tuesday, June 20, 2006
ImageSize = width:650 height:90 PlotArea = left:15 right:15 bottom:25 top:15 AlignBars = early Colors = id:awn2 value:rgb(1,0.4,0.4) id:anorw value:rgb(1,0.5,0.4) id:mnorw value:rgb(1,0.6,0.5) id:norw value:rgb(1,0.7,0.6) id:aisl value:rgb(0.9,0.5,0.5) id:nisl value:rgb(0.9,0.6,0.6) Period = from:800 till:2000 TimeAxis = orientation:horizontal ScaleMajor = unit:year increment:50 start:800 ScaleMinor = unit:year increment:50 start:1350 #Define $markgreen = text:"*" textcolor:green shift:(0,3) fontsize:10 PlotData= align:center textcolor:black fontsize:10 mark:(line,black) width:30 shift:(0,-5) bar:Isländisch width:30 from: 1540 till: 2000 text:[[Isländische_Sprache|Neuisländisch]] color:nisl mark:(line,nisl) from: 1050 till: 1540 text:[[Altisländisch]] color:aisl mark:(line,aisl) from: 800 till: 1050 text:Altwestnordisch~der_Wikingerzeit fontsize:10 shift:(0,1) from: 800 till: 1050 color:awn2 mark:(line,awn2) at: 870 mark:(line,white) text:Besiedlung~Islands fontsize:9 shift:(10,27) at:1000 mark:(line,white) text:Bekehrung~Islands fontsize:9 shift:(10,27)
| Anor | top next |

First version by Cleverboy on Sunday, July 2, 2006, last update on Sunday, July 23, 2006
ImageSize = width:250 height:200
PlotArea = left:40 right:10 top:10 bottom:20
TimeAxis = orientation:horizontal
AlignBars = justify
Colors =
id:gray1 value:gray(0.9)
DateFormat = yyyy
Period = from:1960 till:2010
ScaleMajor = unit:year increment:10 start:1960
PlotData =
bar:5400 color:gray1 width:1
from:start till:end
bar:3600 color:gray1
from:start till:end
bar:1800 color:gray1
from:start till:end
bar:0 color:gray1
LineData =
layer:front
points:(48,139)(84,134) color:blue width:2 #1962 tot 1968. Inwonertal 1962: 3794 1968: 3622
points:(84,134)(100,126) color:blue width:2 #1975: 3373
points:(100,126)(128,118) color:blue width:2 #1982: 3109
points:(128,118)(160,118) color:blue width:2 #1990: 3099
points:(160,118)(196,117) color:blue width:2 #1999: 3093
| Präsidentschaftswahlen in Nigeria 1999 | top next |
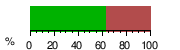
Initial version by Bohr on Sunday, July 2, 2006
ImageSize = width:180 height:50 PlotArea = left:30 right:30 top:0 bottom:20 DateFormat = x.y Period = from:0 till:100 TimeAxis = orientation:horizontal ScaleMajor = unit:year increment:20 start:0 ScaleMinor = unit:year increment:5 start:0 Colors = id:grau value:gray(0.8) PlotData = from:100 till:37 color:claret from:63 till:0.0 color:green TextData = pos:(5,5) text:%
| Nema Kunku | top next |

First version by Atamari on Monday, July 3, 2006, last update on Thursday, July 13, 2006
ImageSize = width:238 height:120 PlotArea = width:80% height:70% left:20% bottom:20% AlignBars = late DateFormat = yyyy Period = from:0 till:30000 TimeAxis = orientation:vertical ScaleMajor = increment:10000 start:0 PlotData= color:drabgreen bar:1983 from:start till:1208 bar:1993 from:start till:9838 bar:2006 from:start till:24242 TextData= pos:(100,110) fontsize:M text:Einwohnerentwicklung
| Sukuta | top next |
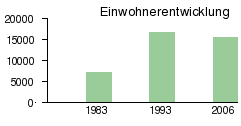
First version by Petar Marjanovic on Monday, July 3, 2006, last update on Thursday, July 13, 2006
ImageSize = width:238 height:120 PlotArea = width:80% height:70% left:20% bottom:20% AlignBars = late DateFormat = yyyy Period = from:0 till:20000 TimeAxis = orientation:vertical ScaleMajor = increment:5000 start:0 PlotData= color:drabgreen bar:1983 from:start till:7227 bar:1993 from:start till:16667 bar:2006 from:start till:15653 TextData= pos:(100,110) fontsize:M text:Einwohnerentwicklung
| Bintang (Gambia) | top next |

First version by Atamari on Sunday, July 2, 2006, last update on Tuesday, July 11, 2006
ImageSize = width:238 height:120 PlotArea = width:80% height:70% left:20% bottom:20% AlignBars = late DateFormat = yyyy Period = from:0 till:1500 TimeAxis = orientation:vertical ScaleMajor = increment:500 start:0 PlotData= color:drabgreen bar:1993 from:start till:632 bar:2006 from:start till:958 TextData= pos:(100,110) fontsize:M text:Einwohnerentwicklung
| Fattatenda | top next |

Initial version by Atamari on Wednesday, July 12, 2006
ImageSize = width:238 height:120 PlotArea = width:80% height:70% left:20% bottom:20% AlignBars = late DateFormat = yyyy Period = from:0 till:100 TimeAxis = orientation:vertical ScaleMajor = increment:20 start:0 PlotData= color:drabgreen bar:2006 from:start till:45 TextData= pos:(100,110) fontsize:M text:Einwohnerentwicklung
| Yarbutenda | top next |

Initial version by Atamari on Wednesday, July 12, 2006
ImageSize = width:238 height:120 PlotArea = width:80% height:70% left:20% bottom:20% AlignBars = late DateFormat = yyyy Period = from:0 till:100 TimeAxis = orientation:vertical ScaleMajor = increment:20 start:0 PlotData= color:drabgreen bar:2006 from:start till:xx TextData= pos:(100,110) fontsize:M text:Einwohnerentwicklung
| Template:Zeitleiste US-Senat | top next |

First version by Southpark on Tuesday, July 11, 2006, last update on Wednesday, July 12, 2006
ImageSize = width:180 height:600 PlotArea = left:50 right:0 bottom:40 top:10 DateFormat = yyyy Period = from:1789 till:2006 TimeAxis = orientation:vertical format:yyyy ScaleMajor = unit:year increment:4 start:1789 Colors= id:Dem value:blue id:Rep value:red id:Un value:orange id:Fed value:dullyellow id:Whi value:yellow id:DR value:pink id:Ad value:tan2 id:Ja value:purple PlotData= bar:Leaders width:25 mark:(line,white) align:left fontsize:S from:start till:1791 shift:(25,0) color:Ad text:Regierung from:1791 till:1801 shift:(25,0) color:Fed text:Föderalisten from:1801 till:1825 shift:(25,0) color:DR text:Demokraten-Republikaner from:1825 till:1827 shift:(25,0) color:Ja text:Jacksonians from:1827 till:1829 shift:(25,0) color:Ad text:Regierung from:1829 till:1841 shift:(25,0) color:Dem text:Demokraten from:1841 till:1845 shift:(25,0) color:Whi text:Whigs from:1845 till:1861 shift:(25,0) color:Dem text:Demokraten from:1861 till:1865 shift:(25,0) color:Rep text:Republikaner from:1865 till:1867 shift:(25,0) color:Un text:Unionisten from:1867 till:1879 shift:(25,0) color:Rep text:Republikaner from:1879 till:1881 shift:(25,0) color:Dem text:Demokraten from:1881 till:1893 shift:(25,0) color:Rep text:Republikaner from:1893 till:1895 shift:(25,0) color:Dem text:Demokraten from:1895 till:1913 shift:(25,0) color:Rep text:Republikaner from:1913 till:1919 shift:(25,0) color:Dem text:Demokraten from:1919 till:1933 shift:(25,0) color:Rep text:Republikaner from:1933 till:1947 shift:(25,0) color:Dem text:Demokraten from:1947 till:1949 shift:(25,0) color:Rep text:Republikaner from:1949 till:1953 shift:(25,0) color:Dem text:Demokraten from:1953 till:1955 shift:(25,0) color:Rep text:Republikaner from:1955 till:1981 shift:(25,0) color:Dem text:Demokraten from:1981 till:1987 shift:(25,0) color:Rep text:Republikaner from:1987 till:1995 shift:(25,0) color:Dem text:Demokraten from:1995 till:2001 shift:(25,0) color:Rep text:Republikaner from:1987 till:1995 shift:(25,0) color:Dem text:Demokraten from:1995 till:2001 shift:(25,0) color:Rep text:Republikaner from:2001 till:2003 shift:(25,0) color:Dem text:Demokraten from:2003 till:2006 shift:(25,0) color:Rep text:Republikaner
| Generated on Thursday, August 10, 2006 from SQL dump files of Monday, July 31, 2006 | |
| Note: only timelines on article and template pages are shown. Timelines on discussion pages, user pages, etc are ignored. | Top |