Graphical Timelines on French WikipediaSo far 165 timelines have been created on this Wikipedia. Last timeline added on Monday, July 31, 2006 |
Monday, July 31, 2006index |
Feel feel to ask Erik Zachte, the author of EasyTimeline, for help or advice at his Wikipedia user page
See also Introduction to EasyTimeline / Syntax
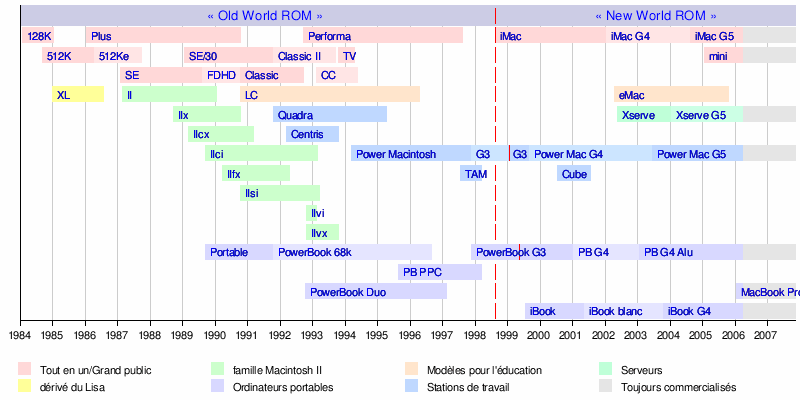
| Macintosh | next |
First version by Beavis on Friday, December 30, 2005, last update on Sunday, March 19, 2006
DateFormat=dd/mm/yyyy
Period = from:01/01/1984 till:01/11/2007
Define $now = 01/04/2006
Define $skip = at:end
Define $dayunknown = 15
Define $newworldstart = at:15/08/1998 mark:(line,red)
ImageSize= width:800 height:auto barincrement:21
TimeAxis = orientation:horizontal
PlotArea = right:5 left:20 bottom:80 top:5
Legend = orientation:vertical position:bottom columns:4

Colors =
     id:bg         value:white
     id:classic2   value:rgb(1,0.9,0.9)
     id:classic    value:rgb(1,0.85,0.85) legend:Tout_en_un/Grand_public
     id:lisa       value:rgb(1,1,0.6) legend:dérivé_du_Lisa
     id:macii      value:rgb(0.8,1,0.8) legend:famille_Macintosh_II
     id:portable2  value:rgb(0.9,0.9,1)
     id:portable   value:rgb(0.85,0.85,1) legend:Ordinateurs_portables
     id:edu        value:rgb(1,0.9,0.8) legend:Modèles_pour_l'éducation
     id:0402       value:rgb(0.8,0.9,1)
     id:040        value:rgb(0.75,0.85,1) legend:Stations_de_travail
     id:server2    value:rgb(0.8,1,0.9)
     id:server     value:rgb(0.75,1,0.85) legend:Serveurs
     id:line       value:rgb(0.2,0.2,0.2)
     id:lightline  value:rgb(0.8,0.8,0.8)
     id:header     value:rgb(0.8,0.8,0.9)
     id:lighttext  value:rgb(0.5,0.5,0.5)
     id:current    value:rgb(0.9,0.9,0.9) legend:Toujours_commercialisés

BackgroundColors = canvas:bg
ScaleMajor = gridcolor:lightline unit:year increment:1 start:01/01/1984

BarData =
  Barset:rom
  Barset:classic
  Barset:macii
  Barset:portable

PlotData=
  width:15 textcolor:black

  barset:rom
    color:header textcolor:white width:20 shift:(-50,-5) fontsize:m from:start till:15/08/1998 text:"[[Old World ROM|« Old World ROM »]]"
  barset:break
    at:15/08/1998 mark:(line,red)
  barset:break
    color:header textcolor:white width:20 shift:(-50,-5) fontsize:m from:15/08/1998 till:end text:"[[New World ROM|« New World ROM »]]"

  barset:classic
    shift:(5,-5) anchor:from fontsize:s
    color:classic from:24/01/1984 till:10/01/1985 text:"[[Macintosh 128K|128K]]"
    color:classic from:10/09/1984 till:14/04/1986 text:"[[Macintosh 512K|512K]]"
   barset:break
    color:classic from:16/01/1986 till:15/10/1990 text:"[[Macintosh Plus|Plus]]"
    color:classic2 from:14/04/1986 till:01/10/1987 text:"[[Macintosh 512Ke|512Ke]]"
    color:classic from:03/02/1987 till:$dayunknown/08/1989 text:"[[Macintosh SE|SE]]"
   barset:break
    $skip
    $skip
    color:classic2 from:$dayunknown/08/1989 till:15/10/1990 text:"[[Macintosh SE FDHD|FDHD]]"
   barset:break
    color:classic from:$dayunknown/09/1992 till:$dayunknown/08/1997 text:"[[Macintosh Performa|Performa]]"
    color:classic from:19/01/1989 till:21/10/1991 text:"[[Macintosh SE/30|SE/30]]"
    color:classic from:15/10/1990 till:14/09/1992 text:"[[Macintosh Classic|Classic]]"
   barset:break
    color:classic from:15/08/1998 till:$dayunknown/03/2003 text:"[[iMac]]"
    color:classic2 from:21/10/1991 till:13/09/1993 text:"[[Macintosh Classic II|Classic II]]"
    color:classic2 from:10/02/1993 till:16/05/1994 text:"[[Macintosh Color Classic|CC]]"
   barset:break
    color:classic2 from:$dayunknown/01/2002 till:$dayunknown/08/2004 text:"[[iMac G4]]"
    color:classic from:$dayunknown/10/1993 till:$dayunknown/04/1994 text:"[[Macintosh TV|TV]]"
   barset:break
    color:classic from:$dayunknown/08/2004 till:$now text:"[[iMac G5]]"
    color:classic from:$dayunknown/01/2005 till:$now text:"[[Mac mini|mini]]"
   barset:break
    $newworldstart
    $newworldstart
    $newworldstart
   barset:break
    color:current from:$now till:end
    color:current from:$now till:end

  barset:macii
    color:lisa from:01/01/1985 till:01/08/1986 text:"[[Macintosh XL|XL]]"
  barset:break
    color:macii from:02/03/1987 till:15/01/1990 text:"[[Macintosh II|II]]"
    color:macii from:19/09/1988 till:15/10/1990 text:"[[Macintosh IIx|IIx]]"
    color:macii from:07/03/1989 till:11/03/1991 text:"[[Macintosh IIcx|IIcx]]"
    color:macii from:20/09/1989 till:20/02/1993 text:"[[Macintosh IIci|IIci]]"
    color:macii from:19/03/1990 till:15/04/1992 text:"[[Macintosh IIfx|IIfx]]"
    color:macii from:15/10/1990 till:15/03/1993 text:"[[Macintosh IIsi|IIsi]]"
    color:macii from:19/10/1992 till:10/02/1993 text:"[[Macintosh IIvi|IIvi]]"
    color:macii from:19/10/1992 till:21/10/1993 text:"[[Macintosh IIvx|IIvx]]"
  barset:break
    color:edu from:$dayunknown/10/1990 till:$dayunknown/04/1996 text:"[[Macintosh LC|LC]]"
    color:040 from:$dayunknown/10/1991 till:$dayunknown/04/1995 text:"[[Macintosh Quadra|Quadra]]"
    color:040 from:$dayunknown/03/1992 till:$dayunknown/10/1993 text:"[[Macintosh Centris|Centris]]"
    color:040 from:$dayunknown/03/1994 till:$dayunknown/11/1997 text:"[[Power Macintosh]]"
  barset:break
    $skip
    color:server from:$dayunknown/05/2002 till:$dayunknown/01/2004 text:"[[Xserve]]"
    $skip
    color:0402 from:15/11/1997 till:05/01/1999 text:"[[Power Macintosh G3|G3]]"
    color:040 from:$dayunknown/07/1997 till:$dayunknown/03/1998 text:"[[Twentieth Anniversary Macintosh|TAM]]"
   barset:break
    $skip
    color:server2 from:$dayunknown/01/2004 till:$now text:"[[Xserve G5]]"
    $skip
    color:040 from:05/01/1999 till:31/08/1999 text:"[[Power Macintosh G3 (Bleu et Blanc)|G3]]"
    color:040 from:$dayunknown/07/2000 till:$dayunknown/07/2001 text:"[[Power Mac G4 Cube|Cube]]"
   barset:break
    color:edu from:$dayunknown/04/2002 till:$dayunknown/10/2005 text:"[[eMac]]"
    $skip
    $skip
    color:0402 from:31/08/1999 till:$dayunknown/06/2004 text:"[[Power Mac G4]]"
   barset:break
    $skip
    $skip
    $skip
    color:040 from:$dayunknown/06/2003 till:$now text:"[[Power Mac G5]]"
   barset:break
    $newworldstart
    $newworldstart
    $newworldstart
    at:$dayunknown/01/1999 mark:(line,red)
    $newworldstart
    $newworldstart
    $newworldstart
    $newworldstart
   barset:break
    $skip
    color:current from:$now till:end
    $skip
    color:current from:$now till:end

  barset:portable
    color:portable from:20/09/1989 till:21/10/1991 text:"[[Macintosh Portable|Portable]]"
   barset:break
    color:portable2 from:21/10/1991 till:01/09/1996 text:"[[PowerBook|PowerBook 68k]]"
    $skip
    color:portable from:$dayunknown/10/1992 till:$dayunknown/02/1997 text:"[[PowerBook Duo]]"
   barset:break
    $skip
    color:portable from:25/08/1995 till:14/03/1998 text:"[[PowerBook|PB PPC]]"
    $skip
   barset:break
    at:10/05/1999 mark:(line,red)
    $newworldstart
    $newworldstart
    $newworldstart
   barset:break
    color:portable from:15/11/1997 till:09/01/2001 text:"[[PowerBook G3]]"
    $skip
    $skip
    color:portable from:$dayunknown/07/1999 till:$dayunknown/05/2001 text:"[[iBook (première génération)|iBook]]"
   barset:break
    color:portable2 from:09/01/2001 till:$dayunknown/01/2003 text:"[[PowerBook G4|PB G4]]"
    $skip
    $skip
    color:portable2 from:$dayunknown/05/2001 till:$dayunknown/10/2003 text:"[[iBook (deuxième génération)|iBook blanc]]"
   barset:break
    color:portable from:$dayunknown/01/2003 till:$now text:"[[PowerBook G4 17"|PB G4 Alu]]"
    $skip
    $skip
    color:portable from:$dayunknown/10/2003 till:$now text:"[[iBook (deuxième génération)|iBook G4]]"
   barset:break
    $skip
    $skip
    color:portable from:10/01/2006 till:$now text:"[[MacBook Pro]]"
    $skip
   barset:break
    color:current from:$now till:end
    $skip
    color:current from:$now till:end
    color:current from:$now till:end
| Pays-Bas | top next |

Initial version by Florival fr on Saturday, March 11, 2006
TimeAxis = orientation:hor format:yyyyyy
ImageSize = width:800 height:340
PlotArea = width:760 height:300 bottom:20 left:20

Colors =
  id:canvas value:rgb(0.97,0.97,0.97)
  id:grid1  value:rgb(0.86,0.86,0.86)
  id:grid2  value:gray(0.8)
  id:bars   value:rgb(0.7,0.7,0.7)

BackgroundColors = canvas:canvas

Period     = from:0 till:750000
ScaleMajor = unit:year increment:50000 start:0 gridcolor:grid1

BarData=
  barset:Bands

LineData =
  at:100000 color:grid2 layer:back

PlotData=

# set defaults
  width:12 fontsize:M textcolor:black align:center shift:(4,-5) color:bars
  barset:Bands

  from:1 till:742011 text:[[Amsterdam|Amsterdam (Capitale) avec 742.011 habitants]]
  from:1 till:589156 text:[[Rotterdam]]
  from:1 till:474291 text:[[La Haye|Den Haag]]
  from:1 till:281025 text:[[Utrecht]]
  from:1 till:209740 text:[[Eindhoven]]
  from:1 till:200217 text:[[Tilburg]]
  from:1 till:180487 text:[[Groningue (ville)|Groningen]]
  from:1 till:178284 text:[[Almere]]
  from:1 till:169998 text:[[Breda]]
  from:1 till:159447 text:[[Nimègue|Nijmegen]]
  from:1 till:156069 text:[[Apeldoorn]]
  from:1 till:154182 text:[[Enschede]]
  from:1 till:146638 text:[[Haarlem]]
  from:1 till:142194 text:[[Arnhem]]
  from:1 till:134904 text:[[Amersfoort]]
  from:1 till:134793 text:[[Bois-le-Duc|'s-Hertogenbosch]]
  from:1 till:120302 text:[[Maastricht]]
  from:1 till:118887 text:[[Dordrecht]]
  from:1 till:118340 text:[[Leyde|Leiden]]
  from:1 till:117222 text:[[Zoetermeer]]
  from:1 till:112905 text:[[Zwolle]]
| Présocratiques | top next |

First version by Caton on Thursday, January 6, 2005, last update on Saturday, April 8, 2006
DateFormat = yyyy
ImageSize  = width:800 height:350
PlotArea   = left:20 right:20 bottom:20 top:10
Colors     =
  id:prehistoire  value:rgb(0.7,0.5,1)
  id:protohistoire value:rgb(1,0.7,0.7)
  id:noir              value:black
  id:canvas            value:rgb(0.97,0.97,0.97)
  id:Holo     value:rgb(0.4,0.8,0.7)
  id:PSup     value:rgb(0.5,1,0.5)
  id:PMoy     value:rgb(0.6,1,0.6)
  id:PInf     value:rgb(0.7,1,0.7) # vert clair
  id:Plio     value:rgb(0.8,1,0.8) # vert pâle
  id:gris              value:gray(0.80)
  id:grilleMajor       value:rgb(0.80,0.80,0.80)
  id:bleuclair         value:rgb(0.56,0.56,0.86)
  id:rouge             value:red
  id:rougeclair        value:rgb(0.86,0.56,0.56)
  id:bleu              value:rgb(0.76,0.76,0.96)
  id:grilleMinor       value:rgb(0.86,0.86,0.86)

Period     = from:-640 till:-360
TimeAxis   = orientation:horizontal format:yyyy
AlignBars  = justify
ScaleMinor = unit:year increment:10 start:-630 gridcolor:grilleMinor
ScaleMajor = unit:year increment:20 start:-640 gridcolor:grilleMajor
BackgroundColors = canvas:canvas bars:canvas
BarData=
  barset:inventions

Define $marquerouge   = text:"*" textcolor:rouge   shift:(0,3) fontsize:10

PlotData=
  barset:inventions width:15
  from:-625  till:-547 text:"[[Thalès de Milet]]" color:Plio anchor:from
  from:-611  till:-547 text:"[[Anaximandre]]" color:Pinf anchor:from
  from:-585  till:-525 text:"[[Anaximène]]" color:Pinf anchor:from
  from:-580  till:-490  text:"[[Pythagore]]" color:Pinf anchor:from
  from:-545  till:-480  text:"[[Héraclite d'Éphèse|Héraclite]]" color:Pinf anchor:from
  from:-580  till:-470  text:"[[Xénophane de Colophon|Xénophane]]" color:Pinf anchor:from
  from:-510  till:-450  text:"[[Parménide]]" color:Pinf anchor:from
  from:-495  till:-430  text:"[[Zénon d'Élée]]" color:Pinf anchor:from
  from:-500  till:-428  text:"[[Anaxagore de Clazomènes|Anaxagore]]" color:Pinf anchor:from
  from:-484  till:-424  text:"[[Empédocle d'Agrigente]]" color:Pinf anchor:from
  from:-485  till:-420  text:"[[Protagoras]]" color:Pinf anchor:from
  from:-460  till:-399  text:"[[Prodicos de Céos|Prodicos]]" color:Pinf anchor:from
  from:-480  till:-410  text:"[[Antiphon]]" color:Pinf anchor:from
  from:-480  till:-370  text:"[[Gorgias]]" color:Pinf anchor:from
  from:-460  till:-370  text:"[[Leucippe]]" color:Pinf anchor:from
  from:-460  till:-370  text:"[[Démocrite]]" color:Pinf anchor:from
  from:-470  till:-399  text:"[[Socrate]]" color:Pinf anchor:from
| Tour Eiffel | top next |

First version by Kuxu on Saturday, June 3, 2006, last update on Monday, June 19, 2006
DateFormat = yyyy
ImageSize = width:800 height:auto barincrement:25
PlotArea = left:10 right:10 bottom:30 top:15

Colors =
 id:canvas value:rgb(0.97,0.97,0.97)
 id:grid1 value:gray(0.75)
 id:grid2 value:rgb(0.86,0.86,0.86)
 id:gris1 value:gray(0.85)
 id:gris2 value:gray(0.70)
 id:noir value:black
 id:blanc value:white

Period = from:1300 till:2006
TimeAxis = orientation:horizontal format:yyyy
ScaleMajor = unit:year increment:100 start:1300 gridcolor:grid1
ScaleMinor = unit:year increment:25 start:1300 gridcolor:grid2
AlignBars = justify

BackgroundColors = canvas:canvas bars:canvas

BarData=
 bar:Timeperiod
 barset:gris1

PlotData=
 width:20 fontsize:M textcolor:noir align:center

 # Les bâtiments
 width:20 fontsize:S textcolor:black anchor:from align:left color:gris1
 barset:gris1
 from:1300 till:1549 text:"1300-1549 Lincoln Cathedral, Lincoln, Angleterre, 160 m"
 align:right
 from:1549 till:1625 text:"1549-1625 Oleviste kirik, Tallinn, Estonie, 159 m"
 from:1625 till:1847 text:"1625-1847 Cathédrale Notre-Dame, Strasbourg, France, 143 m"
 from:1847 till:1876 text:"1847-1876 St.-Nikolai-Kirche, Hambourg, Allemagne, 147 m"
 from:1876 till:1880 text:"1876-1880 Cathédrale Notre-Dame, Rouen, France, 151 m"
 from:1880 till:1884 text:"1880-1884 Kölner Dom, Cologne, Allemagne, 157 m"
 from:1884 till:1889 text:"1884-1889 Washington Monument, Washington, District de Columbia, États-Unis d'Amérique, 169 m"
 from:1889 till:1930 color:gris2 text:"1889-1930 Tour Eiffel, Paris, France, 300 m"
 from:1930 till:1931 text:"1930-1931 Chrysler Building, New York, État de New York, États-Unis d'Amérique, 319 m"
 from:1931 till:1954 text:"1931-1954 Empire State Building, New York, État de New York, États-Unis d'Amérique, 381 m"
 from:1954 till:1956 text:"1954-1956 Griffin Television Tower Oklahoma, Oklahoma City, État de l'Oklahoma, États-Unis d'Amérique, 481 m"
 from:1956 till:1959 text:"1956-1959 KOBR-TV Tower, Roswell, État du Nouveau-Mexique, États-Unis d'Amérique, 491 m"
 from:1959 till:1960 text:"1959-1960 WGME TV Tower, Raymond, État du Maine, États-Unis d'Amérique, 495 m"
 from:1960 till:1962 text:"1960-1962 KFVS TV Mast, Cape Girardeau County, État du Missouri, États-Unis d'Amérique, 511 m"
 from:1962 till:1963 text:"1962-1963 Ray-Com Media Tower Cusseta, Columbus, État de Georgie, États-Unis d'Amérique, 533 m"
 from:1963 till:1963 text:"septembre 1963-novembre 1963 WIMZ-FM-Tower, Knoxville, État du Tennessee, États-Unis d'Amérique, 534 m"
 from:1963 till:1974 text:"1963-1974 KVLY-TV mast, Blanchard, État du Dakota du Nord, États-Unis d'Amérique, 629 m"
 from:1974 till:1991 text:"1974-1991 Maszt radiowy w Konstantynowie, Konstantynów, Pologne, 646 m"
 from:1991 till:2006 text:"1991-2006 KVLY-TV mast, Blanchard, État du Dakota du Nord, États-Unis d'Amérique, 629 m"
| Cinquième République | top next |

First version by Suprieur on Thursday, February 16, 2006, last update on Thursday, June 22, 2006
ImageSize  = width:620 height:70
PlotArea   = width:590 height:50 left:30 bottom:20
DateFormat = yyyy
Period     = from:1959 till:2007
TimeAxis   = orientation:horizontal
ScaleMajor = unit:year increment:5 start:1960
PlotData=
 color:white width:45 mark:(line,white) align:center fontsize:S
 color:blue  from:start till:1969 shift:(0,-2) textcolor:white   text:"Charles de Gaulle"
 color:blue  from:1969 till:1974 shift:(0,4) textcolor:white  text:"Georges~Pompidou"
 color:blue  from:1974 till:1981 shift:(0,4)  textcolor:white  text:"Valéry~Giscard d'Estaing"
 color:red  from:1981 till:1995 shift:(0,-2)  textcolor:white  text:"François Mitterrand"
  color:blue  from:1995 till:end shift:(0,-2)  textcolor:white  text:"Jacques Chirac"
| Meximieux | top next |

Initial version by 210.19.249.117 on Friday, June 9, 2006
Colors=
  id:lightgrey value:gray(0.9)
  id:darkgrey  value:gray(0.7)
  id:sfondo value:rgb(1,1,1)
  id:barra value:rgb(0.6,0.7,0.8)

ImageSize  = width:350 height:373
PlotArea   = left:50 bottom:50 top:30 right:30
DateFormat = x.y
Period     = from:0 till:7000
TimeAxis   = orientation:vertical
AlignBars  = justify
ScaleMajor = gridcolor:darkgrey increment:500 start:0
ScaleMinor = gridcolor:lightgrey increment:100 start:0
BackgroundColors = canvas:sfondo

BarData=
  bar:1962 text:1962
  bar:1968 text:1968
  bar:1975 text:1975
  bar:1982 text:1982
  bar:1990 text:1990
  bar:1999 text:1999

PlotData=
  color:barra width:30 align:left

  bar:1962 from:0 till: 2392
  bar:1968 from:0 till: 2669
  bar:1975 from:0 till: 3457
  bar:1982 from:0 till: 4253
  bar:1990 from:0 till: 6230
  bar:1999 from:0 till: 6840

PlotData=

  bar:1962 at: 2392 fontsize:S text: 2.392 shift:(-8,5)
  bar:1968 at: 2669 fontsize:S text: 2.669 shift:(-10,5)
  bar:1975 at: 3457 fontsize:S text: 3.457 shift:(-10,5)
  bar:1982 at: 4253 fontsize:S text: 4.253 shift:(-10,5)
  bar:1990 at: 6230 fontsize:S text: 6.230 shift:(-10,5)
  bar:1999 at: 6840 fontsize:S text: 6.840 shift:(-10,5)

TextData=
  fontsize:S pos:(20,20)
  text:Source INSEE - Création graphique de Wikipédia
| Forbach | top next |

First version by Kyle the hacker on Wednesday, April 5, 2006, last update on Saturday, June 24, 2006
ImageSize  = width:250 height:200
PlotArea   = left:40 right:10 top:10 bottom:20
TimeAxis   = orientation:horizontal
AlignBars  = justify
Colors =
  id:gray1 value:gray(0.9)

DateFormat = yyyy
Period     = from:1960 till:2010
ScaleMajor = unit:year increment:10 start:1960

PlotData =
  bar:39000 color:gray1 width:1
  from:start till:end
  bar:26000 color:gray1
  from:start till:end
  bar:13000 color:gray1
  from:start till:end
  bar:0 color:gray1


LineData =
  layer:front
  points:(48,115)(84,121) color:blue  width:2 #1962 tot 1968. Inwonertal 1962: 21704 1968: 23120
  points:(84,121)(100,130)   color:blue    width:2 #1975: 25244
  points:(100,130)(128,139)  color:blue    width:2 #1982: 27187
  points:(128,139)(160,138)  color:blue    width:2 #1990: 27076
  points:(160,138)(196,119)  color:blue    width:2 #1999: 22807
| Empire romain | top next |

First version by Dédé13 ? on Wednesday, April 13, 2005, last update on Monday, June 12, 2006
Preset    = TimeHorizontal_AutoPlaceBars_UnitYear
ImageSize = width:800 barincrement:25
PlotArea  = left:30 right:45 bottom:40

Colors     =
  id:canvas  value:rgb(0.97,0.97,0.97)
  id:white  value:rgb(1,1,1)
  id:subtitle  value:gray(0.5)
  id:grid1   value:gray(0.7)
  id:grid2   value:gray(0.88)
  id:black   value:rgb(0,0,0)
  id:events value:rgb(0.75,1,0.75)
  id:mark1   value:rgb(0,0.7,0)
  id:mark2   value:rgb(0.7,0,0)
  id:years   value:gray(0.5)
  id:period1 value:rgb(1,1,0)
  id:period2 value:rgb(1,0.75,0)
  id:cesar   value:rgb(1,0.8,0.8) legend:Caesar
  id:auguste value:rgb(1,0.4,0.4) legend:Augustus

BackgroundColors = canvas:canvas

Period     = from:-150 till:150
ScaleMajor = unit:year increment:100 start:-150 gridcolor:grid1
ScaleMinor = unit:year increment:10 start:-150 gridcolor:grid2
AlignBars  = justify

BarData=

  bar:title
  bar:dummy0 # separator
  bar:title_emperors
  bar:emperors1
  bar:emperors2
  bar:emperors3
  bar:emperors4
  bar:title_events
  barset:events
  bar:dummy2 # separator
  bar:title_periods
  bar:periods

# explanation: attribute 'barset' instead of 'bar' means consecutive data lines are automatically placed on new bar
#              data lines are lines containing at: or from: & till: attributes
#              'barset:break' means 'reset barcounter' = next line will be placed at first bar in barset
#              'barset:skip'  means 'increment barcounter' = skip one bar for next data line (to allow extra space
#                                                                              for text containing line break = ~)

PlotData =

  mark:(line,black)

  fontsize:M
  width:16

  shift:(5,-6)

  bar:title    from:start till:end text:"Empire romain" fontsize:XL anchor:middle align:center width:25 color:canvas mark:(line,canvas)
  bar:title_emperors    from:start till:end text:[[Empereur_romain|Empereurs]] fontsize:M anchor:middle align:center width:10 color:subtitle
  bar:title_events    from:start till:end text:"Evénements" fontsize:M anchor:middle align:center width:10 color:subtitle mark:(line,white)
  bar:title_periods    from:start till:end text:"Périodes" fontsize:M anchor:middle align:center width:10 color:subtitle mark:(line,white)

  shift:(5,-5)
  fontsize:S
  mark:(line,mark1)

  color:events

  barset:events
  from:-58 till:-49 text:[[Guerre_des_Gaules]]
  at:-47 text:[[Bataille de Zéla]]
  at:-44 text:Assassinat de Jules César
  at:-31 text:[[Bataille d'Actium]]
  at:-27 text:[[Panthéon_de_Rome|Construction du Panthéon]]
  from:-26 till:-19 text:[[Pyrénées|Guerre dans les Pyrénées]]
  at:-1 at:-18 text:[[lex Julia]]
  at:106 text:[[Dacie|Conquête Dacie (Roumanie)]]
  barset:break
  at:9 text:[[lex Papia Poppaea]]
  at:9 text:[[Bataille de Teutoburg]]
  barset:skip
  at:47 text:[[Grande-Bretagne|Conquête de la Grande-Bretagne]]
  at:64 text:[[Grand incendie de Rome]]
  at:65 text:[[Conspiration de Pison]]
  barset:break
  from:72 till:80 shift:(2,1) fontsize:XS text:[[Colisée|Construction du Colisée]]
  barset:skip
  at:79 text:[[Pompéi|Destruction de Pompéi]]
  at:125 fontsize:XS shift:(2,1) text:Reconstruction du~[[Panthéon_de_Rome]]
  barset:break

  mark:(none,mark2)
  color:auguste

  width:22

  bar:emperors1
  from:-23 till:14 text:[[Auguste]]
  from:41 till:54 text:[[Claude]]
  from:68 till:69 shift:(1,0) fontsize:XS text:[[Galba]]
  from:79 till:81 shift:(1,-11) fontsize:XS text:[[Titus]]
  from:96 till:98 text:[[Nerva]]
  from:138 till:end shift:(-15,-1) fontsize:XS text:[[Antonin_le_Pieux]] color:auguste

  bar:emperors2
  from:14 till:37 text:[[Tibère]]
  from:54 till:68 text:[[Néron]]
  from:69 till:69 text:[[Vitellius]]
  from:98 till:117 text:[[Trajan]]

  bar:emperors3
  from:37 till:41 text:[[Caligula]] color:auguste
  from:69 till:79 text:[[Vespasien]] color:auguste
  from:117 till:138 text:[[Hadrien]]

  bar:emperors4
  from:69 till:69 shift:(1,0) fontsize:XS text:[[Othon]]
  from:81 till:96 shift:(1,-11) fontsize:XS text:[[Domitien]]

  width:22
  bar:periods
  from:14 till:69 shift:(4,-10) color:period1 text:[[Dynastie_Julio-Claudienne]]
  from:69 till:69 shift:(4,1) color:period2 text:[[Année_des_quatre_empereurs]]
  from:96 till:end shift:(4,-10) color:period1 text:[[Flaviens]] et [[Antonins]]
  width:8
| Empire romain | top next |

First version by Dédé13 ? on Wednesday, April 13, 2005, last update on Monday, June 12, 2006
Preset    = TimeHorizontal_AutoPlaceBars_UnitYear
ImageSize = width:800 barincrement:25
PlotArea  = left:30 right:45 bottom:40

Colors     =
  id:canvas  value:rgb(0.97,0.97,0.97)
  id:white  value:rgb(1,1,1)
  id:subtitle  value:gray(0.5)
  id:grid1   value:gray(0.7)
  id:grid2   value:gray(0.88)
  id:black   value:rgb(0,0,0)
  id:events value:rgb(0.75,1,0.75)
  id:mark1   value:rgb(0,0.7,0)
  id:mark2   value:rgb(0.7,0,0)
  id:years   value:gray(0.5)
  id:period1 value:rgb(1,1,0)
  id:period2 value:rgb(1,0.75,0)
  id:caesar   value:rgb(1,0.8,0.8)
  id:augustus value:rgb(1,0.4,0.4)
  id:eastern value:rgb(1,0.8,0.4) legend:Empire_oriental
  id:western value:rgb(1,0.4,0.8) legend:Empire_occidental
#  id:caesar   value:rgb(1,0.8,0.8) legend:Caesar
#  id:augustus value:rgb(1,0.4,0.4) legend:Augustus

BackgroundColors = canvas:canvas

Period     = from:150 till:450
ScaleMajor = unit:year increment:100 start:150 gridcolor:grid1
ScaleMinor = unit:year increment:10 start:150 gridcolor:grid2
AlignBars  = justify

BarData=

  bar:title_emperors
  bar:emperors1
  bar:emperors2
  bar:emperors3
  bar:emperors4
  bar:title_events
  barset:events
  bar:dummy2 # separator
  bar:title_periods
  bar:periods


PlotData =

  mark:(line,black)

  fontsize:M
  width:16

  shift:(5,-6)

  bar:title_emperors    from:start till:end text:[[Empereur_romain]] fontsize:M anchor:middle align:center width:10 color:subtitle
  bar:title_events    from:start till:end text:"Evènements" fontsize:M anchor:middle align:center width:10 color:subtitle mark:(line,white)
  bar:title_periods    from:start till:end text:"Périodes" fontsize:M anchor:middle align:center width:10 color:subtitle mark:(line,white)

  shift:(5,-5)
  fontsize:S
  mark:(line,mark1)

  color:events

  barset:events
  from:212 till:216 shift:(2,1) fontsize:XS text:Construction des~[[Thermes_de_Caracalla]]
  at:251 text:[[Bataille_d'Abrittus]]
  from:256 till:end text:[[Daces|Indépendance de la partie de la Dacie située au nord du Danube (Roumanie, Moldavie, etc)]]
  from:258 till:274 text:[[Empire_gaulois]]
  at:284 text:[[Révolte_des_Bagaudes]]
  barset:break
  at:268 text:[[Bataille_de_Naissus]]
  at:313 text:[[Édit_de_Milan]]
  barset:break
  at:378 text:[[Bataille_d'Adrianople]]

  mark:(none,mark2)
  color:augustus

  width:22

  bar:emperors1
  from:start till:161 shift:(1,0) fontsize:XS text:[[Antonin_le_Pieux]] color:augustus
  from:175 till:175 shift:(1,0) fontsize:XS text:[[Avidius_Cassius]] color:caesar
  from:193 till:211 shift:(0,0) color:augustus fontsize:XS text:[[Septime_Sévère]]
  from:218 till:222 shift:(-10,0) fontsize:XS text:[[Élagabal]]
  from:235 till:238 shift:(2,0) fontsize:XS text:[[Maximin_le_Thrace]]
  from:249 till:251 shift:(2,-11) fontsize:XS text:[[Dèce]]
  from:268 till:270 shift:(1,0) fontsize:XS text:[[Claude_le_Gothique]]
  from:276 till:276 shift:(1,-11) fontsize:XS text:[[Florien]]
  from:285 till:305 shift:(30,0) fontsize:XS text:[[Diocletien]]
  from:308 till:313 shift:(1,-11) fontsize:XS text:[[Maximien_Hercule]]
  from:337 till:361 shift:(1,-11) fontsize:XS text:[[Constance II]]
  from:364 till:375 shift:(1,0) fontsize:XS text:[[Valentinien_Ier]] color:western
  from:379 till:395 shift:(1,-11) fontsize:XS text:[[Théodose]]
  from:408 till:450 shift:(1,0) fontsize:XS text:[[Théodose_II]] color:eastern

  bar:emperors2
  from:161 till:180 shift:(2,0) fontsize:XS text:[[Marc_Aurèle]]
  from:192 till:193 shift:(1,0) fontsize:XS text:[[Pertinax]]
  from:211 till:217 shift:(-30,-11) fontsize:XS text:[[Caracalla]]
  from:222 till:235 shift:(1,0) fontsize:XS text:[[Sévère_Alexandre]]
  from:238 till:238 shift:(1,-11) fontsize:XS text:[[Gordien_Ier]]+
  from:238 till:238 shift:(51,-11) fontsize:XS text:[[Gordien_II]]
  from:253 till:260 shift:(1,0) fontsize:XS text:[[Gallien]] color: caesar
  from:260 till:268
  from:275 till:276 shift:(1,-11) fontsize:XS text:[[Tacite,_Marcus_Claudius]]
  from:282 till:283 shift:(1,0) fontsize:XS text:[[Carus]]
  from:305 till:306 shift:(1,0) fontsize:XS text:[[Constance_Chlore]] color:augustus
  from:308 till:324 shift:(1,-11) fontsize:XS text:[[Licinius]]
  from:337 till:350 shift:(1,-11) fontsize:XS text:[[Constance]]
  from:363 till:364 shift:(1,0) fontsize:XS text:[[Jovien]]
  from:375 till:383 shift:(1,-11) fontsize:XS text:[[Gratien]]
  from:395 till:423 shift:(1,0) fontsize:XS text:[[Honorius]] color:western

  bar:emperors3
  from:161 till:169 shift:(1,0) fontsize:XS text:[[Lucius_Verus]]
  from:177 till:180 color:caesar
  from:180 till:192 shift:(1,0) fontsize:XS text:[[Commodus|Commode]] color:augustus
  from:209 till:211 shift:(-20,-11) fontsize:XS text:[[Geta]]
  from:217 till:218 shift:(1,0) fontsize:XS text:[[Macrin]] color:augustus
  from:238 till:244 shift:(-30,-11) fontsize:XS text:[[Gordien_III]]
  from:253 till:260 shift:(1,0) fontsize:XS text:[[Valérien]]
  from:270 till:275 shift:(-25,-11) fontsize:XS text:[[Aurélien]] color:augustus
  from:276 till:282 shift:(1,0) fontsize:XS text:[[Probus]]
  from:286 till:305 shift:(1,-11) fontsize:XS text:[[Dioclétien]] color:augustus
  from:306 till:337 shift:(1,0) fontsize:XS text:[[Constantin_Ier]]
  from:361 till:363 shift:(1,0) fontsize:XS text:[[Julien]]
  from:375 till:387 shift:(1,-11) fontsize:XS text:[[Valentinien_II]] color:western
  from:388 till:392 color:western
  from:395 till:408 shift:(1,0) fontsize:XS text:[[Arcadius]] color:eastern

  bar:emperors4
  from:193 till:193 shift:(-76,-11) fontsize:XS text:[[Didius_Julianus]]
  from:217 till:218 color:caesar
  from:218 till:218 shift:(1,-11) fontsize:XS text:[[Diaduménien]]
  from:238 till:238 shift:(1,-22) fontsize:XS text:[[Maxime_Pupien]] et [[Balbin]]
  from:244 till:249 shift:(1,-11) fontsize:XS text:[[Philippe_l'Arabe]]
  from:251 till:251 shift:(1,0) fontsize:XS text:[[Herennius_Etruscus]]
  from:283 till:285 shift:(1,-11) fontsize:XS text:[[Carinus]]+
  from:283 till:285 shift:(42,-11) fontsize:XS text:[[Numérien]]
  from:305 till:311 shift:(1,0) fontsize:XS text:[[Galère]]
  from:337 till:340 shift:(1,0) fontsize:XS text:[[Constantin_II]]
  from:364 till:378 shift:(1,-11) fontsize:XS text:[[Valens]] color:eastern
  from:421 till:421 shift:(1,0) fontsize:XS text:[[Constantin_III]] color:western

  width:22
  bar:periods
  from:start till:193 shift:(4,-10) color:period1 text:[[Flaviens]] et [[Antonins]]
  from:193 till:235 shift:(4,1) color:period2 text:[[Dynastie_des_Sévères]]
  from:235 till:275 shift:(4,-10) color:period1 text:[[Crise_du_3ème_siècle]]
  from:313 till:395 shift:(4,1) color:period2 text:Empire chrétien
  width:8
| Touques | top next |

First version by Teddyyy on Thursday, May 18, 2006, last update on Friday, July 28, 2006
ImageSize  = width:250 height:200
PlotArea   = left:40 right:10 top:10 bottom:20
TimeAxis   = orientation:horizontal
AlignBars  = justify
Colors =
  id:gray1 value:gray(0.9)

DateFormat = yyyy
Period     = from:1960 till:2010
ScaleMajor = unit:year increment:10 start:1960

PlotData =
  bar:4800 color:gray1 width:1
  from:start till:end
  bar:3200 color:gray1
  from:start till:end
  bar:1600 color:gray1
  from:start till:end
  bar:0 color:gray1


LineData =
  layer:front
  points:(48,72)(84,76) color:blue  width:2 #1962 tot 1968. Inwonertal 1962: 1469 1968: 1587
  points:(84,76)(100,75)    color:blue    width:2 #1975: 1561
  points:(100,75)(128,99)   color:blue    width:2 #1982: 2237
  points:(128,99)(160,129)   color:blue    width:2 #1990: 3070
  points:(160,129)(196,144)   color:blue    width:2 #1999: 3500
| Le Mesnil-Opac | top next |

First version by Teddyyy on Monday, June 12, 2006, last update on Tuesday, June 13, 2006
ImageSize  = width:250 height:200
PlotArea   = left:40 right:10 top:10 bottom:20
TimeAxis   = orientation:horizontal
AlignBars  = justify
Colors =
  id:gray1 value:gray(0.9)

DateFormat = yyyy
Period     = from:1960 till:2010
ScaleMajor = unit:year increment:10 start:1960

PlotData =
  bar:390 color:gray1 width:1
  from:start till:end
  bar:260 color:gray1
  from:start till:end
  bar:130 color:gray1
  from:start till:end
  bar:0 color:gray1


LineData =
  layer:front
  points:(48,144)(84,136) color:blue  width:2 #1962 tot 1968. Inwonertal 1962: 285 1968: 265
  points:(84,136)(100,103)    color:blue    width:2 #1975: 190
  points:(100,103)(128,112)   color:blue    width:2 #1982: 211
  points:(128,112)(160,107)   color:blue    width:2 #1990: 200
  points:(160,107)(196,114)   color:blue    width:2 #1999: 215
  points:(196,114)(228,120)     color:blue    width:2 #2004/5
| Président de la République française | top next |

First version by Suprieur on Thursday, February 16, 2006, last update on Thursday, April 20, 2006
ImageSize  = width:620 height:70
PlotArea   = width:590 height:50 left:30 bottom:20
DateFormat = yyyy
Period     = from:1959 till:2007
TimeAxis   = orientation:horizontal
ScaleMajor = unit:year increment:5 start:1960
PlotData=
 color:white width:45 mark:(line,white) align:center fontsize:S
 color:blue  from:start till:1969 shift:(0,-2)  textcolor:white   text:"Charles de Gaulle"
 color:blue  from:1969 till:1974 shift:(0,4)  textcolor:white  text:"Georges~Pompidou"
 color:blue  from:1974 till:1981 shift:(0,4)   textcolor:white  text:"Valéry~Giscard d'Estaing"
 color:pink  from:1981 till:1995 shift:(0,-2)   textcolor:blue  text:"François Mitterrand"
  color:blue  from:1995 till:end shift:(0,-2)   textcolor:white  text:"Jacques Chirac"
| Liste des empereurs byzantins | top next |

First version by Neuceu on Monday, August 22, 2005, last update on Saturday, February 11, 2006
ImageSize = width:1000 height:100
PlotArea  = width:960 height:60 left:20 bottom:20

Period   = from:300 till:1500
TimeAxis  = orientation:horizontal
ScaleMajor = unit:year increment:100 start:300
ScaleMinor = unit:year increment:50 start:300

Colors =
  id:theodosiens  value:rgb(0.7,0.7,1) # light yellow
  id:justiniens   value:rgb(1,0.7,0.7) # light red
  id:heraclides   value:rgb(0.7,1,0.7) # light green
  id:isauriens   value:rgb(1,1,0.7)  # light blue
  id:amauriens   value:rgb(0.7,1,1)  # light blue
  id:macedoniens  value:rgb(1,0.7,1)  # light purple
  id:comnenes    value:gray(0.8)   # grey


LineData =
 width:1

 at:   330 color:blue tillpos:60
 at:   476 color:blue tillpos:60
 at:   1204 color:blue tillpos:60
 at:   1453 color:blue tillpos:60

PlotData=
 align:center textcolor:black fontsize:8 mark:(line,black) width:25 shift:(0,-5)

 at:   330  align:center shift:(0,50) text:[[Constantinople|Création de~Constantinople~(330)]]
 at:   476  align:center shift:(0,50) text:[[Chute de Rome|Chute de Rome (476)]]
 at:   1204  align:center shift:(0,50) text:[[Quatrième croisade|Quatrième croisade (1204)]]
 at:   1453  align:center shift:(0,50) text:[[Constantinople|Chute de~Constantinople~(1453)]]

 from:  364  till: 518 text:[[Théodosiens]]  color:theodosiens
 from:  518  till: 610 text:Justininens  color:justiniens
 from:  610  till: 717 text:Héraclides  color:heraclides
 from:  717  till: 820 text:Isauriens   color:isauriens
 from:  820  till: 867 text:Amauriens   color:amauriens  shift:(0,5)
 from:  867  till: 1057 text:Macédoniens  color:macedoniens
 from:  1057  till: 1185 text:Comnènes   color:comnenes
 from:  1185  till: 1204 text:Anges     color:theodosiens shift:(0,5)
 from:  1204  till: 1261 text:Lascaris   color:justiniens shift:(0,-8)
 from:  1259  till: 1453 text:Paléologues  color:heraclides
| Aire-sur-l'Adour | top next |

Initial version by Thbz on Sunday, July 2, 2006
Colors=
  id:lightgrey value:gray(0.9)
  id:darkgrey  value:gray(0.7)
  id:sfondo value:rgb(1,1,1)
  id:barra value:rgb(0.6,0.7,0.8)

ImageSize  = width:350 height:373
PlotArea   = left:50 bottom:50 top:30 right:30
DateFormat = x.y
Period     = from:0 till:6500
TimeAxis   = orientation:vertical
AlignBars  = justify
ScaleMajor = gridcolor:darkgrey increment:500 start:0
ScaleMinor = gridcolor:lightgrey increment:100 start:0
BackgroundColors = canvas:sfondo

BarData=
  bar:1962 text:1962
  bar:1968 text:1968
  bar:1975 text:1975
  bar:1982 text:1982
  bar:1990 text:1990
  bar:1999 text:1999

PlotData=
  color:barra width:30 align:left

  bar:1962 from:0 till: 5168
  bar:1968 from:0 till: 5665
  bar:1975 from:0 till: 5896
  bar:1982 from:0 till: 6242
  bar:1990 from:0 till: 6205
  bar:1999 from:0 till: 6003

PlotData=

  bar:1962 at: 5168 fontsize:S text: 5.168 shift:(-8,5)
  bar:1968 at: 5665 fontsize:S text: 5.665 shift:(-10,5)
  bar:1975 at: 5896 fontsize:S text: 5.896 shift:(-10,5)
  bar:1982 at: 6242 fontsize:S text: 6.242 shift:(-10,5)
  bar:1990 at: 6205 fontsize:S text: 6.205 shift:(-10,5)
  bar:1999 at: 6003 fontsize:S text: 6.003 shift:(-10,5)

TextData=
  fontsize:S pos:(20,20)
  text:données INSEE - graphique Wikipédia
| Annecy-le-Vieux | top next |

First version by SpeedDemon74 on Tuesday, June 6, 2006, last update on Tuesday, July 11, 2006
ImageSize  = width:250 height:200
PlotArea   = left:40 right:10 top:10 bottom:20
TimeAxis   = orientation:horizontal
AlignBars  = justify
Colors =
  id:gray1 value:gray(0.9)

DateFormat = yyyy
Period     = from:1960 till:2010
ScaleMajor = unit:year increment:10 start:1960

PlotData =
  bar:27000 color:gray1 width:1
  from:start till:end
  bar:18000 color:gray1
  from:start till:end
  bar:9000 color:gray1
  from:start till:end
  bar:0 color:gray1


LineData =
  layer:front
  points:(48,49)(84,63) color:blue  width:2 #1962 tot 1968. Inwonertal 1962: 4681 1968: 6754
  points:(84,63)(100,105)    color:blue    width:2 #1975: 13537
  points:(100,105)(128,108)   color:blue    width:2 #1982: 14054
  points:(128,108)(160,130)   color:blue    width:2 #1990: 17520
  points:(160,130)(196,139)   color:blue    width:2 #1999: 18885
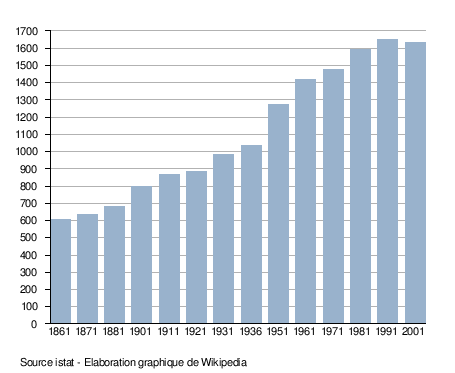
| Sardaigne | top next |
Initial version by Yugiz on Wednesday, April 12, 2006
Colors=
  id:lightgrey value:gray(0.9)
  id:darkgrey  value:gray(0.7)
  id:sfondo value:rgb(1,1,1)
  id:barra value:rgb(0.6,0.7,0.8)

ImageSize  = width:455 height:373
PlotArea   = left:50 bottom:50 top:30 right:30
DateFormat = x.y
Period     = from:0 till:1700
TimeAxis   = orientation:vertical
AlignBars  = justify
ScaleMajor = gridcolor:darkgrey increment:100 start:0
ScaleMinor = gridcolor:lightgrey increment:100 start:0
BackgroundColors = canvas:sfondo

BarData=
  bar:1861 text:1861
  bar:1871 text:1871
  bar:1881 text:1881
  bar:1901 text:1901
  bar:1911 text:1911
  bar:1921 text:1921
  bar:1931 text:1931
  bar:1936 text:1936
  bar:1951 text:1951
  bar:1961 text:1961
  bar:1971 text:1971
  bar:1981 text:1981
  bar:1991 text:1991
  bar:2001 text:2001

PlotData=
  color:barra width:20 align:left

  bar:1861 from:0 till: 609.000
  bar:1871 from:0 till: 636.000
  bar:1881 from:0 till: 680.000
  bar:1901 from:0 till: 796.000
  bar:1911 from:0 till: 868.000
  bar:1921 from:0 till: 885.000
  bar:1931 from:0 till: 984.000
  bar:1936 from:0 till: 1034.000
  bar:1951 from:0 till: 1276.000
  bar:1961 from:0 till: 1419.000
  bar:1971 from:0 till: 1474.000
  bar:1981 from:0 till: 1594.000
  bar:1991 from:0 till: 1648.000
  bar:2001 from:0 till: 1632.000


TextData=
  fontsize:S pos:(20,20)
  text:Source istat - Elaboration graphique de Wikipedia
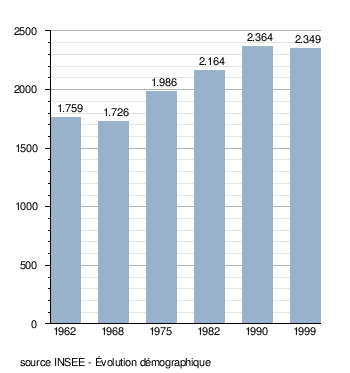
| Le Grand-Lemps | top next |
Initial version by Boly38 on Friday, June 9, 2006
Colors=
  id:lightgrey value:gray(0.9)
  id:darkgrey  value:gray(0.7)
  id:sfondo value:rgb(1,1,1)
  id:barra value:rgb(0.6,0.7,0.8)

ImageSize  = width:350 height:373
PlotArea   = left:50 bottom:50 top:30 right:30
DateFormat = x.y
Period     = from:0 till:2500
TimeAxis   = orientation:vertical
AlignBars  = justify
ScaleMajor = gridcolor:darkgrey increment:500 start:0
ScaleMinor = gridcolor:lightgrey increment:100 start:0
BackgroundColors = canvas:sfondo

BarData=
  bar:1962 text:1962
  bar:1968 text:1968
  bar:1975 text:1975
  bar:1982 text:1982
  bar:1990 text:1990
  bar:1999 text:1999

PlotData=
  color:barra width:30 align:left

  bar:1962 from:0 till: 1759
  bar:1968 from:0 till: 1726
  bar:1975 from:0 till: 1986
  bar:1982 from:0 till: 2164
  bar:1990 from:0 till: 2364
  bar:1999 from:0 till: 2349

PlotData=

  bar:1962 at: 1759 fontsize:S text: 1.759 shift:(-8,5)
  bar:1968 at: 1726 fontsize:S text: 1.726 shift:(-10,5)
  bar:1975 at: 1986 fontsize:S text: 1.986 shift:(-10,5)
  bar:1982 at: 2164 fontsize:S text: 2.164 shift:(-10,5)
  bar:1990 at: 2364 fontsize:S text: 2.364 shift:(-10,5)
  bar:1999 at: 2349 fontsize:S text: 2.349 shift:(-10,5)

TextData=
  fontsize:S pos:(20,20)
  text:source INSEE - Évolution démographique
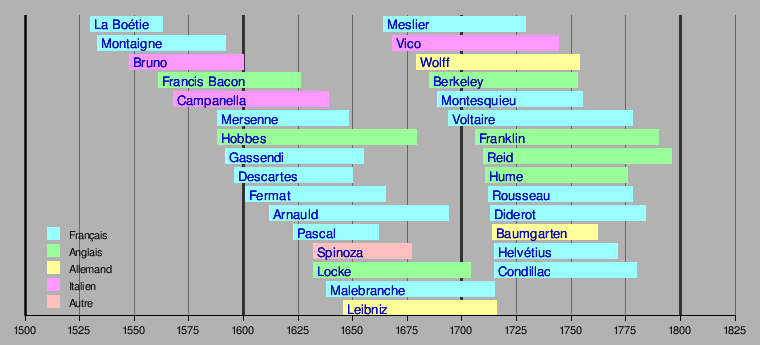
| Liste des philosophes par année de naissance | top next |
First version by Ouroboros ? on Friday, December 16, 2005, last update on Thursday, July 6, 2006
Preset    = TimeHorizontal_AutoPlaceBars_UnitYear
ImageSize = width:760

Colors =
  id:lightGray     value:gray(0.7)
  id:gray          value:gray(0.4)
  id:darkGray      value:gray(0.2)

  id:Fr      value:rgb(0.6,1,1)     legend:Français
  id:En      value:rgb(0.6,1,0.6)   legend:Anglais
  id:De      value:rgb(1,1,0.6)     legend:Allemand
  id:It      value:rgb(1,0.6,1)     legend:Italien
  id:Xx      value:rgb(1,0.75,0.75) legend:Autre

BackgroundColors = canvas:lightGray

Period     = from:1500 till:1825
ScaleMajor = unit:year increment:25 start:1500 gridcolor:gray
Legend     = orientation:vertical left:49 top:120

LineData =
  at:1500 color:darkGray layer:back
  at:1600 color:darkGray layer:back
  at:1700 color:darkGray layer:back
  at:1800 color:darkGray layer:back

BarData=
  barset:Philosophes

PlotData=

# set defaults
  width:15 fontsize:M textcolor:black align:left anchor:from shift:(4,-6)

  barset:Philosophes
  from:1530 till:1563 color:Fr text:[[Étienne de La Boétie|La Boétie]]
  from:1533 till:1592 color:Fr text:[[Michel de Montaigne|Montaigne]]
  from:1548 till:1600 color:It text:[[Giordano Bruno|Bruno]]
  from:1561 till:1626 color:En text:[[Francis Bacon (philosophe)|Francis Bacon]]
  from:1568 till:1639 color:It text:[[Campanella]]
  from:1588 till:1648 color:Fr text:[[Marin Mersenne|Mersenne]]
  from:1588 till:1679 color:En text:[[Thomas Hobbes|Hobbes]]
  from:1592 till:1655 color:Fr text:[[Pierre Gassendi|Gassendi]]
  from:1596 till:1650 color:Fr text:[[René Descartes|Descartes]]
  from:1601 till:1665 color:Fr text:[[Pierre de Fermat|Fermat]]
  from:1612 till:1694 color:Fr text:[[Antoine Arnauld|Arnauld]]
  from:1623 till:1662 color:Fr text:[[Blaise Pascal|Pascal]]
  from:1632 till:1677 color:Xx text:[[Baruch Spinoza|Spinoza]]
  from:1632 till:1704 color:En text:[[John Locke|Locke]]
  from:1638 till:1715 color:Fr text:[[Nicolas Malebranche|Malebranche]]
  from:1646 till:1716 color:De text:[[Gottfried Wilhelm Leibniz|Leibniz]]
  barset:break
  from:1664 till:1729 color:Fr text:[[Jean Meslier|Meslier]]
  from:1668 till:1744 color:It text:[[Giambattista Vico|Vico]]
  from:1679 till:1754 color:De text:[[Christian Wolff|Wolff]]
  from:1685 till:1753 color:En text:[[George Berkeley|Berkeley]]
  from:1689 till:1755 color:Fr text:[[Montesquieu (philosophe)|Montesquieu]]
  from:1694 till:1778 color:Fr text:[[Voltaire]]
  from:1706 till:1790 color:En text:[[Benjamin Franklin|Franklin]]
  from:1710 till:1796 color:En text:[[Thomas Reid|Reid]]
  from:1711 till:1776 color:En text:[[David Hume|Hume]]
  from:1712 till:1778 color:Fr text:[[Jean-Jacques Rousseau|Rousseau]]
  from:1713 till:1784 color:Fr text:[[Denis Diderot|Diderot]]
  from:1714 till:1762 color:De text:[[Alexander Gottlieb Baumgarten|Baumgarten]]
  from:1715 till:1771 color:Fr text:[[Helvétius]]
  from:1715 till:1780 color:Fr text:[[Condillac|Condillac]]
| Liste des philosophes par année de naissance | top next |

First version by Ouroboros ? on Friday, December 16, 2005, last update on Thursday, July 6, 2006
Preset    = TimeHorizontal_AutoPlaceBars_UnitYear
ImageSize = width:760

Colors =
  id:lightGray     value:gray(0.7)
  id:gray          value:gray(0.4)
  id:darkGray      value:gray(0.2)

  id:Fr      value:rgb(0.6,1,1)     legend:Français
  id:En      value:rgb(0.6,1,0.6)   legend:Anglais
  id:De      value:rgb(1,1,0.6)     legend:Allemand
  id:It      value:rgb(1,0.6,1)     legend:Italien
  id:Xx      value:rgb(1,0.75,0.75) legend:Autre

BackgroundColors = canvas:lightGray

Period     = from:1700 till:1900
ScaleMajor = unit:year increment:25 start:1700 gridcolor:gray
Legend     = orientation:vertical left:49 top:120

LineData =
  at:1700 color:darkGray layer:back
  at:1800 color:darkGray layer:back
  at:1900 color:darkGray layer:back

BarData=
  barset:Philosophes

PlotData=

# set defaults
  width:15 fontsize:M textcolor:black align:left anchor:from shift:(4,-6)

  barset:Philosophes
  from:1706 till:1790 color:En text:[[Benjamin Franklin|Franklin]]
  from:1710 till:1796 color:En text:[[Thomas Reid|Reid]]
  from:1711 till:1776 color:En text:[[David Hume|Hume]]
  from:1712 till:1778 color:Fr text:[[Jean-Jacques Rousseau|Rousseau]]
  from:1713 till:1784 color:Fr text:[[Denis Diderot|Diderot]]
  from:1714 till:1762 color:De text:[[Alexander Gottlieb Baumgarten|Baumgarten]]
  from:1715 till:1771 color:Fr text:[[Helvétius]]
  from:1715 till:1780 color:Fr text:[[Condillac|Condillac]]
  from:1717 till:1783 color:Fr text:[[D'Alembert]]
  from:1723 till:1789 color:Fr text:[[D'Holbach]]
  from:1723 till:1790 color:En text:[[Adam Smith|Smith]]
  from:1724 till:1804 color:De text:[[Immanuel Kant|Kant]]
  from:1729 till:1797 color:Xx text:[[Edmund Burke|Burke]]
  from:1735 till:1801 color:En text:[[John Millar|Millar]]
  from:1743 till:1794 color:Fr text:[[Jean-Antoine-Nicolas de Caritat|Condorcet]]
  from:1743 till:1826 color:En text:[[Thomas Jefferson|Jefferson]]
  from:1744 till:1803 color:De text:[[Johann Gottfried von Herder|Herder]]
  from:1748 till:1832 color:En text:[[Jeremy Bentham|Bentham]]
  from:1756 till:1836 color:En text:[[William Godwin|Godwin]]
  from:1767 till:1830 color:Fr text:[[Benjamin Constant|Constant]]
  from:1767 till:1830 color:Fr text:[[Jean-Baptiste Say|Say]]
  from:1767 till:1835 color:Fr text:[[Wilhelm von Humboldt|Humboldt]]
  from:1770 till:1831 color:De text:[[Georg Hegel|Hegel]]
  from:1773 till:1836 color:En text:[[James Mill|Mill]]
  from:1775 till:1855 color:De text:[[Friedrich Willhelm Joseph von Schelling|Schelling]]
  from:1782 till:1837 color:Fr text:[[Charles Comte|C. Comte]]
  from:1782 till:1854 color:Fr text:[[Félicité Robert de Lamennais|Lamennais]]
  from:1784 till:1842 color:Fr text:[[Jean François Moufot|Moufot]]
  from:1786 till:1862 color:Fr text:[[Charles Dunoyer|Dunoyer]]
  from:1788 till:1860 color:De text:[[Arthur Schopenhauer|Schopenhauer]]
  from:1792 till:1867 color:Fr text:[[Victor Cousin|Cousin]]
  from:1798 till:1857 color:Fr text:[[Auguste Comte|A. comte]]
| Liste des philosophes par année de naissance | top next |

First version by Ouroboros ? on Friday, December 16, 2005, last update on Thursday, July 6, 2006
Preset    = TimeHorizontal_AutoPlaceBars_UnitYear
ImageSize = width:760

Colors =
  id:lightGray     value:gray(0.7)
  id:gray          value:gray(0.4)
  id:darkGray      value:gray(0.2)

  id:Fr      value:rgb(0.6,1,1)     legend:Français
  id:En      value:rgb(0.6,1,0.6)   legend:Anglais
  id:De      value:rgb(1,1,0.6)     legend:Allemand
  id:It      value:rgb(1,0.6,1)     legend:Italien
  id:Xx      value:rgb(1,0.75,0.75) legend:Autre

BackgroundColors = canvas:lightGray

Period     = from:1800 till:2000
ScaleMajor = unit:year increment:25 start:1800 gridcolor:gray
Legend     = orientation:vertical left:49 top:120

LineData =

  at:1800 color:darkGray layer:back
  at:1900 color:darkGray layer:back
  at:2000 color:darkGray layer:back

BarData=
  barset:Philosophes

PlotData=

# set defaults
  width:15 fontsize:M textcolor:black align:left anchor:from shift:(4,-6)

  barset:Philosophes
  from:1801 till:1850 color:Fr text:[[Frédéric Bastiat|Bastiat]]
  from:1801 till:1877 color:Fr text:[[Antoine Cournot|Cournot]]
  from:1804 till:1872 color:De text:[[Ludwig Feuerbach|Feuerbach]]
  from:1805 till:1859 color:Fr text:[[Alexis de Tocqueville|Tocqueville]]
  from:1806 till:1856 color:De text:[[Max Stirner|Stirner]]
  from:1806 till:1873 color:En text:[[John Stuart Mill|Mill]]
  from:1806 till:1879 color:Fr text:[[Michel Chevalier|Chevalier]]
  from:1808 till:1887 color:En text:[[Lysander Spooner|Spooner]]
  from:1809 till:1865 color:Fr text:[[Pierre-Joseph Proudhon|Proudhon]]
  from:1813 till:1855 color:Xx text:[[Søren Kierkegaard|Kierkegaard]]
  from:1814 till:1862 color:Fr text:[[Jules Lequier|Lequier]]
  from:1819 till:1912 color:Xx text:[[Gustave de Molinari|Molinari]]
  from:1818 till:1883 color:De text:[[Karl Marx|Marx]]
  from:1820 till:1895 color:De text:[[Friedrich Engels|Engels]]
  from:1820 till:1903 color:En text:[[Herbert Spencer|Spencer]]
  from:1829 till:1878 color:Fr text:[[Maurice Joly|Joly]]
  from:1834 till:1902 color:En text:[[Emerich Edward Dalberg Acton|Lord Acton]]
  from:1835 till:1923 color:En text:[[Benjamin Tucker|Tucker]]
  from:1842 till:1910 color:En text:[[William James|James]]
  from:1843 till:1904 color:Fr text:[[Gabriel Tarde|Tarde]]
  from:1844 till:1900 color:De text:[[Friedrich Nietzsche|Nietzsche]]
  from:1848 till:1925 color:De text:[[Gottlob Frege|Frege]]
  from:1856 till:1939 color:De text:[[Sigmund Freud|Freud]]
  from:1857 till:1918 color:Xx text:[[Georgui Plekhanov|Plekhanov]]
  from:1859 till:1938 color:De text:[[Edmund Husserl|Husserl]]
  from:1859 till:1941 color:Fr text:[[Henri Bergson|Bergson]]
  from:1859 till:1952 color:En text:[[John Dewey|Dewey]]
  from:1861 till:1947 color:En text:[[Alfred North Whitehead|Whitehead]]
  from:1862 till:1925 color:Fr text:[[Georges Palante|Palante]]
  from:1864 till:1920 color:De text:[[Max Weber|Weber]]
  from:1864 till:1936 color:Xx text:[[Miguel de Unamuno|Unamuno]]
  from:1867 till:1956 color:Fr text:[[Julien Benda|Benda]]
  from:1868 till:1951 color:Fr text:[[Émile Chartier|Alain]]
  from:1872 till:1970 color:En text:[[Bertrand Russell|Russel]]
  from:1873 till:1958 color:En text:[[George Edward Moore|Moore]]
  from:1881 till:1973 color:De text:[[Ludwig von Mises|von Mises]]
  from:1883 till:1969 color:De text:[[Karl Jaspers|Jaspers]]
  from:1884 till:1962 color:Fr text:[[Gaston Bachelard|Bachelard]]
  from:1863 till:1952 color:Xx text:[[George Santayana|Santayana]]
  from:1881 till:1955 color:Fr text:[[Pierre Teilhard de Chardin|Chardin]]
  barset:break
  from:1882 till:1954 color:Fr text:[[René Le Senne|Le Senne]]
  from:1883 till:1951 color:Fr text:[[Louis Lavelle|Lavelle]]
  from:1889 till:1951 color:De text:[[Ludwig Wittgenstein|Wittgenstein]]
  from:1889 till:1973 color:Fr text:[[Gabriel Marcel|Marcel]]
  from:1889 till:1976 color:De text:[[Martin Heidegger|Heidegger]]
  from:1892 till:1940 color:En text:[[Walter Benjamin|Benjamin]]
  from:1894 till:1993 color:De text:[[Henry Hazlitt|Hazlitt]]
  from:1895 till:1973 color:De text:[[Max Horkheimer|Horkheimer]]
  from:1898 till:1983 color:En text:[[Leonard E. Read|Read]]
  from:1899 till:1959 color:De text:[[Alfred Schütz|Schütz]]
  from:1899 till:1973 color:En text:[[Leo Strauss|Strauss]]
  from:1899 till:1992 color:De text:[[Friedrich Hayek|Hayek]]
| Stoïcisme | top next |

Initial version by 83.195.117.92 on Saturday, June 3, 2006
DateFormat = yyyy
ImageSize  = width:1000 height:250
PlotArea   = left:15 right:10 bottom:20 top:0
Colors     =
  id:bleuclair         value:rgb(0.56,0.56,0.86)
  id:rouge             value:red
  id:rougeclair        value:rgb(0.86,0.56,0.56)
  id:bleu              value:rgb(0.76,0.76,0.96)
  id:grilleMinor       value:rgb(0.86,0.86,0.86)
  id:grilleMajor       value:rgb(0.56,0.56,0.56)
  id:protohistoire value:rgb(1,0.7,0.7)
  id:noir value:black
  id:canvas value:rgb(0.97,0.97,0.97)
  id:Holo value:rgb(0.4,0.8,0.7)
  id:PSup value:rgb(0.5,1,0.5)
  id:PMoy value:rgb(0.6,1,0.6)
  id:PInf value:rgb(0.7,1,0.7) # vert clair
  id:Plio value:rgb(0.8,1,0.8) # vert p�le
  id:gris value:gray(0.80)
  id:grilleMajor value:rgb(0.80,0.80,0.80)

  id:Timeperiod  value:red
  id:Timeperiod2 value:rgb(0.86,0.56,0.56)


Period     = from:-400 till:300
TimeAxis   = orientation:horizontal format:yyyy
AlignBars  = justify
ScaleMinor = unit:year increment:50  start:-400 gridcolor:grilleMinor
ScaleMajor = unit:year increment:50 start:-400 gridcolor:grilleMajor
BackgroundColors = canvas:canvas bars:canvas

BarData=
  bar:Timeperiod
  barset:auteurs

Define $marquerouge   = text:"*" textcolor:rouge   shift:(0,-3) fontsize:10

PlotData=
  width:15 fontsize:M textcolor:noir align:center

  # Époques
  bar:Timeperiod color:Timeperiod shift:(0,-3)
  from:start till:end color:gris # Arrière plan

  from:-400 till:300  text: "Les stoïciens" color:Timeperiod2

  # auteurs
  width:6 align:left fontsize:M shift:(5,-5) anchor:till
  barset:auteurs
  from:-335  till:-264 text:"[[Zénon de Citium]]" color:Pinf
  from:-330  till:-232 text:"[[Cléanthe]]" color:Pinf
  from:-281  till:-205 text:"[[Chrysippe]]" color:Pinf
  from:-240  till:-152 text:"[[Diogène de Babylone]]" color:Pinf
  from:-210  till:-129 text:"[[Antipater de Tarse]]" color:Pinf
  from:-180  till:-100 text:"[[Panaitius de Rhodes]]" color:Pinf
  from:-140  till:-51 text:"[[Posidonius d'Apamée]]" color:Pinf
  from:-106  till:-43 text:"[[Cicéron|Cicéron]]" color:Pinf
  from:3  till:65 text:"[[Sénèque le Jeune|Sénèque]]" color:Pinf
  from:55  till:135 text:"[[[Épictète]]]]" color:Pinf
  from:121  till:180 text:"[[Marc Aurèle]]" color:Pinf
| Julio-Claudiens | top next |

Initial version by Mandrak on Saturday, December 17, 2005
ImageSize  = width:1000 height:80
PlotArea   = width:980 height:60 left:10 bottom:20

Colors =
    id:yellow    value:rgb(0.7,0.7,1) # light yellow
    id:red       value:rgb(1,0.7,0.7) # light red
    id:green     value:rgb(0.7,1,0.7) # light green
    id:blue      value:rgb(1,1,0.7)   # light blue
    id:cyan      value:rgb(0.7,1,1)   # light blue
    id:purple    value:rgb(1,0.7,1)   # light purple
    id:grey      value:gray(0.8)      # grey

Period      = from:-30 till:70
TimeAxis    = orientation:horizontal
ScaleMajor  = unit:year increment:10 start:-30
ScaleMinor = unit:year increment:5 start:-25

LineData =
 width:1

 at:   0 color:blue tillpos:60

PlotData=
  align:center textcolor:black fontsize:8 mark:(line,black) shift:(0,-5)

  at:  0  shift:(0,40) color:blue width:25 text:"An O"

  from:    -27   till:  14  color:purple  text:[[Auguste]]
  from:    14   till:  37  color:yellow     text:[[Tibère]]
  from:    37   till:  41  color:green   text:[[Caligula]]
  from:    41   till:  54  color:blue   text:[[Claude]]
  from:    54   till:  68  color:cyan   text:[[Néron]]
| Flaviens | top next |

Initial version by Mandrak on Wednesday, December 21, 2005
ImageSize  = width:1000 height:80
PlotArea   = width:980 height:60 left:10 bottom:20

Colors =
    id:yellow    value:rgb(0.7,0.7,1) # light yellow
    id:red       value:rgb(1,0.7,0.7) # light red
    id:green     value:rgb(0.7,1,0.7) # light green
    id:blue      value:rgb(1,1,0.7)   # light blue
    id:cyan      value:rgb(0.7,1,1)   # light blue
    id:purple    value:rgb(1,0.7,1)   # light purple
    id:grey      value:gray(0.8)      # grey

Period      = from:65 till:100
TimeAxis    = orientation:horizontal
ScaleMajor  = unit:year increment:10 start:65
ScaleMinor = unit:year increment:5 start:70
PlotData=
  align:center textcolor:black fontsize:8 mark:(line,black) shift:(0,-5)

  from:    69   till:  79  color:purple  text:[[Vespasien]]
  from:    79   till:  81  color:yellow     text:[[Titus]]
  from:    81   till:  96  color:green   text:[[Domitien]]
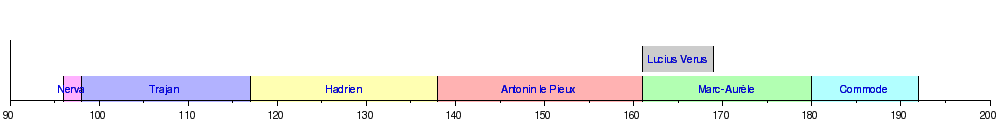
| Antonins (Rome) | top next |
First version by Mandrak on Thursday, December 22, 2005, last update on Monday, June 12, 2006
ImageSize  = width:1000 height:120
PlotArea   = width:980 height:60 left:10 bottom:20

Colors =
    id:yellow    value:rgb(0.7,0.7,1) # light yellow
    id:red       value:rgb(1,0.7,0.7) # light red
    id:green     value:rgb(0.7,1,0.7) # light green
    id:blue      value:rgb(1,1,0.7)   # light blue
    id:cyan      value:rgb(0.7,1,1)   # light blue
    id:purple    value:rgb(1,0.7,1)   # light purple
    id:grey      value:gray(0.8)      # grey

Period      = from:90 till:200
TimeAxis    = orientation:horizontal
ScaleMajor  = unit:year increment:10 start:90
ScaleMinor = unit:year increment:5 start:95

BarData=
  bar:barre1
  bar:barre2

PlotData=

  align:center textcolor:black fontsize:8 mark:(line,black) shift:(0,-5)

  bar:barre1
  from:    161  till:  169  color:grey     text:[[Lucius Verus]]

  bar:barre2
  from:    96   till:  98   color:purple   text:[[Nerva]]
  from:    98   till:  117  color:yellow   text:[[Trajan]]
  from:    117  till:  138  color:blue     text:[[Hadrien]]
  from:    138  till:  161  color:red      text:[[Antonin le Pieux]]
  from:    161  till:  180  color:green    text:[[Marc-Aurèle]]
  from:    180  till:  192  color:cyan     text:[[Commodus|Commode]]
| Histoire des consoles de jeu vidéo | top next |

First version by 84.101.175.202 ? on Saturday, May 13, 2006, last update on Wednesday, May 17, 2006
DateFormat=mm/dd/yyyy
ImageSize= width:600 height:400
Period = from:01/01/1975 till:12/31/2008
TimeAxis = orientation:horizontal
AlignBars = justify
PlotArea = width:90% height:90% left:0 bottom:30

Colors =
     id:console       value:rgb(0.9,0.3,0.3)
     id:consolealt    value:rgb(0.3,0.9,0.9)
     id:2ndgen        value:tan1
     id:8bit          value:coral
     id:16bit         value:skyblue
     id:32bit         value:drabgreen
     id:64bit         value:drabgreen
     id:6thgen        value:lightorange
     id:7thgen        value:lavender
     id:line          value:black
     id:liteline      value:rgb(0.3,0.3,0.3)
     id:bg            value:white
     id:projection    value:rgb(0.9,0.9,0.9)

PlotData=
     width:23 textcolor:black align:center


  bar:Atari from:01/01/1977      till:01/01/1986 color:2ndgen text:"[[Atari 2600]]"
  bar:Atari from:01/01/1993      till:06/30/1996 color:64bit text:"[[Atari Jaguar|Jaguar]]"
  bar:Atari2 from:01/01/1982 till:01/01/1984 color:2ndgen text:"[[Atari 5200]]"
  bar:Atari2 from:01/01/1986 till:01/01/1992 color:8bit text:"[[Atari 7800]]"
  bar:Nintendo1  from:01/01/1985 till:01/01/1995 color:8bit text:"[[NES]]"
  bar:Nintendo2 from:08/01/1982 till:03/01/1984 color:8bit text:"[[Colecovision]]"
  bar:NEC1 from:01/01/1978 till:01/01/1984 color:2ndgen text:"[[Magnavox Odyssey 2]]"
  bar:NEC1 from:08/01/1989  till:08/01/1992 color:16bit text: "[[PC-Engine]]"
  bar:NEC2 from:01/01/1980  till:01/01/1984 color:2ndgen text:"[[Intellivision]]"
  bar:NEC2 from:10/10/1992  till:01/01/1995 color:16bit text: "[[TurboDuo]]"
  bar:SEGA1 from:01/01/1986 till:01/01/1991 color:8bit text:"[[Sega Master System|Master System]]"
  bar:SEGA1  from:01/01/1995 till:01/01/1998 color:32bit text:"[[Sega Saturn|Saturn]]"
  bar:Sony2  from:10/26/2000 till:01/05/2005 color:6thgen text:"[[PlayStation 2|PS2]]"
  bar:Sony2  from:01/05/2005 till:12/31/2006 color:projection text:"(proj.)"
  bar:Nintendo1 from:03/01/1997 till:11/16/2001 color:64bit text:"[[Nintendo 64|N64]]"
  bar:Nintendo1  from:07/01/2006 till:12/31/2007 color:projection text:"[[Wii]]"
  bar:Nintendo2 from:04/01/1992 till:01/01/1999 color:16bit text:"[[Super NES]]"
  bar:Nintendo2  from:05/03/2002 till:05/01/2005 color:6thgen text:"[[Nintendo GameCube|GameCube]]" shift:(-20,0)
  bar:Nintendo2  from:05/01/2005 till:12/31/2006 color:projection text:"(proj.)"
  bar:SEGA2  from:11/30/1990 till:12/31/1995 color:16bit text:"[[Megadrive]]"
  bar:SEGA2  from:10/14/1999 till:01/01/2001 color:6thgen text:"[[Sega Dreamcast|Dreamcast]]"
  bar:Sony1  from:09/29/1995 till:01/01/2001 color:32bit text:"[[PlayStation]]"
  bar:Sony3  from:04/01/2006 till:12/31/2007 color:projection text:"[[PlayStation 3|PS3]] "
  bar:MS  from:04/26/2002 till:01/05/2005 color:6thgen text:"[[Xbox]]"
  bar:MS  from:01/05/2005 till:12/31/2006 color:projection text:"(proj.)"
  bar:MS2  from:11/10/2005 till:12/31/2007 color:projection text:"[[Xbox 360]]"
ScaleMajor = gridcolor:line unit:year increment:4 start:01/01/1976
ScaleMinor = gridcolor:liteline unit:year increment:2 start:01/01/1978
| Histoire des consoles de jeu vidéo | top next |

First version by 84.101.175.202 ? on Saturday, May 13, 2006, last update on Wednesday, May 17, 2006
DateFormat=mm/dd/yyyy
ImageSize= width:600 height:400
Period = from:01/01/1975 till:12/31/2008
TimeAxis = orientation:horizontal
AlignBars = justify
PlotArea = width:90% height:90% left:0 bottom:30

Colors =
     id:console       value:rgb(0.9,0.3,0.3)
     id:consolealt    value:rgb(0.3,0.9,0.9)
     id:2ndgen        value:tan1
     id:8bit          value:coral
     id:16bit         value:skyblue
     id:32bit         value:drabgreen
     id:64bit         value:drabgreen
     id:6thgen        value:lightorange
     id:7thgen        value:lavender
     id:line          value:black
     id:liteline      value:rgb(0.3,0.3,0.3)
     id:bg            value:white
     id:projection    value:rgb(0.9,0.9,0.9)

PlotData=
     width:23 textcolor:black align:center
  bar:Atari from:01/01/1977      till:01/01/1990 color:2ndgen text:"[[Atari 2600]]"
  bar:Atari from:01/01/1993      till:06/30/1996 color:64bit text:"[[Atari Jaguar|Jaguar]]"
  bar:Atari2 from:01/01/1982 till:01/01/1984 color:2ndgen text:"[[Atari 5200]]"
  bar:Atari2 from:01/01/1986 till:01/01/1992 color:8bit text:"[[Atari 7800]]"
  bar:Nintendo1  from:01/01/1985 till:01/01/1995 color:8bit text:"[[NES]]"
  bar:Nintendo2 from:08/01/1982 till:03/01/1984 color:8bit text:"[[Colecovision]]"
  bar:Nintendo2 from:08/01/1991 till:01/01/1999 color:16bit text:"[[Super NES]]"
  bar:NEC1 from:01/01/1978 till:01/01/1984 color:2ndgen text:"[[Magnavox Odyssey 2]]"
  bar:NEC1 from:08/01/1989  till:08/01/1992 color:16bit text: "[[TurboGrafx-16]]"
  bar:NEC2 from:01/01/1980  till:01/01/1984 color:2ndgen text:"[[Intellivision]]"
  bar:NEC2 from:10/10/1992  till:01/01/1995 color:16bit text: "[[TurboDuo]]"
  bar:Nintendo1 from:09/29/1996 till:08/01/2001 color:64bit text:"[[Nintendo 64|N64]]"
  bar:Nintendo2  from:10/18/2001 till:05/01/2006 color:6thgen text:"[[Nintendo GameCube|GameCube]]" shift:(-20,0)
  bar:Nintendo2  from:05/01/2005 till:12/31/2006 color:projection text:"(proj.)"
  bar:Nintendo1  from:03/22/2006 till:12/31/2007 color:projection text:"[[Wii]]"
  bar:SEGA1 from:01/01/1986 till:01/01/1992 color:8bit text:"[[Sega Master System|Master System]]"
  bar:SEGA2  from:01/09/1989 till:12/31/1995 color:16bit text:"[[Sega Genesis|Genesis]]"
  bar:SEGA1  from:05/01/1995 till:03/01/1998 color:32bit text:"[[Sega Saturn|Saturn]]"
  bar:SEGA2  from:09/09/1999 till:01/01/2001 color:6thgen text:"[[Sega Dreamcast|Dreamcast]]"
  bar:Sony1  from:09/09/1995 till:01/01/2001 color:32bit text:"[[PlayStation]]"
  bar:Sony2  from:10/26/2000 till:01/01/2006 color:6thgen text:"[[PlayStation 2|PS2]]"
  bar:Sony2  from:01/01/2006 till:07/01/2006 color:projection text:"(proj.)"
  bar:Sony3  from:04/01/2006 till:12/31/2007 color:projection text:"[[PlayStation 3|PS3]]"
  bar:MS  from:11/15/2001 till:01/01/2006 color:6thgen text:"[[Xbox]]"
  bar:MS  from:01/01/2005 till:03/01/2006 color:projection text:"(proj.)"
  bar:MS2  from:11/22/2005 till:12/31/2007 color:projection text:"[[Xbox 360]]"
ScaleMajor = gridcolor:line unit:year increment:4 start:01/01/1976
ScaleMinor = gridcolor:liteline unit:year increment:2 start:01/01/1978
| Histoire des consoles de jeu vidéo | top next |

First version by 84.101.175.202 ? on Saturday, May 13, 2006, last update on Wednesday, May 17, 2006
DateFormat=mm/dd/yyyy
ImageSize= width:600 height:400
Period = from:01/01/1975 till:12/31/2008
TimeAxis = orientation:horizontal
AlignBars = justify
PlotArea = width:90% height:90% left:0 bottom:30

Colors =
     id:console       value:rgb(0.9,0.3,0.3)
     id:consolealt    value:rgb(0.3,0.9,0.9)
     id:2ndgen        value:tan1
     id:8bit          value:coral
     id:16bit         value:skyblue
     id:32bit         value:drabgreen
     id:64bit         value:drabgreen
     id:6thgen        value:lightorange
     id:7thgen        value:lavender
     id:line          value:black
     id:liteline      value:rgb(0.3,0.3,0.3)
     id:bg            value:white
     id:projection    value:rgb(0.9,0.9,0.9)

PlotData=
     width:23 textcolor:black align:center
  bar:Nintendo1  from:07/15/1983 till:01/01/2003 color:8bit text:"[[NES|Famicom(NES)]]"
  bar:Nintendo2 from:11/21/1990 till:09/01/2003 color:16bit text:"[[Super NES|Super Famicom(Super NES)]]"
  bar:NEC1 from:10/30/1987  till:01/01/1999 color:16bit text: "[[PC Engine|PC Engine(TurboGrafx-16)]]"
  bar:NEC2 from:01/01/1994  till:01/01/1998 color:16bit text: "[[PC FX]]"
  bar:Nintendo3 from:07/01/1983 till:01/01/1985 color:2ndgen text: "[[SG-1000]]"
  bar:Nintendo3 from:06/23/1996 till:01/01/2002 color:64bit text:"[[Nintendo 64|N64]]"
  bar:Nintendo4  from:09/14/2001 till:05/01/2005 color:6thgen text:"[[Nintendo GameCube|GameCube]]" shift:(-20,0)
  bar:Nintendo4  from:05/01/2005 till:12/31/2006 color:projection text:"(proj.)"
  bar:Nintendo1  from:07/01/2006 till:12/31/2007 color:projection text:"[[Wii]]"
  bar:SEGA1 from:10/20/1985 till:02/04/1989 color:8bit text:"[[SG-1000_Mark_III|SG-1000_Mark_III(Master System)]]"
  bar:SEGA2  from:10/29/1988 till:12/31/1995 color:16bit text:"[[Sega Megadrive|Mega Drive (Genesis)]]"
  bar:SEGA1  from:11/22/1994 till:01/01/1999 color:32bit text:"[[Sega Saturn|Saturn]]"
  bar:SEGA2  from:11/27/1998 till:02/24/2004 color:6thgen text:"[[Sega Dreamcast|Dreamcast]]"
  bar:Sony1  from:12/03/1994 till:01/01/2002 color:32bit text:"[[PlayStation]]"
  bar:Sony2  from:03/04/2000 till:01/05/2005 color:6thgen text:"[[PlayStation 2|PS2]]"
  bar:Sony2  from:01/05/2005 till:12/31/2006 color:projection text:"(proj.)"
  bar:Sony3  from:04/01/2006 till:12/31/2007 color:projection text:"[[PlayStation 3|PS3]]"
  bar:MS  from:02/22/2002 till:01/05/2005 color:6thgen text:"[[Xbox]]"
  bar:MS  from:01/05/2005 till:12/31/2006 color:projection text:"(proj.)"
  bar:MS2  from:11/10/2005 till:12/31/2007 color:projection text:"[[Xbox 360]]"
ScaleMajor = gridcolor:line unit:year increment:4 start:01/01/1976
ScaleMinor = gridcolor:liteline unit:year increment:2 start:01/01/1978
| Lattes | top next |

First version by Sebjarod on Saturday, March 25, 2006, last update on Tuesday, July 11, 2006
ImageSize  = width:250 height:200
PlotArea   = left:40 right:10 top:10 bottom:20
TimeAxis   = orientation:horizontal
AlignBars  = justify
Colors =
  id:gray1 value:gray(0.9)

DateFormat = yyyy
Period     = from:1960 till:2010
ScaleMajor = unit:year increment:10 start:1960

PlotData =
  bar:18000 color:gray1 width:1
  from:start till:end
  bar:12000 color:gray1
  from:start till:end
  bar:6000 color:gray1
  from:start till:end
  bar:0 color:gray1


LineData =
  layer:front
  points:(48,34)(84,42) color:blue  width:2 #1962 tot 1968. Inwonertal 1962: 1488 1968: 2379
  points:(84,42)(100,57)    color:blue    width:2 #1975: 3963
  points:(100,57)(128,97)   color:blue    width:2 #1982: 8154
  points:(128,97)(160,116)   color:blue    width:2 #1990: 10203
  points:(160,116)(196,150)   color:blue    width:2 #1999: 13768
| Antony | top next |

First version by AntonyB on Wednesday, May 10, 2006, last update on Thursday, July 27, 2006
ImageSize  = width:250 height:100
PlotArea   = left:40 right:10 top:10 bottom:20
TimeAxis   = orientation:horizontal
AlignBars  = justify
Colors =
  id:gray1 value:gray(0.9)

DateFormat = yyyy
Period     = from:1960 till:2010
ScaleMajor = unit:year increment:10 start:1960

PlotData =
  bar:84000 color:gray1 width:1
  from:start till:end
  bar:56000 color:gray1
  from:start till:end
  bar:28000 color:gray1
  from:start till:end
  bar:0 color:gray1

LineData =
  layer:front
  points:(48,57)(84,67) color:blue  width:2 #1962 tot 1968. Inwonertal 1962: 46483 1968: 56638
  points:(84,67)(100,68)    color:blue    width:2 #1975: 57540
  points:(100,68)(128,65)   color:blue    width:2 #1982: 54610
  points:(128,65)(160,68)   color:blue    width:2 #1990: 57771
  points:(160,68)(196,71)   color:blue    width:2 #1999: 59855
  points:(196,71)(220,70)   color:blue    width:2 #2005: 59600
| Sarcelles | top next |

First version by Clicsouris on Sunday, July 9, 2006, last update on Saturday, July 15, 2006
Colors=
  id:lightgrey value:gray(0.9)
  id:darkgrey  value:gray(0.7)
  id:sfondo value:rgb(1,1,1)
  id:barra value:rgb(0.6,0.7,0.8)

ImageSize  = width:500 height:323
PlotArea   = left:50 bottom:50 top:30 right:30
DateFormat = x.y
Period     = from:0 till:60000
TimeAxis   = orientation:vertical
AlignBars  = justify
ScaleMajor = gridcolor:darkgrey increment:5000 start:0
ScaleMinor = gridcolor:lightgrey increment:1000 start:0
BackgroundColors = canvas:sfondo

BarData=
  bar:1921 text:1921
  bar:1936 text:1936
  bar:1954 text:1954
  bar:1962 text:1962
  bar:1968 text:1968
  bar:1975 text:1975
  bar:1982 text:1982
  bar:1990 text:1990
  bar:1999 text:1999

PlotData=
  color:barra width:30 align:left

  bar:1921 from:0 till: 3364
  bar:1936 from:0 till: 7083
  bar:1954 from:0 till: 8397
  bar:1962 from:0 till: 35800
  bar:1968 from:0 till: 51674
  bar:1975 from:0 till: 55007
  bar:1982 from:0 till: 53630
  bar:1990 from:0 till: 56833
  bar:1999 from:0 till: 57871

PlotData=

  bar:1921 at: 3364 fontsize:S text: 3.364 shift:(-8,5)
  bar:1936 at: 7083 fontsize:S text: 7.083 shift:(-10,5)
  bar:1954 at: 8397 fontsize:S text: 8.397 shift:(-10,5)
  bar:1962 at: 35800 fontsize:S text: 35.800 shift:(-10,5)
  bar:1968 at: 51674 fontsize:S text: 51.674 shift:(-10,5)
  bar:1975 at: 55007 fontsize:S text: 55.007 shift:(-10,5)
  bar:1982 at: 53630 fontsize:S text: 53.630 shift:(-10,5)
  bar:1990 at: 56833 fontsize:S text: 56.833 shift:(-10,5)
  bar:1999 at: 57871 fontsize:S text: 57.871 shift:(-10,5)

TextData=
  fontsize:S pos:(30,20)
  text:source INSEE
| Husseinites | top next |

Initial version by Moumou82 on Saturday, June 3, 2006
ImageSize  = width:180 height:575
PlotArea   = left:40 right:0 top:10 bottom:10

DateFormat = yyyy
Period     = from:1705 till:1957
TimeAxis   = orientation:vertical
ScaleMajor = unit:year increment:10 start:1705

PlotData=

  bar:BReg
  color:red
  width:25 mark:(line,white)
  align:left
  fontsize:7
  shift:(25,-4)

  from:1705  till:1735 color:red text:[[Hussein Ben Ali|Hussein I Bey]]
  from:1735  till:1756 color:red text:[[Ali I Bey]]
  from:1756  till:1759 color:red text:[[Rachid Bey]]
  from:1759  till:1777 color:red text:[[Ali II Bey]]
  from:1777  till:1814 color:red text:[[Hammouda Bey]]
  from:1814  till:1814 color:red text:[[Osman Bey]]
  from:1814  till:1824 color:red text:[[Mahmoud Bey]]
  from:1824  till:1835 color:red text:[[Hussein II Bey]]
  from:1835  till:1837 color:red text:[[Moustapha Bey]]
  from:1837  till:1855 color:red text:[[Ahmed I Bey]]
  from:1855  till:1859 color:red text:[[Mohammed Bey]]
  from:1859  till:1881 color:red text:[[Sadok Bey]]
  from:1881  till:1882 color:yellow
  from:1882  till:1902 color:yellow text:[[Ali III Bey]]
  from:1902  till:1906 color:yellow text:[[Hédi Bey]]
  from:1906  till:1922 color:yellow text:[[Naceur Bey]]
  from:1922  till:1929 color:yellow text:[[Habib Bey]]
  from:1929  till:1942 color:yellow text:[[Ahmed II Bey]]
  from:1942  till:1943 color:yellow text:[[Moncef Bey]]
  from:1943  till:1956 color:yellow text:[[Lamine Bey]]
  from:1956  till:end  color:red
| Garges-lès-Gonesse | top next |

Initial version by Clicsouris on Sunday, July 9, 2006
Colors=
  id:lightgrey value:gray(0.9)
  id:darkgrey  value:gray(0.7)
  id:sfondo value:rgb(1,1,1)
  id:barra value:rgb(0.6,0.7,0.8)

ImageSize  = width:400 height:373
PlotArea   = left:50 bottom:50 top:30 right:30
DateFormat = x.y
Period     = from:0 till:50000
TimeAxis   = orientation:vertical
AlignBars  = justify
ScaleMajor = gridcolor:darkgrey increment:5000 start:0
ScaleMinor = gridcolor:lightgrey increment:1000 start:0
BackgroundColors = canvas:sfondo

BarData=
  bar:1954 text:1954
  bar:1962 text:1962
  bar:1968 text:1968
  bar:1975 text:1975
  bar:1982 text:1982
  bar:1990 text:1990
  bar:1999 text:1999

PlotData=
  color:barra width:30 align:left

  bar:1954 from:0 till: 4814
  bar:1962 from:0 till: 10483
  bar:1968 from:0 till: 27312
  bar:1975 from:0 till: 37927
  bar:1982 from:0 till: 40182
  bar:1990 from:0 till: 42144
  bar:1999 from:0 till: 40058

PlotData=

  bar:1954 at: 4814 fontsize:S text: 4.814 shift:(-8,5)
  bar:1962 at: 10483 fontsize:S text: 10.483 shift:(-10,5)
  bar:1968 at: 27312 fontsize:S text: 27.312 shift:(-10,5)
  bar:1975 at: 37927 fontsize:S text: 37.927 shift:(-10,5)
  bar:1982 at: 40182 fontsize:S text: 40.182 shift:(-10,5)
  bar:1990 at: 42144 fontsize:S text: 42.144 shift:(-10,5)
  bar:1999 at: 40058 fontsize:S text: 40.058 shift:(-10,5)

TextData=
  fontsize:S pos:(30,20)
  text:source INSEE
| Francis Bacon | top next |

First version by Caton on Sunday, October 23, 2005, last update on Saturday, April 15, 2006
ImageSize  = width:450 height:450
PlotArea   = left:50 right:0 bottom:10 top:10

DateFormat = yyyy
Period     = from:1560 till:1630
TimeAxis   = orientation:vertical
ScaleMajor = unit:year increment:5 start:1560
ScaleMinor = unit:year increment:1 start:1560

PlotData=
  color:red mark:(line,black) align:left fontsize:S
  shift:(25,0) # shift text to right side of bar

  # there is no automatic collision detection,
  # so shift texts up or down manually to avoid overlap shift:(25,-10)

  at:1561             text:Naissance à [[Londres]]
  at:1573 fontsize:XS text:Entre au Trinity Coll. Cambridge; désaccord avec l'aristotélisme
  at:1579             text:Enters Gray's Inn
  from:1576 till:1579 text:En France
  at:1582             text:Called to Bar
  at:1584             text:Entre au parlement
  at:1591             text:Devient l'ami d'Essex
  at:1593             text:Essex presents him with estate
  at:1597             text:Première édition des Essays
  at:1601             text:Poursuit Essex en justice
  at:1605             text:Publication de Advancement of Learning
  at:1607             text:Solicitor General
  at:1609             text:Publication de Wisdom of the Ancients
  at:1613             text:Attorney General
  at:1616             text:Poursuit Somerset en justice
  at:1618 fontsize:XS text:Devient Garde des sceaux (Lord Keeper)
  at:1619 fontsize:XS text:Devient Chancelier (Lord Chancellor with title of Verulam)
  at:1620 fontsize:XS text:Publication du ''Novum Organum''
  at:1621 fontsize:XS text:Vicompte de St. Albans ; Accusé de corruption, se retire de la vie publique.
  at:1622 fontsize:XS text:Publie ''Henry VII'' et la troisième partie de ''Instauratio''
  at:1626             text:Mort
| Tessiture | top next |

First version by Nataraja on Thursday, October 14, 2004, last update on Monday, July 17, 2006
ImageSize  = width:770 height:auto barincrement:15
PlotArea   = left:0 right:0 top:0 bottom:5
AlignBars  = justify
Colors =
  id:a value:rgb(0.7,0.7,1) # light yellow
  id:b value:rgb(1,0.7,0.7) # light red
  id:c value:rgb(0.7,1,0.7) # light green
  id:f value:gray(0.8)      # background bar
  id:grid1   value:gray(0.7)
  id:grid2   value:gray(0.88)
BarData =
  bar:pitch
  bar:Hz
  barset:ranges
  bar:pitch2
  bar:Hz2

Period      = from:0 till:620
TimeAxis    = orientation:horizontal
ScaleMinor = increment:72 start:72 gridcolor:grid1
# ScaleMinor = unit:year increment:1 start:0 gridcolor:grid2


Define $cc2  = 2
Define $cc1  = 74
Define $cc   = 146
Define $c    = 218
Define $c1   = 290
Define $c2   = 362
Define $c3   = 434
Define $c4   = 506
Define $c5   = 578
Define $dd2  = 14
Define $dd1  = 86
Define $dd   = 158
Define $d    = 230
Define $d1   = 302
Define $d2   = 374
Define $d3   = 446
Define $d4   = 518
Define $d5   = 590
Define $ee2  = 26
Define $ee1  = 98
Define $ee   = 170
Define $e    = 242
Define $e1   = 314
Define $e2   = 386
Define $e3   = 458
Define $e4   = 530
Define $e5   = 602
Define $ff2  = 32
Define $ff1  = 104
Define $ff   = 176
Define $f    = 248
Define $f1   = 320
Define $f2   = 392
Define $f3   = 464
Define $f4   = 536
Define $f5   = 608
Define $gg2  = 44
Define $gg1  = 116
Define $gg   = 188
Define $g    = 260
Define $g1   = 332
Define $g2   = 404
Define $g3   = 476
Define $g4   = 548
Define $g5   = 620
Define $aa2  = 56
Define $aa1  = 128
Define $aa   = 200
Define $a    = 272
Define $a1   = 344
Define $a2   = 416
Define $a3   = 488
Define $a4   = 560
Define $a5   = 632
Define $hh2  = 68
Define $hh1  = 140
Define $hh   = 212
Define $h    = 284
Define $h1   = 356
Define $h2   = 428
Define $h3   = 500
Define $h4   = 572
Define $h5   = 644

Define $max  = 605
PlotData=
  align:center textcolor:black fontsize:8 mark:(line,black) width:12 shift:(0,-4)
  barset:ranges
  color:a from:0    till:$max text:[[Voix%20(instrument)|voix humaine]]
  color:b from:$cc  till:$f1  text:[[Basse%20(chant)|basse]]
  color:b from:$aa  till:$a1  text:[[baryton]]
  color:b from:$c   till:$d2  text:[[T%C3%A9nor|ténor]]
  color:b from:$f   till:$g2  text:[[Alto%20(voix)|contralto ou alto]]
  color:b from:$a   till:$c3  text:[[mezzo-soprano]]
  color:b from:$c1  till:$e3  text:[[soprano]]
  color:a from:0    till:$max text:[[instrument%20%C3%A0%20cordes|instruments à cordes]] # mettre des %20 à la place des espaces
  color:c from:0    till:$max text:Instruments à cordes frottées
  color:b from:$ee1 till:$a   text:[[contrebasse]]
  color:b from:$cc  till:$g2  text:[[violoncelle]]
  color:b from:$c   till:$e3  text:[[Alto%20(violon)|alto]]
  color:b from:$g   till:$c5  text:[[violon]]
  color:c from:0    till:$max text:Instruments à cordes pincées
  color:b from:$hh2 till:$f4  text:[[harpe]]
  color:b from:$ff1 till:$f3  text:[[clavecin]]
  color:b from:$ee  till:$a2  text:[[guitare]]
  color:b from:$g   till:$d4  text:[[mandoline]]
  color:c from:0    till:$max text:Instruments à cordes frappées
  color:b from:$ff2 till:$c5  text:[[grand piano]]
  color:b from:$aa2 till:$a4  text:[[piano]]
  color:b from:$aa2 till:$a4  text:[[cymbalum]]
  color:a from:0    till:$max text:[[instrument%20%C3%A0%20vent|instrument à vent]]
  color:c from:0    till:$max text:[[Les_bois%20(musique_classique)|bois]]
  color:b from:$aa2 till:$f   text:[[contrebasson]]
  color:b from:$gg1 till:$d1  text:[[saxophone basse]]
  color:b from:$aa1 till:$d2  text:[[basson]]
  color:b from:$cc  till:$g1  text:[[saxophone baryton]]
  color:b from:$dd  till:$f1  text:[[clarinette basse]]
  color:b from:$gg  till:$e2  text:[[Saxophone_t%C3%A9nor|saxophone ténor]]
  color:b from:$c   till:$a2  text:[[saxophone alto]]
  color:b from:$d   till:$g3  text:[[clarinette]]
  color:b from:$e   till:$h2  text:[[cor anglais]]
  color:b from:$g   till:$d3  text:[[saxophone soprano]]
  color:b from:$a   till:$f3  text:[[hautbois]]
  color:b from:$c1  till:$c4  text:[[fl%C3%BBte|flûte]] # û ou û ou %FB, le û ne veut rien savoir, flûte alors!
  color:b from:$c2  till:$c5  text:[[piccolo]]
  color:c from:0    till:$max text:[[Les cuivres%20(musique classique)|cuivres]] # mettre %20 devant l'accolade à la place de l'espace
  color:b from:$ee1 till:$d1  text:[[tuba]]
  color:b from:$ff1 till:$c1  text:[[saxhorn|saxhorn basse]]
  color:b from:$aa1 till:$d2  text:[[trombone]]
  color:b from:$aa1 till:$e2  text:[[cor]]
  color:b from:$e   till:$c3  text:[[trompette]]
  color:b from:$e   till:$c3  text:[[cornet]]
  color:c from:0    till:$max text:[[Instrument%20%C3%A0_vent_avec_clavier|instrument à vent avec clavier]] # finalement on n'a besoin que du %20 devant le à , mais çà ne marche que dans le lien
  color:b from:$cc2 till:$c5  text:[[orgue]]
  color:b from:$cc  till:$c4  text:[[harmonium]]
  color:b from:$gg  till:$a3  text:[[Accord%C3%A9on|accordéon]]
  color:a from:0    till:$max text:[[percussion]]
  color:c from:0    till:$max text:[[membranophone]]
  color:b from:$ff  till:$f   text:[[timbale|timbales]]
  color:c from:0    till:$max text:[[idiophone]]
  color:b from:$c   till:$f1  text:[[cloches tubulaires]]
  color:b from:$c1  till:$f3  text:[[vibraphone]]
  color:b from:$c1  till:$c5  text:[[celesta]]
  color:b from:$g2  till:$c5  text:[[glockenspiel]]
  color:b from:$g2  till:$c5  text:[[xylophone]]

  color:f textcolor:blue align:left fontsize:S mark:(line,white) shift:(3,-4)

  bar:pitch
  from:0 till:$max
  at:$cc2  text:do-1
  at:$cc1  text:do0
  at:$cc   text:do1
  at:$c    text:do2
  at:$c1   text:do3
  at:$a1   text:la3
  at:$c2   text:do4
  at:$c3   text:do5
  at:$c4   text:do6
  at:$c5   text:do7___ Note

  bar:Hz
  from:0 till:$max
  at:23    text:20
  at:65    text:30
  at:105   text:44
  at:153   text:70
  at:190   text:100
  at:232   text:150
  at:262   text:200
  at:304   text:300
  at:344   text:440
  at:392   text:700
  at:430   text:1000
  at:472   text:1500
  at:502   text:2000
  at:544   text:3000
  at:583   text:4400 Hz

  bar:pitch2 # exact copy of bar:pitch
  from:0 till:$max
  at:$cc2  text:do-1
  at:$cc1  text:do0
  at:$cc   text:do1
  at:$c    text:do2
  at:$c1   text:do3
  at:$a1   text:la3
  at:$c2   text:do4
  at:$c3   text:do5
  at:$c4   text:do6
  at:$c5   text:do7___ Note

  bar:Hz2 # exact copy of bar:Hz
  from:0 till:$max
  at:23    text:20
  at:65    text:30
  at:105   text:44
  at:153   text:70
  at:190   text:100
  at:232   text:150
  at:262   text:200
  at:304   text:300
  at:344   text:440
  at:392   text:700
  at:430   text:1000
  at:472   text:1500
  at:502   text:2000
  at:544   text:3000
  at:583   text:4400 Hz
| Villebon-sur-Yvette | top next |

First version by Kipmaster on Wednesday, June 21, 2006, last update on Tuesday, July 11, 2006
ImageSize  = width:250 height:200
PlotArea   = left:40 right:10 top:10 bottom:20
TimeAxis   = orientation:horizontal
AlignBars  = justify
Colors =
  id:gray1 value:gray(0.9)

DateFormat = yyyy
Period     = from:1960 till:2010
ScaleMajor = unit:year increment:10 start:1960

PlotData =
  bar:12000 color:gray1 width:1
  from:start till:end
  bar:8000 color:gray1
  from:start till:end
  bar:4000 color:gray1
  from:start till:end
  bar:0 color:gray1


LineData =
  layer:front
  points:(48,63)(84,90) color:blue  width:2 #1962 tot 1968. Inwonertal 1962: 3033 1968: 4949
  points:(84,90)(100,122)    color:blue    width:2 #1975: 7234
  points:(100,122)(128,129)   color:blue    width:2 #1982: 7728
  points:(128,129)(160,149)   color:blue    width:2 #1990: 9080
  points:(160,149)(196,153)   color:blue    width:2 #1999: 9373
| Nogent-sur-Marne | top next |

Initial version by Molui on Thursday, June 8, 2006
Colors=
  id:lightgrey value:gray(0.9)
  id:darkgrey  value:gray(0.7)
  id:sfondo value:rgb(1,1,1)
  id:barra value:rgb(0.6,0.7,0.8)

ImageSize  = width:350 height:373
PlotArea   = left:50 bottom:50 top:30 right:30
DateFormat = x.y
Period     = from:0 till:30000
TimeAxis   = orientation:vertical
AlignBars  = justify
ScaleMajor = gridcolor:darkgrey increment:5000 start:0
ScaleMinor = gridcolor:lightgrey increment:1000 start:0
BackgroundColors = canvas:sfondo

BarData=
  bar:1962 text:1962
  bar:1968 text:1968
  bar:1975 text:1975
  bar:1982 text:1982
  bar:1990 text:1990
  bar:1999 text:1999

PlotData=
  color:barra width:30 align:left

  bar:1962 from:0 till: 24501
  bar:1968 from:0 till: 26238
  bar:1975 from:0 till: 25634
  bar:1982 from:0 till: 24630
  bar:1990 from:0 till: 25248
  bar:1999 from:0 till: 28191

PlotData=

  bar:1962 at: 24501 fontsize:S text: 24.501 shift:(-8,5)
  bar:1968 at: 26238 fontsize:S text: 26.238 shift:(-10,5)
  bar:1975 at: 25634 fontsize:S text: 25.634 shift:(-10,5)
  bar:1982 at: 24630 fontsize:S text: 24.630 shift:(-10,5)
  bar:1990 at: 25248 fontsize:S text: 25.248 shift:(-10,5)
  bar:1999 at: 28191 fontsize:S text: 28.191 shift:(-10,5)

TextData=
  fontsize:S pos:(30,20)
  text:source INSEE - graphique pris sur le  wikipedia italien
| Montier-en-l'Isle | top next |

Initial version by NicoRay on Monday, June 12, 2006
ImageSize  = width:250 height:200
PlotArea   = left:40 right:10 top:10 bottom:20
TimeAxis   = orientation:horizontal
AlignBars  = justify
Colors =
  id:gray1 value:gray(0.9)

DateFormat = yyyy
Period     = from:1960 till:2010
ScaleMajor = unit:year increment:10 start:1960

PlotData =
  bar:330 color:gray1 width:1
  from:start till:end
  bar:220 color:gray1
  from:start till:end
  bar:110 color:gray1
  from:start till:end
  bar:0 color:gray1


LineData =
  layer:front
  points:(48,113)(84,125) color:blue  width:2 #1962 tot 1968. Inwonertal 1962: 181 1968: 204
  points:(84,125)(100,113)    color:blue    width:2 #1975: 180
  points:(100,113)(128,105)   color:blue    width:2 #1982: 165
  points:(128,105)(160,126)   color:blue    width:2 #1990: 206
  points:(160,126)(196,141)   color:blue    width:2 #1999: 235
  points:(196,141)(228,128)     color:blue    width:2 #2004/5
| Tour de France 2004 | top next |

Initial version by Denys on Saturday, July 16, 2005
ImageSize  = width:480 height:600
PlotArea   = left:25 right:0 bottom:20 top:10
DateFormat = yyyy
Period     = from:-1 till:20
TimeAxis   = orientation:vertical order:reverse
ScaleMajor = gridcolor:white unit:year increment:1 start:0

Colors =
  id:alggeel    value:rgb(1,1,0.4)
  id:bergrood   value:rgb(1,0.5,0.5)
  id:puntgroen  value:rgb(0.7,1,0.5)
  id:lichtgrijs value:rgb(0.95,0.95,0.95)

PlotData=

  bar:Leader color:alggeel width:110 mark:(line,black) align:center fontsize:S shift:(0,2)
  # shift texts up or down manually to avoid overlap
  from:-1  till:1  text:[[Fabian Cancellara]]
  from:1  till:2  text:[[Thor Hushovd]]
  from:2  till:3  text:[[Robbie McEwen]]
  from:3  till:4  text:[[Lance Armstrong]]
  from:4  till:14  text:[[Thomas Voeckler]]
  from:14  till:20 text:[[Lance Armstrong]]

  bar:Sprinteur color:puntgroen
  # shift texts up or down manually to avoid overlap
  from:-1  till:0  text:[[Fabian Cancellara]]
  from:0  till:2  text:[[Thor Hushovd]]
  from:2  till:5  text:[[Robbie McEwen]]
  from:5 till:7  text:[[Stuart O'Grady]]
  from:7  till:20  text:[[Robbie McEwen]]

  bar:Montagne color:bergrood
  # shift texts up or down manually to avoid overlap
  from:-1  till:0  text:Non attribué
  from:0  till:9  text:[[Paolo Bettini]]
  from:9  till:20  text:[[Richard Virenque]]

  bar:Jeune color:lichtgrijs
  # shift texts up or down manually to avoid overlap
  from:-1  till:3  text:[[Fabian Cancellara]]
  from:3  till:4  text:[[Matthias Kessler]]
  from:4  till:18  text:[[Thomas Voeckler]]
  from:18  till:20  text:[[Vladimir Karpets]]
| Pontoise | top next |
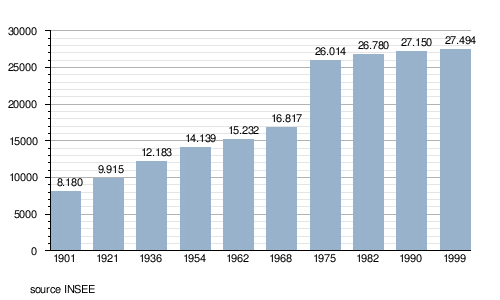
Initial version by Clicsouris on Monday, July 10, 2006
Colors=
  id:lightgrey value:gray(0.9)
  id:darkgrey  value:gray(0.7)
  id:sfondo value:rgb(1,1,1)
  id:barra value:rgb(0.6,0.7,0.8)

ImageSize  = width:500 height:300
PlotArea   = left:50 bottom:50 top:30 right:30
DateFormat = x.y
Period     = from:0 till:30000
TimeAxis   = orientation:vertical
AlignBars  = justify
ScaleMajor = gridcolor:darkgrey increment:5000 start:0
ScaleMinor = gridcolor:lightgrey increment:1000 start:0
BackgroundColors = canvas:sfondo

BarData=
  bar:1901 text:1901
  bar:1921 text:1921
  bar:1936 text:1936
  bar:1954 text:1954
  bar:1962 text:1962
  bar:1968 text:1968
  bar:1975 text:1975
  bar:1982 text:1982
  bar:1990 text:1990
  bar:1999 text:1999

PlotData=
  color:barra width:30 align:left

  bar:1901 from:0 till: 8180
  bar:1921 from:0 till: 9915
  bar:1936 from:0 till: 12183
  bar:1954 from:0 till: 14139
  bar:1962 from:0 till: 15232
  bar:1968 from:0 till: 16817
  bar:1975 from:0 till: 26014
  bar:1982 from:0 till: 26780
  bar:1990 from:0 till: 27150
  bar:1999 from:0 till: 27494

PlotData=

  bar:1901 at: 8180 fontsize:S text: 8.180 shift:(-8,5)
  bar:1921 at: 9915 fontsize:S text: 9.915 shift:(-10,5)
  bar:1936 at: 12183 fontsize:S text: 12.183 shift:(-10,5)
  bar:1954 at: 14139 fontsize:S text: 14.139 shift:(-10,5)
  bar:1962 at: 15232 fontsize:S text: 15.232 shift:(-10,5)
  bar:1968 at: 16817 fontsize:S text: 16.817 shift:(-10,5)
  bar:1975 at: 26014 fontsize:S text: 26.014 shift:(-10,5)
  bar:1982 at: 26780 fontsize:S text: 26.780 shift:(-10,5)
  bar:1990 at: 27150 fontsize:S text: 27.150 shift:(-10,5)
  bar:1999 at: 27494 fontsize:S text: 27.494 shift:(-10,5)

TextData=
  fontsize:S pos:(30,20)
  text:source INSEE
| Aoste | top next |

Initial version by Flayas on Thursday, April 13, 2006
Colors=
  id:lightgrey value:gray(0.9)
  id:darkgrey  value:gray(0.7)
  id:sfondo value:rgb(1,1,1)
  id:barra value:rgb(0.6,0.7,0.8)

ImageSize  = width:455 height:373
PlotArea   = left:50 bottom:50 top:30 right:30
DateFormat = x.y
Period     = from:0 till:40000
TimeAxis   = orientation:vertical
AlignBars  = justify
ScaleMajor = gridcolor:darkgrey increment:5000 start:0
ScaleMinor = gridcolor:lightgrey increment:1000 start:0
BackgroundColors = canvas:sfondo

BarData=
  bar:1861 text:1861
  bar:1871 text:1871
  bar:1881 text:1881
  bar:1901 text:1901
  bar:1911 text:1911
  bar:1921 text:1921
  bar:1931 text:1931
  bar:1936 text:1936
  bar:1951 text:1951
  bar:1961 text:1961
  bar:1971 text:1971
  bar:1981 text:1981
  bar:1991 text:1991
  bar:2001 text:2001

PlotData=
  color:barra width:20 align:left

  bar:1861 from:0 till: 8231
  bar:1871 from:0 till: 7749
  bar:1881 from:0 till: 7376
  bar:1901 from:0 till: 7554
  bar:1911 from:0 till: 7008
  bar:1921 from:0 till: 9554
  bar:1931 from:0 till: 13962
  bar:1936 from:0 till: 16130
  bar:1951 from:0 till: 24215
  bar:1961 from:0 till: 30633
  bar:1971 from:0 till: 36906
  bar:1981 from:0 till: 37194
  bar:1991 from:0 till: 36214
  bar:2001 from:0 till: 34062

PlotData=

  bar:1861 at: 8231 fontsize:S text: 8.231 shift:(-8,5)
  bar:1871 at: 7749 fontsize:S text: 7.749 shift:(-10,5)
  bar:1881 at: 7376 fontsize:S text: 7.376 shift:(-10,5)
  bar:1901 at: 7554 fontsize:S text: 7.554 shift:(-10,5)
  bar:1911 at: 7008 fontsize:S text: 7.008 shift:(-10,5)
  bar:1921 at: 9554 fontsize:S text: 9.554 shift:(-10,5)
  bar:1931 at: 13962 fontsize:S text: 13.962 shift:(-10,5)
  bar:1936 at: 16130 fontsize:S text: 16.130 shift:(-10,5)
  bar:1951 at: 24215 fontsize:S text: 24.215 shift:(-10,5)
  bar:1961 at: 30633 fontsize:S text: 30.633 shift:(-10,5)
  bar:1971 at: 36906 fontsize:S text: 36.906 shift:(-10,5)
  bar:1981 at: 37194 fontsize:S text: 37.194 shift:(-10,5)
  bar:1991 at: 36214 fontsize:S text: 36.214 shift:(-10,5)
  bar:2001 at: 34062 fontsize:S text: 34.062 shift:(-10,5)

TextData=
  fontsize:S pos:(20,20)
  text:Source ISTAT - d'après it.wikipedia
| Template:Chronologie des présidents des États-Unis d'Amérique | top next |

First version by Howard Drake on Saturday, July 10, 2004, last update on Sunday, July 17, 2005
ImageSize  = width:450 height:720
PlotArea   = left:0 right:0 bottom:60 top:10
Legend     = columns:3 left:60 top:40 columnwidth:147
AlignBars  = justify

DateFormat = yyyy
Period     = from:1789 till:2009
TimeAxis   = orientation:vertical

Colors=
  id:canvas value:gray(0.5)
  id:Dem  value:blue             legend:Démocrate
  id:Rep  value:red              legend:Républicain
  id:Fed  value:rgb(0.9,0.9,0.6) legend:Fédéraliste
  id:DR   value:green            legend:Démocrate-Républicain
  id:Wh   value:yellow           legend:Whig
  id:np   value:gray(0.8)        legend:Indépendant
  id:War  value:gray(0.6)

Define $left  = align:right shift:(-25,-5)
Define $right = align:left  shift:(25,-5)

PlotData=
  mark:(line,white) fontsize:S shift:(25,-5)

  width:33  shift:(-25,-5) align:right color:War fontsize:S textcolor:war

  from:1861  till:1865 text:"Guerre de Sécession"
  from:1914  till:1918 text:Première Guerre mondiale
  from:1939  till:1945 text:"Seconde Guerre mondiale"

  width:25 fontsize:S textcolor:black
  from:start till:1797 color:np   $left  text:"[[George Washington]]_1789-1797"
  from:1797  till:1801 color:Fed  $right text:"1797-1801_[[John Adams]]"
  from:1801  till:1809 color:DR   $left  text:"[[Thomas Jefferson]]_1801-1809"
  from:1809  till:1817 color:DR   $right text:"1809-1817_[[James Madison]]"
  from:1817  till:1825 color:DR   $left  text:"[[James Monroe]]_1817-1825"
  from:1825  till:1829 color:DR   $right text:"1825-1829_[[John Quincy Adams]]"
  from:1829  till:1837 color:Dem  $left  text:"[[Andrew Jackson]]_1829-1837"
  from:1837  till:1841 color:Dem  $right text:"1837-1841_[[Martin Van Buren]]"
  from:1841  till:1841 color:Wh   $left  text:"[[William H. Harrison]]_1841-1841"
  from:1841  till:1845 color:Wh   $right text:"1841-1845_[[John Tyler]]"
  from:1845  till:1849 color:Dem  $left  text:"[[James K. Polk]]_1845-1849"
  from:1849  till:1850 color:Wh   $right text:"1849-1850_[[Zachary Taylor]]"
  from:1850  till:1853 color:Wh   $left  text:"[[Millard Fillmore]]_1850-1853"
  from:1853  till:1857 color:Dem  $right text:"1853-1857_[[Franklin Pierce]]"
  from:1857  till:1861 color:Dem  $left  text:"[[James Buchanan]]_1857-1861"
  from:1861  till:1865 color:Rep  $right text:"1861-1865_[[Abraham Lincoln]]"
  from:1865  till:1869 color:Rep  $left  text:"[[Andrew Johnson]]_1865-1869"
  from:1869  till:1877 color:Rep  $right text:"1869-1877_[[Ulysses S. Grant]]"
  from:1877  till:1881 color:Rep  $left  text:"[[Rutherford B. Hayes]]_1877-1881"
  from:1881  till:1881 color:Rep  $right text:"1881-1881_[[James A. Garfield]]"
  from:1881  till:1885 color:Rep  $left  text:"[[Chester A. Arthur]]_1881-1885"
  from:1885  till:1889 color:Dem  $right text:"1885-1889_[[Grover Cleveland]]"
  from:1889  till:1893 color:Rep  $left  text:"[[Benjamin Harrison]]_1889-1893"
  from:1893  till:1897 color:Dem  $right text:"1893-1897_[[Grover Cleveland]]"
  from:1897  till:1901 color:Rep  $left  text:"[[William McKinley]]_1897-1901"
  from:1901  till:1909 color:Rep  $right text:"1901-1909_[[Theodore Roosevelt]]"
  from:1909  till:1913 color:Rep  $left  text:"[[William H. Taft]]_1909-1913"
  from:1913  till:1921 color:Dem  $right text:"1913-1921_[[Woodrow Wilson]]"
  from:1921  till:1923 color:Rep  $left  text:"[[Warren G. Harding]]_1921-1923"
  from:1923  till:1929 color:Rep  $right text:"1923-1929_[[Calvin Coolidge]]"
  from:1929  till:1933 color:Rep  $left  text:"[[Herbert Hoover]]_1929-1933"
  from:1933  till:1945 color:Dem  $right text:"1933-1945_[[Franklin D. Roosevelt]]"
  from:1945  till:1953 color:Dem  $left  text:"[[Harry Truman]]_1945-1953"
  from:1953  till:1961 color:Rep  $right text:"1953-1961_[[Dwight D. Eisenhower]]"
  from:1961  till:1963 color:Dem  $left  text:"[[John F. Kennedy]]_1961-1963"
  from:1963  till:1969 color:Dem  $right text:"1963-1969_[[Lyndon B. Johnson]]"
  from:1969  till:1974 color:Rep  $left  text:"[[Richard Nixon]]_1969-1974"
  from:1974  till:1977 color:Rep  $right text:"1974-1977_[[Gerald Ford]]"
  from:1977  till:1981 color:Dem  $left  text:"[[Jimmy Carter]]_1977-1981"
  from:1981  till:1989 color:Rep  $right text:"1981-1989_[[Ronald Reagan]]"
  from:1989  till:1993 color:Rep  $left  text:"[[George Bush]]_1989-1993"
  from:1993  till:2001 color:Dem  $right text:"1993-2001_[[Bill Clinton]]"
  from:2001  till:end  color:Rep  $left  text:"[[George W. Bush]]_2001-2009"
| Template:Chronologie des vainqueurs du Tour de France cycliste | top next |

First version by Greudin on Thursday, July 22, 2004, last update on Tuesday, March 28, 2006
Preset     = TimeVertical_OneBar_UnitYear
ImageSize  = width:272 height:1380
PlotArea   = bottom:220 left:40
Period     = from:1903 till:2006
ScaleMajor = start:1905 increment:5
ScaleMinor = start:1903 increment:1
Colors =
  id:canvas      value:gray(0.9)
  id:linemark    value:gray(0.7)
  id:linemark2   value:gray(0.9)
  id:France      value:rgb(0,0,1)     legend:France_(36)
  id:Belgium     value:rgb(1,0,1)     legend:Belgique_(18)
  id:USA         value:rgb(1,1,0)     legend:États-Unis_(10)
  id:Italy       value:rgb(0,0.9,0)   legend:Italie_(9)
  id:Spain       value:rgb(1,0,0)     legend:Espagne_(8)
  id:Luxembourg  value:rgb(0,0.8,0.8) legend:Luxembourg_(4)
  id:Netherlands value:rgb(0.7,0.3,0) legend:Pays-Bas_(2)
  id:Switzerland value:rgb(0,0,0.6)   legend:Suisse_(2)
  id:Denmark     value:rgb(0.6,0.6,0) legend:Danemark_(1)
  id:Germany     value:rgb(0,0.6,0)   legend:Allemagne_(1)
  id:Ireland     value:rgb(0.6,0,0)   legend:Irlande_(1)
BackgroundColors = canvas:canvas
Legend = orientation:vertical columns:1 top:200 left: 45
PlotData =
  shift:(20,2)
  mark:(line,linemark)
  anchor:from
  from:1903 till:1904 text:" 1r Tour : [[Maurice Garin]]"         color:France
  from:1904 till:1905 text:" 2e Tour : [[Henri Cornet]]"          color:France
  from:1905 till:1906 text:" 3e Tour : [[Louis Trousselier]]"     color:France
  from:1906 till:1907 text:" 4e Tour : [[René Polthier]]"         color:France
  from:1907 till:1908 text:" 5e Tour : [[Lucien Petit-Breton]] 1" color:France
  from:1908 till:1909 text:" 6e Tour : Lucien Petit-Breton 2"     color:France
  from:1909 till:1910 text:" 7e Tour : [[François Faber]]"        color:Luxembourg
  from:1910 till:1911 text:" 8e Tour : [[Octave Lapize]]"         color:France
  from:1911 till:1912 text:" 9e Tour : [[Gustave Garrigou]]"      color:France
  from:1912 till:1913 text:"10e Tour : [[Odile Defraye]]"         color:Belgium
  from:1913 till:1914 text:"11e Tour : [[Philippe Thys]] 1"       color:Belgium
  from:1914 till:1915 text:"12e Tour : Philippe Thys 2"           color:Belgium
  from:1919 till:1920 text:"13e Tour : [[Firmin Lambot]] 1"       color:Belgium
  from:1920 till:1921 text:"14e Tour : Philippe Thys 3"           color:Belgium
  from:1921 till:1922 text:"15e Tour : [[Léon Scieur]]"           color:Belgium
  from:1922 till:1923 text:"16e Tour : Firmin Lambot 2"           color:Belgium
  from:1923 till:1924 text:"17e Tour : [[Henri Pélissier]]"       color:France
  from:1924 till:1925 text:"18e Tour : [[Ottavio Bottecchia]] 1"  color:Italy
  from:1925 till:1926 text:"19e Tour : Ottavio Bottecchia 2"      color:Italy       mark:(line,linemark2)
  from:1926 till:1927 text:"20e Tour : [[Lucien Buysse]]"         color:Belgium
  from:1927 till:1928 text:"21e Tour : [[Nicolas Frantz]] 1"      color:Luxembourg
  from:1928 till:1929 text:"22e Tour : Nicolas Frantz 2"          color:Luxembourg
  from:1929 till:1930 text:"23e Tour : [[Maurice de Waele]]"      color:Belgium
  from:1930 till:1931 text:"24e Tour : [[André Leducq]] 1"        color:France
  from:1931 till:1932 text:"25e Tour : [[Antonin Magne]] 1"       color:France
  from:1932 till:1933 text:"26e Tour : André Leducq 2"            color:France
  from:1933 till:1934 text:"27e Tour : [[Georges Speicher]]"      color:France
  from:1934 till:1935 text:"28e Tour : Antonin Magne 2"           color:France
  from:1935 till:1936 text:"29e Tour : [[Romain Maes]]"           color:Belgium
  from:1936 till:1937 text:"30e Tour : [[Sylvère Maes]] 1"        color:Belgium
  from:1937 till:1938 text:"31e Tour : [[Roger Lapébie]]"         color:France
  from:1938 till:1939 text:"32e Tour : [[Gino Bartali]]"          color:Italy
  from:1939 till:1940 text:"33e Tour : Sylvère Maes 2"            color:Belgium
  from:1947 till:1948 text:"34e Tour : [[Jean Robic]]"            color:France
  from:1948 till:1949 text:"35e Tour : Gino Bartali 2"            color:Italy
  from:1949 till:1950 text:"36e Tour : [[Fausto Coppi]] 1"        color:Italy       mark:(line,linemark2)
  from:1950 till:1951 text:"37e Tour : [[Ferdinand Kubler]]"      color:Switzerland
  from:1951 till:1952 text:"38e Tour : [[Hugo Koblet]]"           color:Switzerland
  from:1952 till:1953 text:"39e Tour : Fausto Coppi 2"            color:Italy
  from:1953 till:1954 text:"40e Tour : [[Louison Bobet]] 1"       color:France
  from:1954 till:1955 text:"41e Tour : Louison Bobet 2"           color:France
  from:1955 till:1956 text:"42e Tour : Louison Bobet 3"           color:France
  from:1956 till:1957 text:"43e Tour : [[Roger Walkowiak]]"       color:France
  from:1957 till:1958 text:"44e Tour : [[Jacques Anquetil]] 1"    color:France
  from:1958 till:1959 text:"45e Tour : [[Charly Gaul]]"           color:Luxembourg
  from:1959 till:1960 text:"46e Tour : [[Federico Bahamontes]]"   color:Spain
  from:1960 till:1961 text:"47e Tour : [[Gastone Nencini]]"       color:Italy
  from:1961 till:1962 text:"48e Tour : Jacques Anquetil 2"        color:France
  from:1962 till:1963 text:"49e Tour : Jacques Anquetil 3"        color:France
  from:1963 till:1964 text:"50e Tour : Jacques Anquetil 4"        color:France
  from:1964 till:1965 text:"51e Tour : Jacques Anquetil 5"        color:France
  from:1965 till:1966 text:"52e Tour : [[Felice Gimondi]]"        color:Italy
  from:1966 till:1967 text:"53e Tour : [[Lucien Aimar]]"          color:France
  from:1967 till:1968 text:"54e Tour : [[Roger Pingeon]]"         color:France
  from:1968 till:1969 text:"55e Tour : [[Jan Janssen]]"           color:Netherlands
  from:1969 till:1970 text:"56e Tour : [[Eddy Merckx]] 1"         color:Belgium
  from:1970 till:1971 text:"57e Tour : Eddy Merckx 2"             color:Belgium
  from:1971 till:1972 text:"58e Tour : Eddy Merckx 3"             color:Belgium
  from:1972 till:1973 text:"59e Tour : Eddy Merckx 4"             color:Belgium
  from:1973 till:1974 text:"60e Tour : [[Luis Ocaña]]"            color:Spain
  from:1974 till:1975 text:"61e Tour : Eddy Merckx 5"             color:Belgium     mark:(line,linemark2)
  from:1975 till:1976 text:"62e Tour : [[Bernard Thévenet]] 1"    color:France
  from:1976 till:1977 text:"63e Tour : [[Lucien Van Impe]]"       color:Belgium
  from:1977 till:1978 text:"64e Tour : Bernard Thévenet 2"        color:France
  from:1978 till:1979 text:"65e Tour : [[Bernard Hinault]] 1"     color:France
  from:1979 till:1980 text:"66e Tour : Bernard Hinault 2"         color:France
  from:1980 till:1981 text:"67e Tour : [[Joop Zoetemelk]]"        color:Netherlands
  from:1981 till:1982 text:"68e Tour : Bernard Hinault 3"         color:France
  from:1982 till:1983 text:"69e Tour : Bernard Hinault 4"         color:France
  from:1983 till:1984 text:"70e Tour : [[Laurent Fignon]] 1"      color:France
  from:1984 till:1985 text:"71e Tour : Laurent Fignon 2"          color:France
  from:1985 till:1986 text:"72e Tour : Bernard Hinault 5"         color:France
  from:1986 till:1987 text:"73e Tour : [[Greg LeMond]] 1"         color:USA
  from:1987 till:1988 text:"74e Tour : [[Stephen Roche]]"         color:Ireland
  from:1988 till:1989 text:"75e Tour : [[Pedro Delgado]]"         color:Spain
  from:1989 till:1990 text:"76e Tour : Greg LeMond 2"             color:USA
  from:1990 till:1991 text:"77e Tour : Greg LeMond 3"             color:USA
  from:1991 till:1992 text:"78e Tour : [[Miguel Indurain]] 1"     color:Spain
  from:1992 till:1993 text:"79e Tour : Miguel Indurain 2"         color:Spain
  from:1993 till:1994 text:"80e Tour : Miguel Indurain 3"         color:Spain
  from:1994 till:1995 text:"81e Tour : Miguel Indurain 4"         color:Spain
  from:1995 till:1996 text:"82e Tour : Miguel Indurain 5"         color:Spain
  from:1996 till:1997 text:"83e Tour : [[Bjarne Riis]]"           color:Denmark
  from:1997 till:1998 text:"84e Tour : [[Jan Ullrich]]"           color:Germany
  from:1998 till:1999 text:"85e Tour : [[Marco Pantani]]"         color:Italy
  from:1999 till:2000 text:"86e Tour : [[Lance Armstrong]] 1"     color:USA         mark:(line,linemark2)
  from:2000 till:2001 text:"87e Tour : Lance Armstrong 2"         color:USA
  from:2001 till:2002 text:"88e Tour : Lance Armstrong 3"         color:USA
  from:2002 till:2003 text:"89e Tour : Lance Armstrong 4"         color:USA
  from:2003 till:2004 text:"90e Tour : Lance Armstrong 5"         color:USA
  from:2004 till:2005 text:"91e Tour : Lance Armstrong 6"         color:USA
  from:2005 till:2006 text:"92e Tour : Lance Armstrong 7"         color:USA
| Template:Tableau Histoire Suisse | top next |

First version by Jyp on Friday, August 6, 2004, last update on Wednesday, May 24, 2006
DateFormat = yyyy
ImageSize  = width:750 height:auto barincrement:37
PlotArea   = left:20 right:45 bottom:30 top:15

Colors     =
  id:canvas      value:rgb(0.97,0.97,0.97)
  id:grid1       value:rgb(0.80,0.80,0.80)
  id:grid2       value:rgb(0.86,0.86,0.86)
  id:Timeperiod  value:red
  id:Timeperiod2 value:rgb(0.86,0.56,0.56)
  id:grau        value:gray(0.7)

Period     = from:1250 till:2150
TimeAxis   = orientation:horizontal format:yyyy
ScaleMajor = unit:year  increment:100 start:1300 gridcolor:grid1
ScaleMinor = unit:year  increment:50  start:1250 gridcolor:grid2
AlignBars  = justify

BackgroundColors = canvas:canvas bars:canvas

BarData=
  bar:Timeperiod
  barset:Timeperiod2

PlotData=
  width:25 fontsize:S textcolor:black align:center

  bar:Timeperiod color:Timeperiod shift:(0,-3)
  from:start till:end color:grau # Hintergrund
  from:1291 till:1332 text: "III"
  from:1353 till:1481 text: "[[Confédération des VIII cantons|VIII cantons]]" color:Timeperiod2
  from:1513 till:1798 text: "[[Confédération des XIII cantons|XIII cantons]]"
  from:1798 till:1803 text: " " color:Timeperiod2
  from:1803 till:1814 text: " "
  from:1814 till:1848 text: "XXII" color:Timeperiod2
  from:1848 till:2006  text: "État fédéral"

  width:25 fontsize:S textcolor:black anchor:from align:left color:grau
  barset:Timeperiod2
  from:1291 till:1291 text:"1291 [[Serment du Grutli]], Fondation~de la Confédération" shift:(2,0)
  from:1315 till:1315 text:"1315 [[Bataille de Morgarten]]"
  from:1332 till:1353 text: "1332-1353 Admission de [[Zurich (canton)|Zurich]]~[[Glaris]], [[Lucerne (canton)|Lucerne]], [[Berne (canton)|Berne]] et [[Zoug (canton)|Zoug]]" shift:(21,0)
  from:1386 till:1386 text:"1386 [[Bataille de Sempach]]"
  from:1449 till:1450 text: "1449-50 [[Ancienne guerre de Zurich]]" shift:(4,0)
  from:1474 till:1478 text: "1474-78 [[Guerres de Bourgogne]]" shift:(7,0)
  from:1481 till:1513 text: "1481-1513 Admission de [[Fribourg (canton)|Fribourg]], [[Soleure (canton)|Soleure]]~[[Bâle (canton)|Bâle]], [[Appenzell (canton)|Appenzell]] et [[Schaffhouse (canton)|Schaffhouse]]" shift:(29,0)
  from:1498 till:1499 text: "1498-99 [[Guerre de Souabe]]" shift:(4,0)
  from:1519 till:1541 text: "1519-1541 [[Réforme]]~([[Ulrich Zwingli|Zwingli]], [[Jean Calvin|Calvin]])" shift:(21,0)
  from:1648 till:1648 text:"1648 Indépendance~([[Traités de Westphalie]])" shift:(2,0)
  barset:break
  from:1798 till:1803 text:"1798-1803 [[République helvétique]]" shift:(9,0)
  from:1803 till:1814 text:"1803-1814 [[Acte de médiation]]"shift:(15,0)
  from:1815 till:1815 text:"1815 Confédération des XXII cantons" shift:(2,0)
  from:1847 till:1847 text:"1847 [[Guerre du Sonderbund]]" shift:(2,0)
  from:1848 till:1848 text:"1848 Constitution fédérale" shift:(2,0)
  from:1971 till:1971 text:"1971 Vote des femmes~ au plan fédéral" shift:(2,0)
  from:1978 till:1978 text:"1978 Fondation du [[Jura]]" shift:(2,0)
  from:2001 till:2001 text:"2001 Nouvelle constitution" shift:(2,0)
  from:2002 till:2002 text:"2002 Entrée à l'[[ONU]]" shift:(2,0)
| Premiers ministres de Norvège | top next |

First version by (:Julien:) on Monday, August 16, 2004, last update on Tuesday, October 18, 2005
# All measures all in pixels
ImageSize  = width:160 height:620
PlotArea   = width: 26 height:530 left:50 bottom:90 # alignment is wrong when plotarea width (25) equals bar width (25)
                                                    # will be fixed in next EasyTimeline update
AlignBars  = early

Legend     = columns:1 left:40 top:70 columnwidth:300

# Color SP = value:green legend:Senterpartiet
Colors =
  id:krf value:yellow legend:Chrétien
  id:ap value:red legend:Travailliste
  id:sp value:green legend:Centriste
  id:h value:blue legend:Hoyre

DateFormat = yyyy
Period     = from:1945 till:2006
TimeAxis   = orientation:vertical
ScaleMajor = unit:year increment:4 start:1945

# there is no automatic collision detection,
# so shift texts up or down manually to avoid overlap

Define $dx = 25 # shift text to right side of bar


PlotData=
  bar:Leaders width:25 mark:(line,white) align:left fontsize:S
  from:1945  till:1951 shift:($dx,-4)   color:ap text:[[Einar Gerhardsen|Gerhardsen]]
  from:1951  till:1955 shift:($dx,-5)   color:ap text:[[Oscar Torp|Torp]]
  from:1955  till:1963 shift:($dx,-5)   color:ap text:[[Einar Gerhardsen|Gerhardsen]]
  from:1963  till:1963 shift:($dx,-5)   color:h text:[[John Lyng|Lyng]]
  from:1963  till:1965 shift:($dx,-1)   color:ap  text:[[Einar Gerhardsen|Gerhardsen]]
  from:1965  till:1971 shift:($dx,0)   color:sp  text:[[Per Borten|Borten]]
  from:1971  till:1972 shift:($dx,-3)   color:ap text:[[Trygve Bratteli|Bratteli]]
  from:1972  till:1973 shift:($dx,-3)   color:krf text:[[Lars Korvald|Korvald]]
  from:1973  till:1976 shift:($dx,-5)   color:ap text:[[Trygve Bratteli|Bratteli]]
  from:1976  till:1981 shift:($dx,-4)   color:ap  text:[[Odvar Nordli|Nordli]]
  from:1981  till:1981 shift:($dx,-4)   color:ap  text:[[Gro Harlem Brundtland|Brundtland]]
  from:1981  till:1986 shift:($dx,0)   color:blue text:[[Kåre Willoch|Willoch]]
  from:1986  till:1989 shift:($dx,-3)   color:ap  text:[[Gro Harlem Brundtland|Brundtland]]
  from:1989  till:1990 shift:($dx,-3)   color:h text:[[Jan P. Syse|Syse]]
  from:1990  till:1996 shift:($dx,0)   color:ap  text:[[Gro Harlem Brundtland|Brundtland]]
  from:1996  till:1997 shift:($dx,-5)   color:ap  text:[[Thorbjørn Jagland|Jagland]]
  from:1997  till:2000 shift:($dx,-3)   color:krf text:[[Kjell Magne Bondevik|Bondevik]]
  from:2000  till:2001 shift:($dx,-3)   color:ap  text:[[Jens Stoltenberg|Stoltenberg]]
  from:2001  till:2005 shift:($dx,-5)   color:krf text:[[Kjell Magne Bondevik|Bondevik]]
  from:2005  till:end  shift:($dx,-3)   color:ap text:[[Jens Stoltenberg|Stoltenberg]]
| Senlis (Oise) | top next |

Initial version by Pixeltoo on Monday, June 19, 2006
Colors=
  id:lightgrey value:gray(0.9)
  id:darkgrey  value:gray(0.7)
  id:sfondo value:rgb(1,1,1)
  id:barra value:rgb(0.6,0.7,0.8)

ImageSize  = width:350 height:373
PlotArea   = left:50 bottom:50 top:30 right:30
DateFormat = x.y
Period     = from:0 till:20000
TimeAxis   = orientation:vertical
AlignBars  = justify
ScaleMajor = gridcolor:darkgrey increment:5000 start:0
ScaleMinor = gridcolor:lightgrey increment:1000 start:0
BackgroundColors = canvas:sfondo

BarData=
  bar:1962 text:1962
  bar:1968 text:1968
  bar:1975 text:1975
  bar:1982 text:1982
  bar:1990 text:1990
  bar:1999 text:1999

PlotData=
  color:barra width:30 align:left

  bar:1962 from:0 till: 9371
  bar:1968 from:0 till: 11169
  bar:1975 from:0 till: 13639
  bar:1982 from:0 till: 14514
  bar:1990 from:0 till: 14439
  bar:1999 from:0 till: 16327

PlotData=

  bar:1962 at: 9371 fontsize:S text: 9.371 shift:(-8,5)
  bar:1968 at: 11169 fontsize:S text: 11.169 shift:(-10,5)
  bar:1975 at: 13639 fontsize:S text: 13.639 shift:(-10,5)
  bar:1982 at: 14514 fontsize:S text: 14.514 shift:(-10,5)
  bar:1990 at: 14439 fontsize:S text: 14.439 shift:(-10,5)
  bar:1999 at: 16327 fontsize:S text: 16.327 shift:(-10,5)

TextData=
  fontsize:S pos:(20,20)
  text:fonte INSEE - elaborazione grafica a cura di Wikipedia
| Broons | top next |

Initial version by Ash Crow on Sunday, July 9, 2006
Colors=
  id:lightgrey value:gray(0.9)
  id:darkgrey  value:gray(0.7)
  id:sfondo value:rgb(1,1,1)
  id:barra value:rgb(0.7,0.9,0.7)

ImageSize  = width:350 height:373
PlotArea   = left:50 bottom:50 top:30 right:30
DateFormat = x.y
Period     = from:0 till:2500
TimeAxis   = orientation:vertical
AlignBars  = justify
ScaleMajor = gridcolor:darkgrey increment:500 start:0
ScaleMinor = gridcolor:lightgrey increment:100 start:0
BackgroundColors = canvas:sfondo

BarData=
  bar:1962 text:1962
  bar:1968 text:1968
  bar:1975 text:1975
  bar:1982 text:1982
  bar:1990 text:1990
  bar:1999 text:1999

PlotData=
  color:barra width:30 align:left

  bar:1962 from:0 till: 2172
  bar:1968 from:0 till: 2256
  bar:1975 from:0 till: 2432
  bar:1982 from:0 till: 2389
  bar:1990 from:0 till: 2327
  bar:1999 from:0 till: 2382

PlotData=

  bar:1962 at: 2172 fontsize:S text: 2172 shift:(-8,5)
  bar:1968 at: 2256 fontsize:S text: 2256 shift:(-10,5)
  bar:1975 at: 2432 fontsize:S text: 2432 shift:(-10,5)
  bar:1982 at: 2389 fontsize:S text: 2389 shift:(-10,5)
  bar:1990 at: 2327 fontsize:S text: 2327 shift:(-10,5)
  bar:1999 at: 2382 fontsize:S text: 2382 shift:(-10,5)

TextData=
  fontsize:S pos:(20,20)
  text:source INSEE - élaboration graphique par Wikipedia
| Voix (musique classique) | top next |

First version by Xmlizer on Saturday, October 22, 2005, last update on Wednesday, May 31, 2006
ImageSize  = width:900 height:auto barincrement:15
PlotArea   = left:0 right:0 top:0 bottom:0
AlignBars  = justify
Colors =
  id:a value:rgb(0.7,0.7,1) # light yellow
  id:b value:rgb(1,0.7,0.7) # light red
  id:c value:rgb(0.7,1,0.7) # light green
  id:f value:gray(0.8)      # background bar
BarData =
  bar:pitch
  bar:Hz
  barset:ranges
  bar:pitch2
  bar:Hz2

Period      = from:0 till:720
TimeAxis    = orientation:horizontal

Define $cc2  = 2
Define $cc1  = 74
Define $cc   = 146
Define $c    = 218
Define $c1   = 290
Define $c2   = 362
Define $c3   = 434
Define $c4   = 506
Define $c5   = 578
Define $dd2  = 14
Define $dd1  = 86
Define $dd   = 158
Define $d    = 230
Define $d1   = 302
Define $d2   = 374
Define $d3   = 446
Define $d4   = 518
Define $d5   = 590
Define $ee2  = 26
Define $ee1  = 98
Define $ee   = 170
Define $e    = 242
Define $e1   = 314
Define $e2   = 386
Define $e3   = 458
Define $e4   = 530
Define $e5   = 602
Define $ff2  = 32
Define $ff1  = 104
Define $ff   = 176
Define $f    = 248
Define $f1   = 320
Define $f2   = 392
Define $f3   = 464
Define $f4   = 536
Define $f5   = 608
Define $gg2  = 44
Define $gg1  = 116
Define $gg   = 188
Define $g    = 260
Define $g1   = 332
Define $g2   = 404
Define $g3   = 476
Define $g4   = 548
Define $g5   = 620
Define $aa2  = 56
Define $aa1  = 128
Define $aa   = 200
Define $a    = 272
Define $a1   = 344
Define $a2   = 416
Define $a3   = 488
Define $a4   = 560
Define $a5   = 632
Define $hh2  = 68
Define $hh1  = 140
Define $hh   = 212
Define $h    = 284
Define $h1   = 356
Define $h2   = 428
Define $h3   = 500
Define $h4   = 572
Define $h5   = 644

Define $max  = 605
PlotData=
  align:center textcolor:black fontsize:8 mark:(line,black) width:12 shift:(0,-4)
  barset:ranges
  color:a from:0    till:$max text:[[Voix (instrument)|voix humaine]]
  color:b from:$cc  till:$f1  text:[[Basse (chant)|basse]]
  color:b from:$aa  till:$a1  text:[[baryton]]
  color:b from:$c   till:$d2  text:[[Ténor|ténor]]
  color:b from:$f   till:$g2  text:[[Alto (voix)|contralto ou alto]]
  color:b from:$a   till:$c3  text:[[mezzo-soprano]]
  color:b from:$c1  till:$e3  text:[[soprano]]
  color:f textcolor:blue align:left fontsize:S mark:(line,white) shift:(3,-4)

  bar:pitch
  from:0 till:$max
  at:$cc2  text:do-1
  at:$cc1  text:do0
  at:$cc   text:do1
  at:$c    text:do2
  at:$c1   text:do3
  at:$a1   text:la3
  at:$c2   text:do4
  at:$c3   text:do5
  at:$c4   text:do6
  at:$c5   text:do7___ Note

  bar:Hz
  from:0 till:$max
  at:23    text:20
  at:65    text:30
  at:105   text:44
  at:153   text:70
  at:190   text:100
  at:232   text:150
  at:262   text:200
  at:304   text:300
  at:344   text:440
  at:392   text:700
  at:430   text:1000
  at:472   text:1500
  at:502   text:2000
  at:544   text:3000
  at:583   text:4400 Hz

  bar:pitch2 # exact copy of bar:pitch
  from:0 till:$max
  at:$cc2  text:do-1
  at:$cc1  text:do0
  at:$cc   text:do1
  at:$c    text:do2
  at:$c1   text:do3
  at:$a1   text:la3
  at:$c2   text:do4
  at:$c3   text:do5
  at:$c4   text:do6
  at:$c5   text:do7___ Note

  bar:Hz2 # exact copy of bar:Hz
  from:0 till:$max
  at:23    text:20
  at:65    text:30
  at:105   text:44
  at:153   text:70
  at:190   text:100
  at:232   text:150
  at:262   text:200
  at:304   text:300
  at:344   text:440
  at:392   text:700
  at:430   text:1000
  at:472   text:1500
  at:502   text:2000
  at:544   text:3000
  at:583   text:4400 Hz
| Tour de France 2005 | top next |

First version by Jef-Infojef on Tuesday, July 5, 2005, last update on Monday, July 25, 2005
ImageSize  = width:480 height:600
PlotArea   = left:25 right:1 bottom:20 top:10
DateFormat = yyyy
Period     = from:1 till:21
TimeAxis   = orientation:vertical order:reverse
ScaleMajor = gridcolor:white unit:year increment:1 start:1

Colors =
  id:alggeel    value:rgb(1,1,0.4)
  id:bergrood   value:rgb(1,0.5,0.5)
  id:puntgroen  value:rgb(0.7,1,0.5)
  id:lichtgrijs value:rgb(0.95,0.95,0.95)

PlotData=

  bar:Leader color:alggeel width:110 mark:(line,black) align:center fontsize:S shift:(0,2)
  # shift texts up or down manually to avoid overlap
  from:1  till:4  text:[[David Zabriskie]]
  from:4  till:9  text:[[Lance Armstrong]]
  from:9  till:10  text:[[Jens Voigt]]
  from:10  till:21 text:[[Lance Armstrong]]

  bar:Sprinteur color:puntgroen
  # shift texts up or down manually to avoid overlap
  from:1  till:2  text:[[David Zabriskie]]
  from:2  till:12  text:[[Tom Boonen]]
  from:12 till:21  text:[[Thor Hushovd]]

  bar:Montagne color:bergrood
  # shift texts up or down manually to avoid overlap
  from:1  till:2  text:Non attribué
  from:2  till:3  text:[[Thomas Voeckler]]
  from:3  till:6  text:[[Erik Dekker]]
  from:6  till:7  text:[[Karsten Kroon]]
  from:7  till:8  text:[[Fabian Wegmann]]
  from:8  till:21  text:[[Michael Rasmussen]]

  bar:Jeune color:lichtgrijs
  # shift texts up or down manually to avoid overlap
  from:1  till:4  text:[[Fabian Cancellara]]
  from:4  till:8  text:[[Yaroslav Popovych]]
  from:8  till:10  text:[[Vladimir Karpets]]
  from:10  till:13 text:[[Alejandro Valverde]]
  from:13  till:21 text:[[Yaroslav Popovych]]
| Mont-Saint-Aignan | top next |

First version by Kuxu on Monday, July 17, 2006, last update on Sunday, July 30, 2006
Colors=
  id:lightgrey value:gray(0.9)
  id:darkgrey  value:gray(0.7)
  id:barra value:rgb(0.953,0.999,0.953)
  id:barra2 value:rgb(0.866,0.999,0.866)

ImageSize  = width:650 height:350
PlotArea   = left:50 bottom:50 top:30 right:30
DateFormat = x.y
Period     = from:0 till:25000
TimeAxis   = orientation:vertical
AlignBars  = justify
ScaleMajor = gridcolor:darkgrey increment:5000 start:0
ScaleMinor = gridcolor:lightgrey increment:1000 start:0
BackgroundColors = canvas:barra

BarData=
  bar:1962 text:1962
  bar:1968 text:1968
  bar:1975 text:1975
  bar:1982 text:1982
  bar:1990 text:1990
  bar:1999 text:1999

PlotData=
  color:barra2 width:30 align:left

  bar:1962 from:0 till: 9989
  bar:1968 from:0 till: 16031
  bar:1975 from:0 till: 19146
  bar:1982 from:0 till: 19736
  bar:1990 from:0 till: 19961
  bar:1999 from:0 till: 21265

PlotData=

  bar:1962 at: 9989 fontsize:S text: 9.989 shift:(-10,5)
  bar:1968 at: 16031 fontsize:S text: 16.031 shift:(-10,5)
  bar:1975 at: 19146 fontsize:S text: 19.146 shift:(-10,5)
  bar:1982 at: 19736 fontsize:S text: 19.736 shift:(-10,5)
  bar:1990 at: 19961  fontsize:S text: 19.961 shift:(-10,5)
  bar:1999 at: 21265 fontsize:S text: 21.265 shift:(-10,5)

TextData=
  fontsize:S pos:(30,20)
  text:source INSEE
| Gentioux-Pigerolles | top next |

First version by Guimard on Monday, June 5, 2006, last update on Saturday, July 29, 2006
ImageSize  = width:290 height:210
PlotArea   = left:40 right:10 top:10 bottom:20
TimeAxis   = orientation:horizontal
AlignBars  = justify
Colors =
  id:gray1 value:gray(0.9)

DateFormat = yyyy
Period     = from:1960 till:2000
ScaleMajor = unit:year increment:10 start:1960

PlotData =
  bar:900 color:gray1 width:1
  from:start till:end
  bar:600 color:gray1
  from:start till:end
  bar:300 color:gray1
  from:start till:end
  bar:0 color:gray1


LineData =
  layer:front
  points:(52,147)(88,127) color:blue    width:1 #1962 à 1968.  1962: 634 1968: 535
  points:(88,127)(130,104) color:blue    width:1 #1975: 419
  points:(130,104)(172,94) color:blue    width:1 #1982: 371
  points:(172,94)(220,93) color:blue    width:1 #1990: 367
  points:(220,93)(274,98) color:blue    width:1 #1999: 389
| Température de couleur | top next |

First version by FoeNyx on Thursday, December 2, 2004, last update on Wednesday, June 14, 2006
DateFormat = yyyy
ImageSize  = width:470 height:auto barincrement:45
PlotArea   = left:20 right:20 bottom:20 top:20
Colors     =
  id:bleu              value:blue
  id:canvas            value:rgb(0.97,0.97,0.97)
  id:gris              value:gray(0.80)
  id:noir              value:black
  id:grilleMajor       value:rgb(0.80,0.80,0.80)
  id:bleuclair         value:rgb(0.56,0.56,0.86)
  id:rouge             value:red
  id:rougeclair        value:rgb(0.86,0.56,0.56)
  id:grilleMinor       value:rgb(0.86,0.86,0.86)

Period     = from:1000 till:11000
Define $blank = at:-1
TimeAxis   = orientation:horizontal format:yyyy
AlignBars  = justify
ScaleMinor = unit:year increment:1000 start:1000 gridcolor:grilleMinor
ScaleMajor = unit:year increment:5000 start:1000 gridcolor:grilleMajor
BackgroundColors = canvas:canvas bars:canvas
BarData=
  bar:Kelvin
  barset:exemple

PlotData=
  bar:Kelvin color:bleu shift:(0,0) width:30
  from:start till:end color:gris # Arrière plan
  fontsize:M textcolor:white align:center
  from:1000  till:11000  text:"Températures en Kelvin"
  barset:exemple color:bleuclair shift:(5,0) width:25

  # alignement : texte <- date
  fontsize:S textcolor:black anchor:till align:left

  from:2000  till:2000  text:"2000~Soleil à l'horizon" color:rouge
  from:2200  till:2200  text:"2200~Lampe au sodium" color:rouge
  from:2400  till:2700  text:"2400-2700~Lampe à incandescence" color:rouge
  from:2700  till:3000  text:"2700-3000~Lampe fluorescente blanc chaud" color:rouge
  from:3000  till:3200  text:"3000-3200~Lampe halogène" color:rouge
  from:3900  till:4200  text:"3900-4200~Lampe fluorescente blanc neutre" color:rouge

  from:3000  till:4200  text:"3000-4200~Lampes aux halogénures métalliques" color:rouge

  #Recommencer l'indentation en haut
  barset:break

  from:5400  till:6100  text:"5400-6100~Lampe fluorescente lumière du jour" color:rouge
  from:5800  till:5800  text:"5800~Soleil au zénith" color:rouge
  from:6500  till:6500  text:"6500~Lumière naturelle normée" color:rouge
  from:10000  till:10000  text:"10000~Ciel boréal" color:rouge
| Template:Tableau Histoire Hominines | top next |

First version by Jyp on Monday, December 6, 2004, last update on Sunday, July 16, 2006
DateFormat = yyyy
ImageSize  = width:800 height:auto barincrement:16
PlotArea   = left:20 right:20 bottom:20 top:10
Colors     =
  id:blanc             value:rgb(1,1,1)
  id:noir              value:black
  id:canvas            value:gray(0.98)
  id:holocene          value:rgb(1,0.984,0.941)
  id:pleisto           value:rgb(1,0.968,0.690)
  id:pliocene          value:rgb(1,1,0.6)
  id:miocene           value:rgb(1,1,0)
  id:paleo             value:rgb(0.651,0.875,0.616)
  id:gris              value:gray(0.80)
  id:exbleu            value:rgb(0.3,0.3,0.7)
  id:bleu              value:rgb(0.45,0.45,0.80)
  id:bleuclair         value:rgb(0.65,0.65,0.90)
  id:rouge             value:rgb(0.8,0.30,0.30)
  id:rougemoy          value:rgb(0.88,0.45,0.45)
  id:rougeclair        value:rgb(0.92,0.64,0.64)
  id:rougeclair2       value:rgb(0.95,0.84,0.84)
  id:orange            value:rgb(1,0.7,0.3)
  id:orangesom         value:rgb(0.9,0.45,0.25)
  id:or                value:rgb(1,0.9,0)
  id:grilleMajor       value:gray(0.7)
  id:grilleMinor       value:gray(0.9)

Period     = from:-7100 till:0
TimeAxis   = orientation:horizontal format:yyyy
AlignBars  = justify
ScaleMinor = unit:year increment:100 start:-6900 gridcolor:grilleMinor
ScaleMajor = unit:year increment:500 start:-7000 gridcolor:grilleMajor
BackgroundColors = canvas:canvas bars:canvas
BarData=
  bar:evenement1
  bar:espace1
  bar:evenement2
  bar:espace2
  bar:evenement3
  bar:espace3
  bar:evenement4
  bar:espace4
  bar:evenement4bis
  bar:espace4bis
  bar:evenement4ter
  bar:espace4ter
  bar:evenement5
  bar:espace5
  bar:evenement6
  bar:espace6
  bar:evenement7
  bar:espace7
  bar:evenement8
  bar:espace8
  bar:evenement9
  bar:espace9
  bar:evenement0b
  bar:espace0b
  bar:evenement0c
  bar:espace0c
  bar:evenement0d
  bar:espace0d
  bar:evenement0e
  bar:espace0e
  bar:evenement0f
  bar:espace0f
#  barset:evenement
  bar:ages0
  bar:ages

Define $center = anchor:from align:center
Define $left   = anchor:from align:left  shift:( 4,-4)
Define $right  = anchor:till align:right shift:(-4,-4)
Define $left2  = anchor:from align:left  shift:( 4, 3)
Define $right2 = anchor:till align:right shift:(-4, 3)

PlotData=

  bar:evenement1   color:noir width:20 $left
  from:-6500  till:-5500 color:orange textcolor:noir text:"[[Orrorin tugenensis| ]]Orrorin tugenensis*" $left
  from:-4500  till:-3500 color:rougeclair
                at:-4000 textcolor:noir text:"[[Australopithecus anamensis| ]]Australopithecus anamensis*" $center
  from:-3000  till:-2000 color:rougeclair2 textcolor:noir text:"[[Australopithecus aethiopicus| ]]Australopithecus aethiopicus" $left

  bar:evenement2   color:noir width:20 $center
  from:-7100  till:-6800 color:orangesom textcolor:noir text:"[[Sahelanthropus tchadensis| ]]Sahelanthropus tchadensis*" $left
  from:-4100  till:-2900 color:rougeclair
                at:-3500 textcolor:noir text:"[[Australopithecus afarensis| ]]Australopithecus afarensis"
  from:-2400  till:-1200 color:rougeclair2
                at:-1800 textcolor:noir text:"[[Australopithecus boisei| ]]Australopithecus boisei"

  bar:evenement3   color:noir width:20
  from:-6300  till:-5300 color:rouge
                at:-5800 textcolor:noir text:"[[Ardipithecus kadabba| ]]Ardipithecus kadabba*"
  from:-4900  till:-3900 color:rouge
                at:-4400 textcolor:noir text:"[[Ardipithecus ramidus| ]]Ardipithecus~  ramidus*" shift:(0,2)
  from:-3700  till:-2800 color:rougeclair
                at:-3250 textcolor:noir text:"[[Australopithecus bahrelghazali| ]]Australopithecus ~bahrelghazali*" shift:(0,2)
  from:-2200  till:-1000 color:rougeclair2
                at:-1600 textcolor:noir text:"[[Australopithecus robustus| ]]Australopithecus robustus"

  bar:evenement4   color:noir width:20 $right
  from:-3600  till:-3200 color:rougemoy textcolor:noir text:"[[Kenyanthropus platyops| ]]Kenyanthropus platyops*"
  from:-2950  till:-1950 color:rougeclair
                at:-2450 textcolor:noir text:"[[Australopithecus garhi| ]]Australopithecus~garhi*" $center shift:(0,2)

  bar:evenement4bis color:noir width:20 $right
  from:-3000  till:-2000 color:rougeclair textcolor:noir text:"[[Australopithecus africanus| ]]Australopithecus~africanus*" shift:(0,2)

  bar:evenement4ter color:noir width:20 $right
  from:-2900  till:-1700 color:bleuclair
                at:-2300 textcolor:noir text:"[[Homo rudolfensis| ]]Homo rudolfensis" $center

  bar:evenement5   color:noir width:20 $left
  from:-2400  till:-1700 color:bleuclair textcolor:noir text:"[[Homo habilis| ]]Homo habilis"

  bar:espace5 width:12 at:-2000 mark:(line, bleu)

  bar:evenement6   color:noir width:20 $left
  from:-2000  till:-1000 color:bleuclair
                at:-1500 textcolor:noir text:"[[Homo ergaster| ]]Homo ergaster " $center

  bar:espace6 width:12 at:-1750 mark:(line, bleu)
  bar:espace6 width:12 at:-1700 mark:(line, bleu)

  bar:evenement7   color:noir width:20
  from:-1700  till:-1400 color:bleuclair textcolor:noir text:"[[Homo georgicus| ]]Homo  ~georgicus*" $left2
  from:-100   till:-12    color:bleuclair textcolor:noir text:"[[Homo floresiensis| ]]Homo     ~floresiensis*" $right2
                       at:-1750 mark:(line, bleu)

  bar:espace7 width:12 at:-1750 mark:(line, bleu)
  bar:espace7 width:12 at:-100 mark:(line, bleu)

  bar:evenement8   color:noir width:20 $left
  from:-1750  till:-100 color:bleuclair
                at:-925 textcolor:noir text:"[[Homo erectus| ]]Homo erectus" $center

  bar:espace8 width:12 at:-900 mark:(line, bleu)
  bar:espace8 width:12 at:-700 mark:(line, bleu)
  bar:espace8 width:12 at:-100 mark:(line, bleu)

  bar:evenement9   color:noir width:20 $left
  from:-900  till:-780 color:bleuclair textcolor:noir text:"[[Homo antecessor| ]]Homo antecessor*" $right
  from:-100   till:-27 color:bleuclair textcolor:noir text:"[[Homo soloensis| ]]Homo  ~soloensis" $right2
                at:-700  mark:(line, bleu)

  bar:espace9  width:12 at:-700 mark:(line, bleu)

  bar:evenement0b   color:noir width:20 $left
  from:-700   till:-300 color:bleuclair textcolor:noir text:"[[Homo rhodesiensis| ]]Homo rhodesiensis" $right

  bar:espace0b width:12 at:-600 mark:(line, bleu)

  bar:evenement0c   color:noir width:20 $left
  from:-230   till:-28 color:bleuclair textcolor:noir text:"[[Homo neanderthalensis| ]]Homo neanderthalensis" $right

                        at:-600 mark:(line, bleu)
  bar:espace0c width:12 at:-600 mark:(line, bleu)
  bar:espace0c width:12 at:-230 mark:(line, bleu)

  bar:evenement0d   color:noir width:20 $left
  from:-600   till:-150 color:bleuclair textcolor:noir text:"[[Homo heidelbergensis| ]]Homo heidelbergensis(1)" $right

  bar:espace0d width:12 at:-200 mark:(line, bleu)

  bar:evenement0e   color:noir width:20 $left
  from:-200   till:-95   color:bleuclair textcolor:noir text:"[[Homo helmei| ]]Homo helmei(2)" $right

  bar:espace0e width:12 at:-200 mark:(line, bleu)

  bar:evenement0f   color:noir width:20 $left
  from:-200  till:0 color:bleuclair textcolor:noir text:"[[Homo sapiens| ]]Homo sapiens" $right

  bar:ages0
  from:-2600 till:-10 width:10 color:paleo textcolor:blanc
               at:-1600 text:"[[Paleolithique|Paléolithique]]"

  bar:ages fontsize:9
  from:-7100 till:-5332   color:miocene
               at:-6500 text:"[[Miocène]]"
  from:-5332 till:-1806   color:pliocene
               at:-3800 text:"[[Pliocène]]"
  from:-1806 till:-11     color:pleisto
               at:-1300 text:"[[Pléistocène]]"
  from:-11   till:0    color:holocene
               at:-295  text:"[[Holocène|Holo.]]"
               at:-5332 mark:(line, noir)
               at:-1806 mark:(line, noir)
               at:-11 mark:(line, noir)
               at:0 mark:(line, noir)
| Template:Tableau Histoire Hominines années 1980 | top next |

First version by Saxon on Tuesday, December 14, 2004, last update on Wednesday, May 31, 2006
DateFormat = yyyy
ImageSize  = width:800 height:auto barincrement:35
PlotArea   = left:20 right:25 bottom:20 top:10
Colors     =
  id:noir              value:black
  id:canvas            value:rgb(0.97,0.97,0.97)
  id:Holo     value:rgb(0.4,0.8,0.7)
  id:PSup     value:rgb(0.5,1,0.5)
  id:PMoy     value:rgb(0.6,1,0.6)
  id:PInf     value:rgb(0.7,1,0.7) # vert clair
  id:Plio     value:rgb(0.8,1,0.8) # vert pâle
  id:gris              value:gray(0.80)
  id:grilleMajor       value:rgb(0.80,0.80,0.80)
  id:bleuclair         value:rgb(0.56,0.56,0.86)
  id:rouge             value:red
  id:rougeclair        value:rgb(0.86,0.56,0.56)
  id:bleu              value:rgb(0.76,0.76,0.96)
  id:grilleMinor       value:rgb(0.86,0.86,0.86)

Period     = from:-3500 till:0
TimeAxis   = orientation:horizontal format:yyyy
AlignBars  = justify
ScaleMinor = unit:year increment:100 start:-3400 gridcolor:grilleMinor
ScaleMajor = unit:year increment:500 start:-3500 gridcolor:grilleMajor
BackgroundColors = canvas:canvas bars:canvas
BarData=
  bar:texte
  bar:evenement
  bar:ages

PlotData=

  bar:texte

  bar:evenement color:noir shift:(2,0) width:20

  from:-3500  till:-2500  text:"[[Australopithecus africanus]]" color:bleuclair anchor:from
  from:-2500  till:-1750  text:"[[Homo habilis]]" color:bleu anchor:from
  from:-1750  till:-230   text:"[[Homo erectus]]" color:bleuclair anchor:from
  from:-230   till:-100   text:"[[Homo neandertalensis]]" color:bleu shift:(-130,10)
  from:-100   till:0      text:"[[Homo sapiens]]" color:bleuclair shift:(-70,20)

  bar:ages
  from:-3500 till:-1806 color:Plio
               at:-3200 text:"[[Pliocène|Pliocène]]"
  from:-1806 till:-781 color:Pinf
               at:-1550 text:"[[Pleistocène|Pléistocène inférieur]]"
  from:-781  till:-126  color:Pmoy
               at:-700 text:"[[Pleistocène|Pléistocène moyen]]"
  from:-126  till:-11   color:Psup
               at:-115 text:"[[Pleistocène|sup]]"
  from:-11  till:0     text:"[[Holocène|Hol.]]" color:Holo
| Chronologie de la France sous la Restauration (1814-1830) | top next |

First version by Yug on Thursday, July 7, 2005, last update on Sunday, November 6, 2005
ImageSize  = width:740 height:180
PlotArea   = width:700 height:150 left:20 bottom:20
AlignBars  = early
DateFormat = dd/mm/yyyy
Period     = from:01/01/1830 till:01/10/1830
Colors     =
  id:canvas      value:rgb(0.97,0.97,0.97)
  id:grid1       value:rgb(0.80,0.80,0.80)
  id:grid2       value:rgb(0.86,0.86,0.86)
  id:gris        value:gray(0.7)
  id:noir        value:black
  id:blanc       value:white
  id:jaune       value:rgb(0.9,0.8,0.3)
  id:rouge       value:rgb(1,0.3,0.3)
  id:bleu        value:rgb(0.3,0.3,1)
  id:guerre      value:red
ScaleMajor = gridcolor:grid1 unit:month increment:1 start:01/01/1830
TimeAxis   = orientation:horizontal  format:dd/mm/yyyy
BarData    =
  bar:Epoques
  barset:Evenements

PlotData   =

  bar:Epoques align:center
    from:start         till:end           color:gris # Arrière plan
    from:start         till:18/03/1830    text:"... 1829 - 18 mars 1830"     color:jaune
    from:18/03/1830    till:09/08/1830    text:"1830~18 mars-9 aout " color:rouge
    from:09/08/1830    till:end           text:"9 aout juillet 1830-1848 ...~Monarchie de Juillet" color:bleu align:left shift:(-60,)

  barset:Evenements color:gris align:left shift:(5,)
    from:start         till:18/03/1830    text:"1829 - 1830 ~Conflit [[Polignac]]/Assemblée" shift:(-60,)
    from:18/03/1830    till:18/03/1830    text:"18 mars ~[[Adresse des 221]]"
    from:16/05/1830    till:16/05/1830    text:"16 mai ~[[Dissolution de mai 1830|Dissolution]]"
    from:23/06/1830    till:19/07/1830    text:"23 juin et 19 juillet ~Elections législatives" shift:(-20,)
  barset:break
    from:25/07/1830    till:26/07/1830    text:"25-26 juillet ~[[Ordonnances de Saint-Cloud|Ordonnances de juillet]]"
    from:27/07/1830    till:29/07/1830    text:"27-28-29 juillet~[[Trois glorieuses]]" color:guerre
    from:29/07/1830    till:09/08/1830    text:"29 juillet-9 aout ~[[Hésitation de 1830|Hésitation]]"
| Template:Chronologie des inventions et découvertes (Préhistoire) | top next |

First version by Saxon ? on Tuesday, December 21, 2004, last update on Sunday, April 24, 2005
DateFormat = yyyy
ImageSize  = width:800 height:auto barincrement:35
PlotArea   = left:20 right:27 bottom:20 top:10
Colors     =
  id:prehistoire   value:rgb(0.7,0.5,1)
  id:protohistoire value:rgb(1,0.7,0.7)
  id:noir          value:black
  id:canvas        value:rgb(0.97,0.97,0.97)
  id:Holo          value:rgb(0.4,0.8,0.7)
  id:PSup          value:rgb(0.5,1,0.5)
  id:PMoy          value:rgb(0.6,1,0.6)
  id:PInf          value:rgb(0.7,1,0.7) # vert clair
  id:Plio          value:rgb(0.8,1,0.8) # vert pâle
  id:gris          value:gray(0.80)
  id:grilleMajor   value:rgb(0.80,0.80,0.80)
  id:bleuclair     value:rgb(0.56,0.56,0.86)
  id:rouge         value:red
  id:rougeclair    value:rgb(0.86,0.56,0.56)
  id:bleu          value:rgb(0.76,0.76,0.96)
  id:grilleMinor   value:rgb(0.86,0.86,0.86)

Period     = from:-3500 till:0
TimeAxis   = orientation:horizontal format:yyyy
AlignBars  = justify
ScaleMinor = unit:year increment:100 start:-3400 gridcolor:grilleMinor
ScaleMajor = unit:year increment:500 start:-3500 gridcolor:grilleMajor
BackgroundColors = canvas:canvas bars:canvas
BarData=
  barset:inventions
  bar:histoire
  bar:ages

Define $marquerouge = text:"*" textcolor:rouge   shift:(0,3) fontsize:10

PlotData=

  width:20 shift:(3,-4) anchor:from

  barset:inventions color:bleuclair
  from:-3000  till:-2400 text:"Outils lithiques à 1 face"
  from:-2400  till:-1000 text:"Monofaces dentelés"
  from:-1000  till:  -10 text:"Bifaces"
  from:-1600  till:-1400 text:"Découverte du feu"
  from: -600  till: -200 text:"Maîtrise du feu"
  from:  -40  till:  -20 text:"Emmanchement des outils" shift:(-136,-4)

  bar:histoire color:prehistoire
  at:      0   align:right $marquerouge
  at:   -120   align:left  $marquerouge
  from:-3500 till: -120
               at:-3500 text:"[[Prehistoire]]"
  from: -120 till:    0
               at: -120 text:"[[Protohistoire|Protoh.]]"

  bar:ages
  from:-3500 till:-1806 color:Plio
               at:-3200 text:"[[Pliocène|Pliocène]]"
  from:-1806 till:-781 color:Pinf
               at:-1550 text:"[[Pleistocène|Pléistocène inférieur]]"
  from:-781  till:-126  color:Pmoy
               at:-700 text:"[[Pleistocène|Pléistocène moyen]]"
  from:-126  till:-11   color:Psup
               at:-115 text:"[[Pleistocène|sup]]"
  from:-11  till:0     text:"[[Holocène|Hol.]]" color:Holo
| Template:Chronologie des inventions et découvertes (Préhistoire) | top next |

First version by Saxon ? on Tuesday, December 21, 2004, last update on Sunday, April 24, 2005
DateFormat = yyyy
ImageSize  = width:800 height:auto barincrement:35
PlotArea   = left:20 right:27 bottom:20 top:10
Colors     =
  id:prehistoire   value:rgb(0.7,0.5,1)
  id:protohistoire value:rgb(1,0.7,0.7)
  id:noir          value:black
  id:canvas        value:rgb(0.97,0.97,0.97)
  id:Holo          value:rgb(0.4,0.8,0.7)
  id:PSup          value:rgb(0.5,1,0.5)
  id:PMoy          value:rgb(0.6,1,0.6)
  id:PInf          value:rgb(0.7,1,0.7) # vert clair
  id:Plio          value:rgb(0.8,1,0.8) # vert pâle
  id:gris          value:gray(0.80)
  id:grilleMajor   value:rgb(0.80,0.80,0.80)
  id:bleuclair     value:rgb(0.56,0.56,0.86)
  id:rouge         value:red
  id:rougeclair    value:rgb(0.86,0.56,0.56)
  id:bleu          value:rgb(0.76,0.76,0.96)
  id:grilleMinor   value:rgb(0.86,0.86,0.86)

Period     = from:-120 till:0
TimeAxis   = orientation:horizontal format:yyyy
AlignBars  = justify
ScaleMinor = unit:year increment:5  start:-120 gridcolor:grilleMinor
ScaleMajor = unit:year increment:10 start:-120 gridcolor:grilleMajor
BackgroundColors = canvas:canvas bars:canvas
BarData=
  barset:inventions
  barset:culture
  bar:histoire

Define $marquerouge = text:"*" textcolor:rouge shift:(0,3)

PlotData=

  width:20 shift:(3,-4) anchor:from

  barset:culture
  from:-120 till:-85 text:"[[Acheuleen|Acheuléen]]"     color:Plio
  from: -85 till:-70 text:"[[Micoquien|Micoquien]]"     color:Pinf
  from: -70 till:-30 text:"[[Mousterien|Moustérien]]"   color:Pmoy
  from: -30 till:-20 text:"[[Aurignacien|Aurignacien]]" color:Psup
  from: -10 till: -6 text:"Cult. méso."                 color:Holo
  from:  -6 till:  0 text:"Néo."                        color:Plio


  bar:histoire
  at:     0           align:right  $marquerouge
  at:   -20           align:left   $marquerouge
  from:-120 till: -35 color:prehistoire
              at:-120 text:"Paléolithique moyen"
  from: -35 till: -10 color:protohistoire
              at: -35 text:"Paléolithique supérieur"
  from: -10 till:  -6 color:Holo
              at: -10 text:"[[Mésolithique]]"  shift:(3,-8)
  from:  -6 till:   0 color:Plio
              at:  -6 text:"Néo." shift:(3,3)
| Template:Chronologie des inventions et découvertes (Préhistoire) | top next |
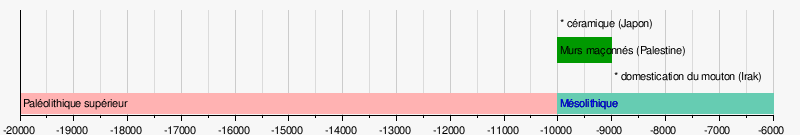
First version by Saxon ? on Tuesday, December 21, 2004, last update on Sunday, April 24, 2005
DateFormat = yyyy
ImageSize  = width:800 height:auto barincrement:35
PlotArea   = left:20 right:27 bottom:20 top:10
Colors     =
  id:prehistoire   value:rgb(0.7,0.5,1)
  id:protohistoire value:rgb(1,0.7,0.7)
  id:noir          value:black
  id:canvas        value:rgb(0.97,0.97,0.97)
  id:Holo          value:rgb(0.4,0.8,0.7)
  id:PSup          value:rgb(0.5,1,0.5)
  id:PMoy          value:rgb(0.6,1,0.6)
  id:PInf          value:rgb(0.7,1,0.7) # vert clair
  id:Plio          value:rgb(0.8,1,0.8) # vert pâle
  id:gris          value:gray(0.80)
  id:grilleMajor   value:rgb(0.80,0.80,0.80)
  id:bleuclair     value:rgb(0.56,0.56,0.86)
  id:rouge         value:red
  id:rougeclair    value:rgb(0.86,0.56,0.56)
  id:bleu          value:rgb(0.76,0.76,0.96)
  id:grilleMinor   value:rgb(0.86,0.86,0.86)

Period     = from:-20000 till:-6000
TimeAxis   = orientation:horizontal format:yyyy
AlignBars  = justify
ScaleMinor = unit:year increment:500  start:-20000 gridcolor:grilleMinor
ScaleMajor = unit:year increment:1000 start:-20000 gridcolor:grilleMajor
BackgroundColors = canvas:canvas bars:canvas
BarData=
  barset:inventions
  bar:histoire

Define $marquerouge = text:"*" textcolor:rouge shift:(0,3)

PlotData=
  barset:inventions shift:(3,-4) anchor:from

  at:  -10000            align:left text:"* céramique (Japon)"
  from:-10000 till:-9000            text:"Murs maçonnés (Palestine)"
  at:   -9000            align:left text:"* domestication du mouton (Irak)"


   bar:histoire width:20

   from:-20000 till:-10000 color:protohistoire
               at:  -20000 text:"Paléolithique supérieur"
   from:-10000 till: -6000 color:Holo
               at:  -10000 text:"[[Mésolithique]]"
| Template:Chronologie viking | top next |
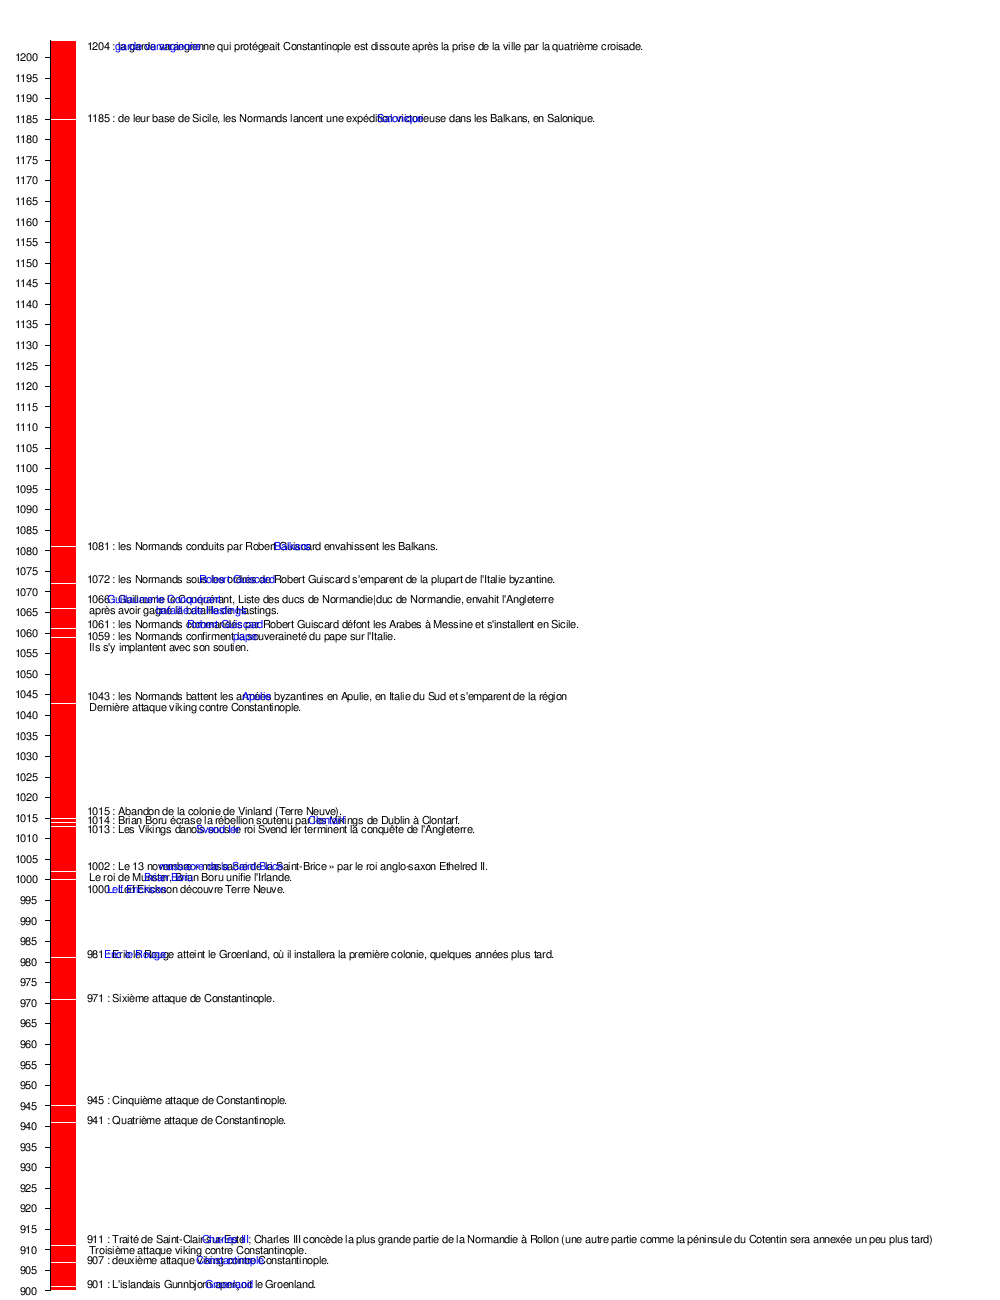
First version by Saxon ? on Thursday, January 6, 2005, last update on Friday, March 31, 2006
ImageSize  = width:1000 height:1300
PlotArea   = width:500 height:1250 left:50 bottom:10

DateFormat = yyyy
Period     = from:900 till:1204
TimeAxis   = orientation:vertical
ScaleMajor = unit:year increment:5 start:900


Define $dx = 25 # shift text to right side of bar

PlotData=
  bar:Leaders color:red width:25 mark:(line,white) align:left fontsize:S

  from:start till:901 shift:($dx,0) text:"901 : L'islandais Gunnbjorn aperçoit le [[Groenland]]."
  from:901 till:907 shift:($dx,10) text:"907 : deuxième attaque viking contre [[Constantinople]]."
  from:907 till:911 shift:($dx,10) text:"911 : Traité de Saint-Clair-sur-Epte ; [[Charles III de France|Charles III]] concède la plus grande partie de la Normandie à Rollon (une autre partie comme la péninsule du Cotentin sera annexée un peu plus tard) ~ Troisième attaque viking contre Constantinople."
  from:911 till:941 shift:($dx,60) text:"941 : Quatrième attaque de Constantinople."
  from:941 till:945 shift:($dx,10) text:"945 : Cinquième attaque de Constantinople."
  from:945 till:971 shift:($dx,50) text:"971 : Sixième attaque de Constantinople."
  from:971 till:981 shift:($dx,20) text:"981 : [[Eric le Rouge]] atteint le Groenland, où il installera la première colonie, quelques années plus tard."
  from:981 till:1000 shift:($dx,25) text:"1000 : [[Leif Erickson]] découvre Terre Neuve."
  from:1000 till:1002 shift:($dx,5) text:"1002 : Le 13 novembre « [[massacre de la Saint-Brice]] » par le roi anglo-saxon Ethelred II.  ~ Le roi de Munster, [[Brian Boru]] unifie l'Irlande."
  from:1002 till:1013 shift:($dx,15) text:"1013 : Les Vikings danois sous le roi [[Svend Ier]] terminent la conquête de l'Angleterre."
  from:1013 till:1014 shift:($dx,0) text:"1014 : Brian Boru écrase la rébellion soutenu par les Vikings de Dublin à [[Clontarf]]."
  from:1014 till:1015 shift:($dx,5) text:"1015 : Abandon de la colonie de Vinland (Terre Neuve)."
  from:1015 till:1043 shift:($dx,60) text:"1043 : les Normands battent les armées byzantines en [[Apulie]], en Italie du Sud et s'emparent de la région ~ Dernière attaque viking contre Constantinople."
  from:1043 till:1059 shift:($dx,30) text:"1059 : les Normands confirment la souveraineté du [[pape]] sur l'Italie. ~ Ils s'y implantent avec son soutien."
  from:1059 till:1061 shift:($dx,5) text:"1061 : les Normands commandés par [[Robert Guiscard]] défont les Arabes à Messine et s'installent en Sicile."
  from:1061 till:1066 shift:($dx,15) text:"1066 : [[Guillaume le Conquérant]], Liste des ducs de Normandie|duc de Normandie, envahit l'Angleterre ~ après avoir gagné la [[bataille de Hastings]]."
  from:1066 till:1072 shift:($dx,13) text:"1072 : les Normands sous les ordres de [[Robert Guiscard]] s'emparent de la plupart de l'Italie byzantine."
  from:1072 till:1081 shift:($dx,15) text:"1081 : les Normands conduits par Robert Guiscard envahissent les [[Balkans]]."
  from:1081 till:1185 shift:($dx,210) text:"1185 : de leur base de Sicile, les Normands lancent une expédition victorieuse dans les Balkans, en [[Salonique]]."
  from:1185 till:1204 shift:($dx,30) text:"1204 : la [[garde varangienne]] qui protégeait Constantinople est dissoute après la prise de la ville par la quatrième croisade."
| Template:Chronologie viking | top next |
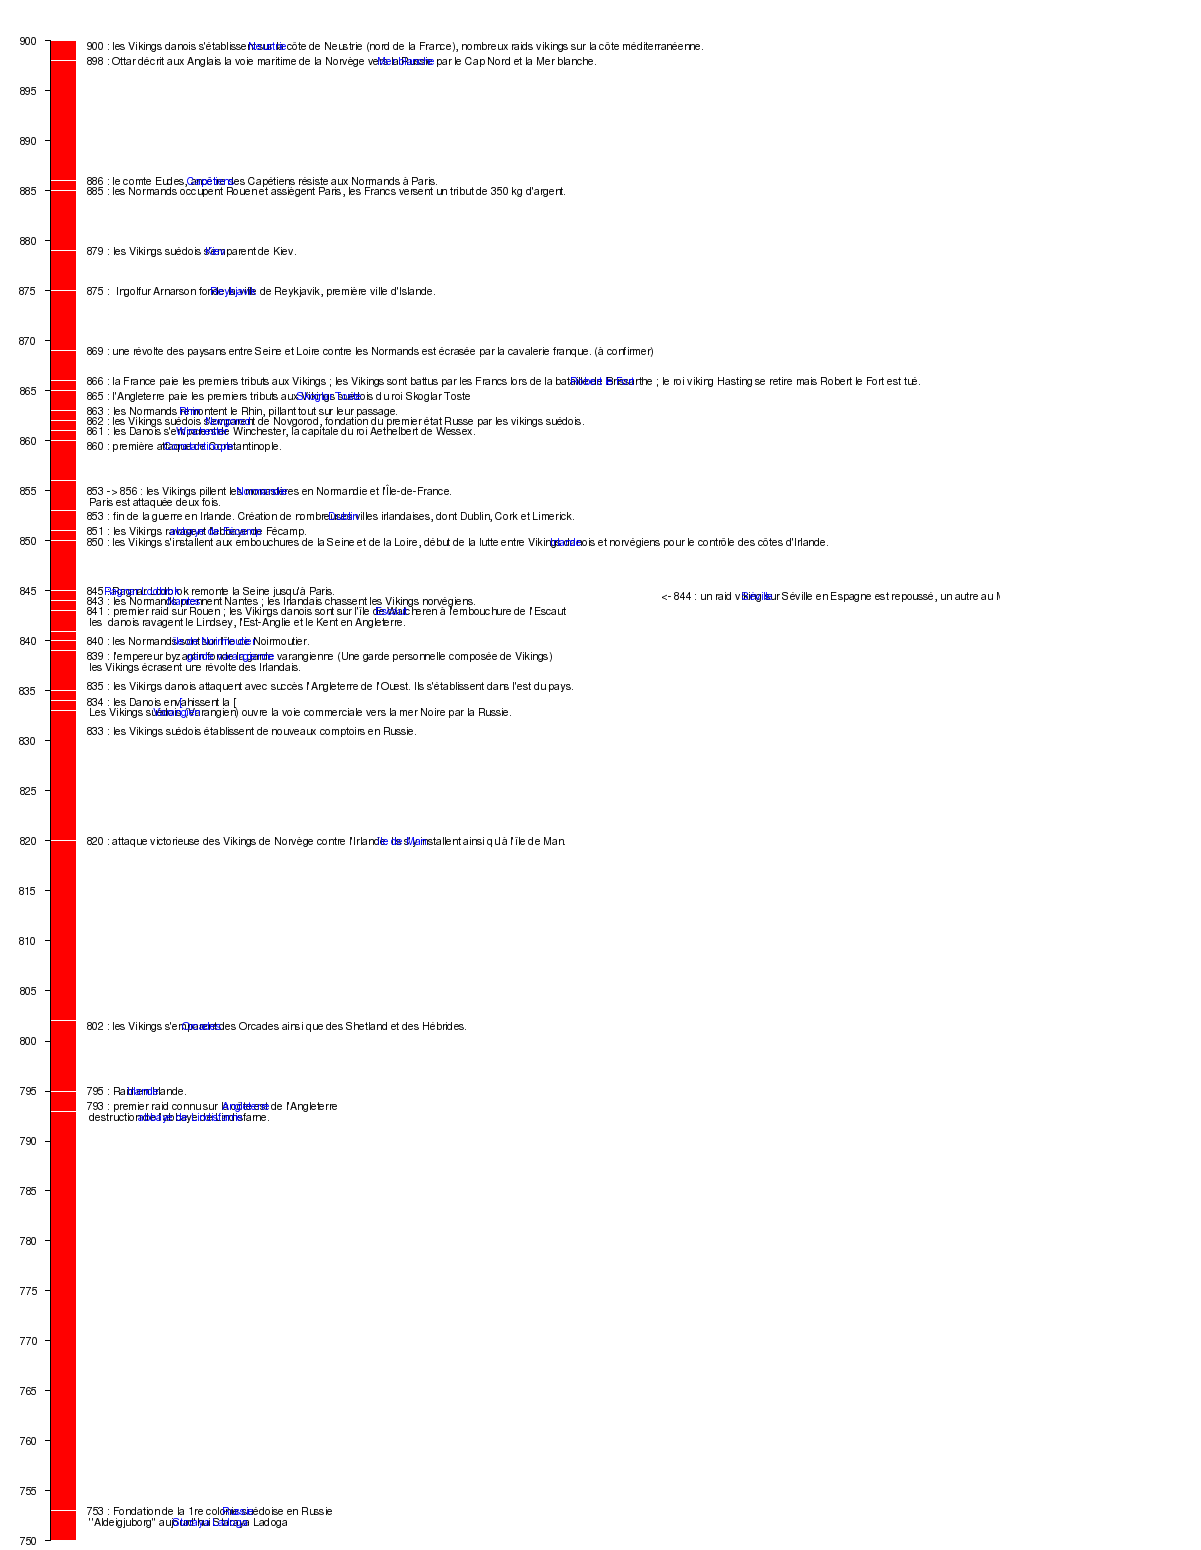
First version by Saxon ? on Thursday, January 6, 2005, last update on Friday, March 31, 2006
ImageSize  = width:1000 height:1550
PlotArea   = width:500 height:1500 left:50 bottom:10

DateFormat = yyyy
Period     = from:750 till:900
TimeAxis   = orientation:vertical
ScaleMajor = unit:year increment:5 start:750


Define $dx = 25 # shift text to right side of bar

PlotData=
  bar:Leaders color:red width:25 mark:(line,white) align:left fontsize:S

  from:start till:753 shift:($dx,10) text:"753 : Fondation de la 1re colonie suédoise en [[Russie]] ~ ''Aldeigjuborg'' aujourd'hui [[Staraya Ladoga]]"
  from:753 till:793 shift:($dx,200) text:"793 : premier raid connu sur la côte est de l'[[Angleterre]] ~ destruction de l'[[abbaye de Lindisfarne]]."
  from:793 till:795 shift:($dx,5) text:"795 : Raid en [[Irlande]]."
  from:795 till:802  shift:($dx,25) text:"802 : les Vikings s'emparent des [[îles des Orcades|Orcades]] ainsi que des Shetland et des Hébrides."
  from:802 till:820 shift:($dx,85) text:"820 : attaque victorieuse des Vikings de Norvège contre l'Irlande. Ils s'y installent ainsi qu'à l'[[île de Man]]."
  from:820 till:833 shift:($dx,40) text:"833 : les Vikings suédois établissent de nouveaux comptoirs en Russie."
  from:833 till:834 shift:($dx,0) text:"834 : les Danois envahissent la [[Frise (région)|]] ~ Les Vikings suédois ([[Varangien]]) ouvre la voie commerciale vers la mer Noire par la Russie."
  from:834 till:835 shift:($dx,5) text:"835 : les Vikings danois attaquent avec succès l'Angleterre de l'Ouest. Ils s'établissent dans l'est du pays."
  from:835 till:839 shift:($dx,10) text:"839 : l'empereur byzantin fonde la [[garde varangienne]] (Une garde personnelle composée de Vikings) ~ les Vikings écrasent une révolte des Irlandais."
  from:839 till:840 shift:($dx,0) text:"840 : les Normands sont sur l'[[île de Noirmoutier]]."
  from:840 till:841 shift:($dx,20) text:"841 : premier raid sur Rouen ; les Vikings danois sont sur l'île de Walcheren à l'embouchure de l'[[Escaut]] ~ les  danois ravagent le Lindsey, l'Est-Anglie et le Kent en Angleterre."
  from:841 till:843 shift:($dx,15) text:"843 : les Normands prennent [[Nantes]] ; les Irlandais chassent les Vikings norvégiens."
  from:843 till:844 shift:(600,5) text:"<- 844 : un raid viking sur [[Séville]] en Espagne est repoussé, un autre au Maroc est victorieux."
  from:844 till:845 shift:($dx,0) text:"845 : [[Ragnar Lodbrok]] remonte la Seine jusqu'à Paris."
  from:845 till:850 shift:($dx,20) text:"850 : les Vikings s'installent aux embouchures de la Seine et de la Loire, début de la lutte entre Vikings danois et norvégiens pour le contrôle des côtes d'[[Irlande]]."
  from:850 till:851 shift:($dx,0) text:"851 : les Vikings ravagent l'[[abbaye de Fécamp]]."
  from:851 till:853 shift:($dx,0) text:"853 : fin de la guerre en Irlande. Création de nombreuses villes irlandaises, dont [[Dublin]], Cork et Limerick."
  from:853 till:856 shift:($dx,0) text:"853 -> 856 : les Vikings pillent les monastères en [[Normandie]] et l'[[Île-de-France]]. ~ Paris est attaquée deux fois."
  from:856 till:860 shift:($dx,10) text:"860 : première attaque de [[Constantinople]]."
  from:860 till:861 shift:($dx,0) text:"861 : les Danois s'emparent de [[Winchester (Angleterre)|Winchester]], la capitale du roi Aethelbert de Wessex."
  from:861 till:862 shift:($dx,0) text:"862 : les Vikings suédois s'emparent de [[Novgorod]], fondation du premier état Russe par les vikings suédois."
  from:862 till:863 shift:($dx,0) text:"863 : les Normands remontent le [[Rhin]], pillant tout sur leur passage."
  from:863 till:865 shift:($dx,0) text:"865 : l'Angleterre paie les premiers tributs aux Vikings suédois du roi [[Skoglar Toste]]"
  from:865 till:866 shift:($dx,0) text:"866 : la France paie les premiers tributs aux Vikings ; les Vikings sont battus par les Francs lors de la bataille de Brissarthe ; le roi viking Hasting se retire mais [[Robert le Fort]] est tué."
  from:866 till:869 shift:($dx,10) text:"869 : une révolte des paysans entre Seine et Loire contre les Normands est écrasée par la cavalerie franque. (à confirmer)"
  from:869 till:875 shift:($dx,25) text:"875 :  Ingolfur Arnarson fonde la ville de [[Reykjavik]], première ville d'Islande."
  from:875 till:879 shift:($dx,15) text:"879 : les Vikings suédois s'emparent de [[Kiev]]."
  from:879 till:885 shift:($dx,25) text:"885 : les Normands occupent Rouen et assiègent Paris, les Francs versent un tribut de 350 kg d'argent."
  from:885 till:886 shift:($dx,0) text:"886 : le comte Eudes, ancêtre des [[Capétiens]] résiste aux Normands à Paris."
  from:886 till:898 shift:($dx,55) text:"898 : Ottar décrit aux Anglais la voie maritime de la Norvège vers la Russie par le Cap Nord et la [[Mer blanche]]."
  from:898 till:900 shift:($dx,0) text:"900 : les Vikings danois s'établissent sur la côte de [[Neustrie]] (nord de la France), nombreux raids vikings sur la côte méditerranéenne."
| Veneux-les-Sablons | top next |

First version by ArséniureDeGallium on Thursday, June 15, 2006, last update on Friday, July 28, 2006
ImageSize  = width:250 height:200
PlotArea   = left:40 right:10 top:10 bottom:20
TimeAxis   = orientation:horizontal
AlignBars  = justify
Colors =
  id:gray1 value:gray(0.9)

DateFormat = yyyy
Period     = from:1960 till:2010
ScaleMajor = unit:year increment:10 start:1960

PlotData =
  bar:6600 color:gray1 width:1
  from:start till:end
  bar:4400 color:gray1
  from:start till:end
  bar:2200 color:gray1
  from:start till:end
  bar:0 color:gray1

LineData =
  layer:front
  points:(48,90)(84,101) color:blue  width:2 #1962 tot 1968. Inwonertal 1962: 2725 1968: 3158
  points:(84,101)(100,118)    color:blue    width:2 #1975: 3797
  points:(100,118)(128,124)   color:blue    width:2 #1982: 4051
  points:(128,124)(160,131)   color:blue    width:2 #1990: 4298
  points:(160,131)(196,139)   color:blue    width:2 #1999: 4617
  points:(196,139)(228,141)     color:blue    width:2 #2004/5
| Saint-Martin-sur-Écaillon | top next |

First version by Philip on Thursday, June 1, 2006, last update on Thursday, July 13, 2006
ImageSize  = width:250 height:200
PlotArea   = left:40 right:10 top:10 bottom:20
TimeAxis   = orientation:horizontal
AlignBars  = justify
Colors =
  id:gray1 value:gray(0.9)

DateFormat = yyyy
Period     = from:1960 till:2010
ScaleMajor = unit:year increment:10 start:1960

PlotData =
  bar:600 color:gray1 width:1
  from:start till:end
  bar:400 color:gray1
  from:start till:end
  bar:200 color:gray1
  from:start till:end
  bar:0 color:gray1


LineData =
  layer:front
  points:(48,145)(84,148) color:blue  width:2 #1962 tot 1968. Inwonertal 1962: 442 1968: 451
  points:(84,148)(100,149)    color:blue    width:2 #1975: 455
  points:(100,149)(128,152)   color:blue    width:2 #1982: 467
  points:(128,152)(160,149)   color:blue    width:2 #1990: 454
  points:(160,149)(196,140)   color:blue    width:2 #1999: 424
| Plusquellec | top next |

First version by Koro on Sunday, April 23, 2006, last update on Wednesday, July 12, 2006
ImageSize  = width:250 height:200
PlotArea   = left:40 right:10 top:10 bottom:20
TimeAxis   = orientation:horizontal
AlignBars  = justify
Colors =
  id:gray1 value:gray(0.9)

DateFormat = yyyy
Period     = from:1960 till:2010
ScaleMajor = unit:year increment:10 start:1960

PlotData =
  bar:1200 color:gray1 width:1
  from:start till:end
  bar:800 color:gray1
  from:start till:end
  bar:400 color:gray1
  from:start till:end
  bar:0 color:gray1


LineData =
  layer:front
  points:(48,148)(84,137) color:blue  width:2 #1962 tot 1968. Inwonertal 1962: 902 1968: 825
  points:(84,137)(100,119)    color:blue    width:2 #1975: 699
  points:(100,119)(128,101)   color:blue    width:2 #1982: 575
  points:(128,101)(160,98)   color:blue    width:2 #1990: 551
  points:(160,98)(196,94)   color:blue    width:2 #1999: 521
  points:(196,94)(228,91)     color:blue    width:2 #2004/5
| Template:EasyTimeline Examples AlignBars | top next |
Initial version by Erik Zachte ? on Sunday, February 27, 2005
ImageSize  = width:90 height:120
PlotArea   = width:65 height:80 left:20 bottom:20
AlignBars  = early

DateFormat = yyyy
Period     = from:1 till:5
TimeAxis   = orientation:horizontal
ScaleMajor = unit:year increment:1 start:1

PlotData=
  color:red width:10
  bar:A from:start till:end
  bar:B from:start till:end
  bar:C from:start till:end
  bar:D from:start till:end

TextData=
  pos:(20,110) fontsize:M text:Early
| Template:EasyTimeline Examples AlignBars | top next |
Initial version by Erik Zachte ? on Sunday, February 27, 2005
ImageSize  = width:90 height:120
PlotArea   = width:65 height:80 left:20 bottom:20
AlignBars  = late

DateFormat = yyyy
Period     = from:1 till:5
TimeAxis   = orientation:horizontal
ScaleMajor = unit:year increment:1 start:1

PlotData=
  color:red width:10
  bar:A from:start till:end
  bar:B from:start till:end
  bar:C from:start till:end
  bar:D from:start till:end

TextData=
  pos:(20,110) fontsize:M text:Late
| Template:EasyTimeline Examples AlignBars | top next |
Initial version by Erik Zachte ? on Sunday, February 27, 2005
ImageSize  = width:90 height:120
PlotArea   = width:65 height:80 left:20 bottom:20
AlignBars  = justify

DateFormat = yyyy
Period     = from:1 till:5
TimeAxis   = orientation:horizontal
ScaleMajor = unit:year increment:1 start:1

PlotData=
  color:red width:10
  bar:A from:start till:end
  bar:B from:start till:end
  bar:C from:start till:end
  bar:D from:start till:end

TextData=
  pos:(20,110) fontsize:M text:Justify
| Template:EasyTimeline Examples AlignBars | top next |
Initial version by Erik Zachte ? on Sunday, February 27, 2005
ImageSize  = width:90 height:120
PlotArea   = width:65 height:80 left:20 bottom:20
AlignBars  = early

DateFormat = yyyy
Period     = from:1 till:5
TimeAxis   = orientation:vertical
ScaleMajor = unit:year increment:1 start:1

PlotData=
  color:red width:10
  bar:A from:start till:end
  bar:B from:start till:end
  bar:C from:start till:end
  bar:D from:start till:end

TextData=
  pos:(20,110) fontsize:M text:Early
| Template:EasyTimeline Examples AlignBars | top next |

Initial version by Erik Zachte ? on Sunday, February 27, 2005
ImageSize  = width:90 height:120
PlotArea   = width:65 height:80 left:20 bottom:20
AlignBars  = late

DateFormat = yyyy
Period     = from:1 till:5
TimeAxis   = orientation:vertical
ScaleMajor = unit:year increment:1 start:1

PlotData=
  color:red width:10
  bar:A from:start till:end
  bar:B from:start till:end
  bar:C from:start till:end
  bar:D from:start till:end

TextData=
  pos:(20,110) fontsize:M text:Late
| Template:EasyTimeline Examples AlignBars | top next |

Initial version by Erik Zachte ? on Sunday, February 27, 2005
ImageSize  = width:90 height:120
PlotArea   = width:65 height:80 left:20 bottom:20
AlignBars  = justify

DateFormat = yyyy
Period     = from:1 till:5
TimeAxis   = orientation:vertical
ScaleMajor = unit:year increment:1 start:1

PlotData=
  color:red width:10
  bar:A from:start till:end
  bar:B from:start till:end
  bar:C from:start till:end
  bar:D from:start till:end

TextData=
  pos:(20,110) fontsize:M text:Justify
| Montmorency (commune) | top next |
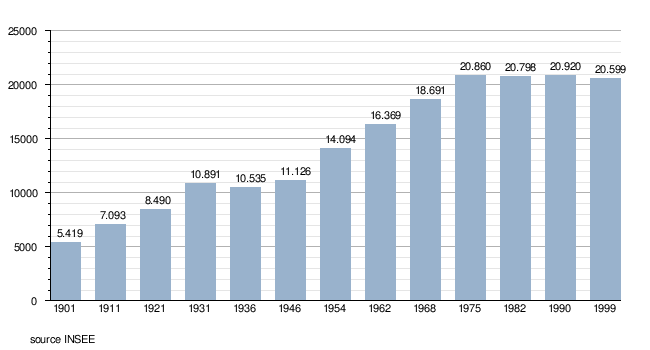
First version by Clicsouris on Sunday, July 9, 2006, last update on Wednesday, July 12, 2006
Colors=
  id:lightgrey value:gray(0.9)
  id:darkgrey  value:gray(0.7)
  id:sfondo value:rgb(1,1,1)
  id:barra value:rgb(0.6,0.7,0.8)

ImageSize  = width:650 height:350
PlotArea   = left:50 bottom:50 top:30 right:30
DateFormat = x.y
Period     = from:0 till:25000
TimeAxis   = orientation:vertical
AlignBars  = justify
ScaleMajor = gridcolor:darkgrey increment:5000 start:0
ScaleMinor = gridcolor:lightgrey increment:1000 start:0
BackgroundColors = canvas:sfondo

BarData=
  bar:1901 text:1901
  bar:1911 text:1911
  bar:1921 text:1921
  bar:1931 text:1931
  bar:1936 text:1936
  bar:1946 text:1946
  bar:1954 text:1954
  bar:1962 text:1962
  bar:1968 text:1968
  bar:1975 text:1975
  bar:1982 text:1982
  bar:1990 text:1990
  bar:1999 text:1999

PlotData=
  color:barra width:30 align:left

  bar:1901 from:0 till: 5419
  bar:1911 from:0 till: 7093
  bar:1921 from:0 till: 8490
  bar:1931 from:0 till: 10891
  bar:1936 from:0 till: 10535
  bar:1946 from:0 till: 11126
  bar:1954 from:0 till: 14094
  bar:1962 from:0 till: 16369
  bar:1968 from:0 till: 18691
  bar:1975 from:0 till: 20860
  bar:1982 from:0 till: 20798
  bar:1990 from:0 till: 20920
  bar:1999 from:0 till: 20599

PlotData=

  bar:1901 at: 5419 fontsize:S text: 5.419 shift:(-8,5)
  bar:1911 at: 7093 fontsize:S text: 7.093 shift:(-10,5)
  bar:1921 at: 8490 fontsize:S text: 8.490 shift:(-10,5)
  bar:1931 at: 10891 fontsize:S text: 10.891 shift:(-10,5)
  bar:1936 at: 10535 fontsize:S text: 10.535 shift:(-10,5)
  bar:1946 at: 11126 fontsize:S text: 11.126 shift:(-10,5)
  bar:1954 at: 14094 fontsize:S text: 14.094 shift:(-10,5)
  bar:1962 at: 16369 fontsize:S text: 16.369 shift:(-10,5)
  bar:1968 at: 18691 fontsize:S text: 18.691 shift:(-10,5)
  bar:1975 at: 20860 fontsize:S text: 20.860 shift:(-10,5)
  bar:1982 at: 20798 fontsize:S text: 20.798 shift:(-10,5)
  bar:1990 at: 20920 fontsize:S text: 20.920 shift:(-10,5)
  bar:1999 at: 20599 fontsize:S text: 20.599 shift:(-10,5)

TextData=
  fontsize:S pos:(30,20)
  text:source INSEE
| Template:Temps géologiques | top next |

First version by Gemme ? on Sunday, March 13, 2005, last update on Monday, July 3, 2006
ImageSize  = width:800 height:100
PlotArea   = left:65 right:15 bottom:20 top:5
AlignBars  = justify
Colors =
  id:periode   value:rgb(1,0.9,0.5) # light orange
  id:neogene   value:rgb(1,0.855,0)
  id:paleogene value:rgb(0.992,0.604,0.278)
  id:cretace   value:rgb(0.773,0.898,0.322)
  id:jura      value:rgb(0.886,0.957,0.878)
  id:trias     value:rgb(0.420,0.04,0.490)
  id:permien   value:rgb(0.941,0.251,0.157)
  id:carbo     value:rgb(0.404,0.671,0.627)
  id:devonien  value:rgb(0.796,0.549,0.216)
  id:silurien  value:rgb(0.702,0.949,0.816)
  id:ordo      value:rgb(0,0.573,0.439)
  id:cambrien  value:rgb(0.251,0.522,0.129)
  id:era    value:rgb(1,1,0.8)   # light yellow
  id:ceno   value:rgb(0.980,0.992,0.08)
  id:meso   value:rgb(0.404,0.776,0.792)
  id:paleo  value:rgb(0.600,0.753,0.553)
  id:phanero value:rgb(0.664,0.852,0.898)
  id:protero value:rgb(0.984,0.605,0.582)
  id:archeen   value:rgb(0.941,0.018,0.500)
  id:hadeen value:rgb(0.816,0.254,0.254)
  id:black  value:black
  id:white  value:white

Period      = from:-4567.17 till:0
TimeAxis    = orientation:horizontal
ScaleMajor  = unit:year increment:500 start:-4500
ScaleMinor  = unit:year increment:100 start:-4400
PlotData=
 align:center textcolor:black fontsize:8 mark:(line,black) width:25 shift:(0,-5)
 bar:éon color:phanero
  from:0     till:-542     text:[[Phanérozoïque]]
  from:-542   till:-2500   color:protero text:[[Protérozoïque|P R O T É R O Z O Ï Q U E]]
  from:-2500  till:-3800   color:archeen text:[[Archéen|A R C H É E N]]
  from:-3800  till:-4567.17 color:hadeen text:[[Hadéen|H A D É E N]]
 bar:ère color:era
  from:0     till:-65.5   color:ceno text:C
  from:-65.5  till:-251    color:meso text:[[Mésozoïque|Méso~zoïq]] shift:(0,1.8)
  from:-251   till:-542    color: paleo text:[[Paléozoïque|Paléo-~zoïque]] shift:(0,1.8)
  from:-542   till:-1000   text:[[Néoprotérozoïque|Néoproté-~rozoïque]] shift:(0,1.8)
  from:-1000  till:-1600   text:[[Mésoprotérozoïque|Mésoproté-~rozoïque]] shift:(0,1.8)
  from:-1600  till:-2500   text:[[Paléoprotérozoïque|Paléoprotérozoïque]]
  from:-2500  till:-2800   text:[[Néoarchéen|Néo-~archéen]] shift:(0,1.5)
  from:-2800  till:-3200   text:[[Mésoarchéen|Méso-~archéen]] shift:(0,1.5)
  from:-3200  till:-3600   text:[[Paléoarchéen|Paléo-~archéen]] shift:(0,1.5)
  from:-3600  till:-3800   text:[[Éoarchéen|Éoar-~chéen]] shift:(0,1.5)
  from:-3800  till:-4567.17
 bar:période color:periode
  from:0     till:-23.03 color:neogene
  from:-23.03 till:-65.5  color:paleogene
  from:-65.5  till:-145.5 color:cretace
  from:-145.5 till:-199.6 color:jura
  from:-199.6 till:-251   color:trias
  from:-251   till:-299   color:permien
  from:-299   till:-359.2 color:carbo
  from:-359.2 till:-416   color:devonien
  from:-416   till:-443.7 color:silurien
  from:-443.7 till:-488.3 color:ordo
  from:-488.3 till:-542   color:cambrien
  from:-542   till:-630   text:Éd
  from:-630   till:-850   text:[[Cryogénien|Cryog~énien]] shift:(0,0.5)
  from:-850   till:-1000  text:[[Tonien|Ton-~ien]] shift:(0,0.5)
  from:-1000  till:-1200  text:[[Sténien|Sté-~nien]] shift:(0,0.5)
  from:-1200  till:-1400  text:[[Ectasien|Ecta-~sien]] shift:(0,0.5)
  from:-1400  till:-1600  text:[[Calymnien|Caly-~mnien]] shift:(0,0.5)
  from:-1600  till:-1800  text:[[Stathérien|Stath~érien]] shift:(0,0.5)
  from:-1800  till:-2050  text:[[Orosirien|Orosi-~rien]] shift:(0,0.5)
  from:-2050  till:-2300  text:[[Rhyacien|Rhya-~cien]] shift:(0,0.5)
  from:-2300  till:-2500  text:[[Sidérien|Sidé-~rien]] shift:(0,0.5)
  from:-2500  till:-2800
  from:-2800  till:-3200
  from:-3200  till:-3600
  from:-3600  till:-3800
  from:-3800  till:-4567.17
| Template:Temps géologiques | top next |
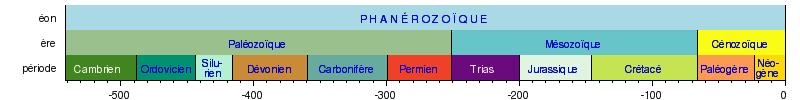
First version by Gemme ? on Sunday, March 13, 2005, last update on Monday, July 3, 2006
ImageSize  = width:800 height:100
PlotArea   = left:65 right:15 bottom:20 top:5
AlignBars  = justify
Colors =
  id:epoque  value:rgb(0.7,0.7,1) # light blue
  id:periode value:rgb(1,0.9,0.5) # light orange
  id:neogene value:rgb(1,0.855,0)
  id:paleogene value:rgb(0.992,0.604,0.322)
  id:cretace value:rgb(0.773,0.898,0.322)
  id:jura   value:rgb(0.886,0.957,0.878)
  id:trias  value:rgb(0.420,0.04,0.490)
  id:permien value:rgb(0.941,0.251,0.157)
  id:carbo  value:rgb(0.404,0.671,0.627)
  id:devonien  value:rgb(0.796,0.549,0.216)
  id:silurien  value:rgb(0.702,0.949,0.816)
  id:ordo      value:rgb(0,0.573,0.439)
  id:cambrien  value:rgb(0.251,0.522,0.129)
  id:era    value:rgb(1,1,0.8)   # light yellow
  id:eon    value:rgb(1,0.7,1)   # light purple
  id:ceno   value:rgb(0.980,0.992,0.08)
  id:meso   value:rgb(0.404,0.776,0.792)
  id:paleo  value:rgb(0.600,0.753,0.553)
  id:phanero value:rgb(0.664,0.852,0.898)
  id:filler value:gray(0.8)      # background bar
  id:black  value:black
  id:white  value:white

Period      = from:-542 till:0
TimeAxis    = orientation:horizontal
ScaleMajor  = unit:year increment:100 start:-500
ScaleMinor  = unit:year increment:10  start:-540
PlotData=
  align:center textcolor:black fontsize:8 mark:(line,black) width:25 shift:(0,-5)
 bar:éon color:phanero
  from:0     till:-542      text:"[[Phanérozoïque|P H A N É R O Z O Ï Q U E]]"
  bar:ère color:era
  from:0     till:-65.5     color:ceno text:[[Cénozoïque]]
  from:-65.5  till:-251      color:meso text:[[Mésozoïque]]
  from:-251   till:-542      color:paleo text:[[Paléozoïque]]
 bar:période color:periode fontsize:8
  from:0     till:-23.03    color:neogene text:[[Néogène|Néo-~gène]] shift:(0,1)
  from:-23.03 till:-65.5     color:paleogene text:[[Paléogène]]
  from:-65.5  till:-145.5    color:cretace text:[[Crétacé]]
  from:-145.5 till:-199.6    color:jura text:[[Jurassique]]
  from:-199.6 till:-251      color:trias textcolor:white shift:(-3,-5) text:[[Trias| ]]Trias
  from:-251   till:-299      color:permien text:[[Permien]]
  from:-299   till:-359.2    color:carbo text:[[Carbonifère]]
  from:-359.2 till:-416      color:devonien text:[[Dévonien]]
  from:-416   till:-443.7    color:silurien text:[[Silurien|Silu-~rien]] shift:(0,1)
  from:-443.7 till:-488.3    color:ordo text:[[Ordovicien]] shift:(2,-5)
  from:-488.3 till:-542      color:cambrien textcolor:white shift:(-3,-5) text:[[Cambrien| ]]Cambrien
| Template:Temps géologiques | top next |
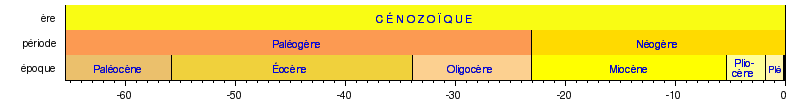
First version by Gemme ? on Sunday, March 13, 2005, last update on Monday, July 3, 2006
ImageSize = width:800 height:100
PlotArea  = left:65 right:15 bottom:20 top:5
AlignBars = justify
Colors =
  id:epoque  value:rgb(0.7,0.8,1) # light blue
  id:pleisto value:rgb(1,0.968,0.690)
  id:pliocene value:rgb(1,1,0.6)
  id:miocene value:rgb(1,1,0)
  id:oligo   value:rgb(0.992,0.816,0.565)
  id:eocene  value:rgb(0.945,0.820,0.239)
  id:paleocene value:rgb(0.922,0.753,0.427)
  id:systeme value:rgb(1,0.9,0.5) # light orange
  id:neogene value:rgb(1,0.855,0)
  id:paleogene value:rgb(0.992,0.604,0.322)
  id:era    value:rgb(1,1,0.8)   # light yellow
  id:ceno   value:rgb(0.980,0.992,0.08)
  id:black  value:black

Period     = from:-65.5 till:0
TimeAxis   = orientation:horizontal
ScaleMajor = unit:year increment:10 start:-60
ScaleMinor = unit:year increment:1  start:-65
PlotData=
  align:center textcolor:black fontsize:8 mark:(line,black) width:25 shift:(0,-5)

 bar:ère     color:era
  from:0     till:-65.5   color:ceno text:"[[Cénozoïque|C É N O Z O Ï Q U E]]"

 bar:période color:neogene
  from:0     till:-23.03  text:[[Néogène]]
  from:-23.03 till:-65.5   color:paleogene text:[[Paléogène]]

 bar:époque color:epoque
  from:0     till:-0.1     # 0.1 au lieu de 0.01 pour trait qui traduit que le pleistocene ne va pas jusqu'à 0
  from:-0.01  till:-1.806  color:pleisto text:[[Pléistocène|Plé]] fontsize:7
  from:-1.806 till:-5.332  color:pliocene text:[[Pliocène|Plio-~cène]] shift:(0,1)
  from:-5.332 till:-23.03  color:miocene text:[[Miocène]]
  from:-23.03 till:-33.9   color:oligo text:[[Oligocène]]
  from:-33.9  till:-55.8   color:eocene text:[[Éocène]]
  from:-55.8  till:-65.5   color:paleocene text:[[Paléocène]]
| Jarnac | top next |
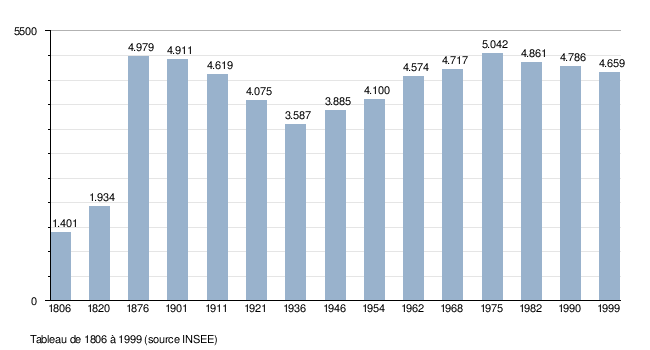
First version by Membership on Friday, July 14, 2006, last update on Monday, July 17, 2006
Colors=
  id:lightgrey value:gray(0.9)
  id:darkgrey  value:gray(0.7)
  id:sfondo value:rgb(1,1,1)
  id:barra value:rgb(0.6,0.7,0.8)

ImageSize  = width:650 height:350
PlotArea   = left:50 bottom:50 top:30 right:30
DateFormat = x.y
Period     = from:0 till:5500
TimeAxis   = orientation:vertical
AlignBars  = justify
ScaleMajor = gridcolor:darkgrey increment:5500 start:0
ScaleMinor = gridcolor:lightgrey increment:500 start:0
BackgroundColors = canvas:sfondo

BarData=
  bar:1806 text:1806
  bar:1820 text:1820
  bar:1876 text:1876
  bar:1901 text:1901
  bar:1911 text:1911
  bar:1921 text:1921
  bar:1936 text:1936
  bar:1946 text:1946
  bar:1954 text:1954
  bar:1962 text:1962
  bar:1968 text:1968
  bar:1975 text:1975
  bar:1982 text:1982
  bar:1990 text:1990
  bar:1999 text:1999

PlotData=
  color:barra width:20 align:left
  bar:1806 from:0 till: 1401
  bar:1820 from:0 till: 1934
  bar:1876 from:0 till: 4979
  bar:1901 from:0 till: 4911
  bar:1911 from:0 till: 4619
  bar:1921 from:0 till: 4075
  bar:1936 from:0 till: 3587
  bar:1946 from:0 till: 3885
  bar:1954 from:0 till: 4100
  bar:1962 from:0 till: 4574
  bar:1968 from:0 till: 4717
  bar:1975 from:0 till: 5042
  bar:1982 from:0 till: 4861
  bar:1990 from:0 till: 4786
  bar:1999 from:0 till: 4659

PlotData=
  bar:1806 at: 1401 fontsize:S text: 1.401 shift:(-8,5)
  bar:1820 at: 1934 fontsize:S text: 1.934 shift:(-10,5)
  bar:1876 at: 4979 fontsize:S text: 4.979 shift:(-10,5)
  bar:1901 at: 4911 fontsize:S text: 4.911 shift:(-10,5)
  bar:1911 at: 4619 fontsize:S text: 4.619 shift:(-10,5)
  bar:1921 at: 4075 fontsize:S text: 4.075 shift:(-10,5)
  bar:1936 at: 3587 fontsize:S text: 3.587 shift:(-10,5)
  bar:1946 at: 3885 fontsize:S text: 3.885 shift:(-10,5)
  bar:1954 at: 4100 fontsize:S text: 4.100 shift:(-10,5)
  bar:1962 at: 4574 fontsize:S text: 4.574 shift:(-10,5)
  bar:1968 at: 4717 fontsize:S text: 4.717 shift:(-10,5)
  bar:1975 at: 5042 fontsize:S text: 5.042 shift:(-10,5)
  bar:1982 at: 4861 fontsize:S text: 4.861 shift:(-10,5)
  bar:1990 at: 4786 fontsize:S text: 4.786 shift:(-10,5)
  bar:1999 at: 4659 fontsize:S text: 4.659 shift:(-10,5)

TextData=
  fontsize:S pos:(30,20)
  text:Tableau de 1806 à 1999 (source INSEE)
| Lecco | top next |

Initial version by GôTô on Tuesday, April 18, 2006
Colors=
  id:lightgrey value:gray(0.9)
  id:darkgrey  value:gray(0.7)
  id:sfondo value:rgb(1,1,1)
  id:barra value:rgb(0.6,0.7,0.8)

ImageSize  = width:455 height:373
PlotArea   = left:50 bottom:50 top:30 right:30
DateFormat = x.y
Period     = from:0 till:55000
TimeAxis   = orientation:vertical
AlignBars  = justify
ScaleMajor = gridcolor:darkgrey increment:5000 start:0
ScaleMinor = gridcolor:lightgrey increment:1000 start:0
BackgroundColors = canvas:sfondo

BarData=
  bar:1861 text:1861
  bar:1871 text:1871
  bar:1881 text:1881
  bar:1901 text:1901
  bar:1911 text:1911
  bar:1921 text:1921
  bar:1931 text:1931
  bar:1936 text:1936
  bar:1951 text:1951
  bar:1961 text:1961
  bar:1971 text:1971
  bar:1981 text:1981
  bar:1991 text:1991
  bar:2001 text:2001

PlotData=
  color:barra width:20 align:left

  bar:1861 from:0 till: 16224
  bar:1871 from:0 till: 18083
  bar:1881 from:0 till: 19964
  bar:1901 from:0 till: 25191
  bar:1911 from:0 till: 30020
  bar:1921 from:0 till: 31044
  bar:1931 from:0 till: 33557
  bar:1936 from:0 till: 36973
  bar:1951 from:0 till: 42454
  bar:1961 from:0 till: 48230
  bar:1971 from:0 till: 53230
  bar:1981 from:0 till: 51377
  bar:1991 from:0 till: 45872
  bar:2001 from:0 till: 45501

PlotData=

  bar:1861 at: 16224 fontsize:S text: 16.224 shift:(-8,5)
  bar:1871 at: 18083 fontsize:S text: 18.083 shift:(-10,5)
  bar:1881 at: 19964 fontsize:S text: 19.964 shift:(-10,5)
  bar:1901 at: 25191 fontsize:S text: 25.191 shift:(-10,5)
  bar:1911 at: 30020 fontsize:S text: 30.020 shift:(-10,5)
  bar:1921 at: 31044 fontsize:S text: 31.044 shift:(-10,5)
  bar:1931 at: 33557 fontsize:S text: 33.557 shift:(-10,5)
  bar:1936 at: 36973 fontsize:S text: 36.973 shift:(-10,5)
  bar:1951 at: 42454 fontsize:S text: 42.454 shift:(-10,5)
  bar:1961 at: 48230 fontsize:S text: 48.230 shift:(-10,5)
  bar:1971 at: 53230 fontsize:S text: 53.230 shift:(-10,5)
  bar:1981 at: 51377 fontsize:S text: 51.377 shift:(-10,5)
  bar:1991 at: 45872 fontsize:S text: 45.872 shift:(-10,5)
  bar:2001 at: 45501 fontsize:S text: 45.501 shift:(-10,5)

TextData=
  fontsize:S pos:(20,20)
  text:source ISTAT - mise en graphique par Wikipédia
| Barraux | top next |

Initial version by Chris5897 on Friday, July 28, 2006
ImageSize  = width:250 height:200
PlotArea   = left:40 right:10 top:10 bottom:20
TimeAxis   = orientation:horizontal
AlignBars  = justify
Colors =
  id:gray1 value:gray(0.9)

DateFormat = yyyy
Period     = from:1960 till:2010
ScaleMajor = unit:year increment:10 start:1960

PlotData =
  bar:2100 color:gray1 width:1
  from:start till:end
  bar:1400 color:gray1
  from:start till:end
  bar:700 color:gray1
  from:start till:end
  bar:0 color:gray1


LineData =
  layer:front
  points:(48,85)(84,85) color:blue  width:2 #1962 tot 1968. Inwonertal 1962: 800 1968: 800
  points:(84,85)(100,91)    color:blue    width:2 #1975: 871
  points:(100,91)(128,96)   color:blue    width:2 #1982: 939
  points:(128,96)(160,118)   color:blue    width:2 #1990: 1214
  points:(160,118)(196,139)   color:blue    width:2 #1999: 1474
  points:(196,139)(228,159)     color:blue    width:2 #2004/5
| Template:Chronologie présidents Galice | top next |
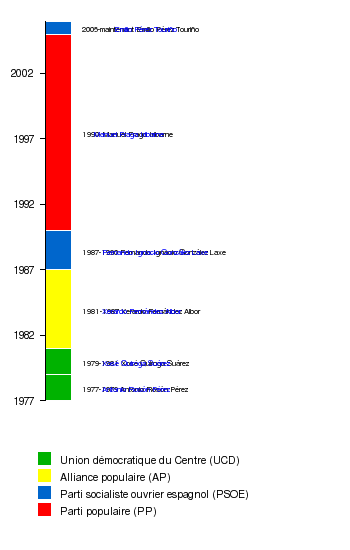
First version by Alyssalover on Saturday, April 9, 2005, last update on Friday, March 10, 2006
ImageSize = width:350 height:550
PlotArea  = left:45 right:0 bottom:150 top:20
Legend    = columns:1 left:40 top:100
AlignBars = early

DateFormat = yyyy
Period     = from:1977 till:2006
TimeAxis   = orientation:vertical
ScaleMajor = unit:year increment:5 start:1977

Colors=

  id:UCD   value:green            legend:Union_démocratique_du_Centre_(UCD)
  id:AP    value:yellow           legend:Alliance_populaire_(AP)
  id:PSOE  value:blue             legend:Parti_socialiste_ouvrier_espagnol_(PSOE)
  id:PP    value:red              legend:Parti_populaire_(PP)

PlotData=
  bar:Leaders width:25 mark:(line,white) align:left fontsize:XS shift:(25,-5) anchor:middle

  from:start till:1979 color:UCD   text:"1977-1979_[[Antonio_Ros%C3%B3n_P%C3%A9rez|Antonio Rosón Pérez]]"
  from:1979  till:1981 color:UCD   text:"1979-1981_[[Xos%C3%A9_Quiroga_Su%C3%A1rez|Xosé Quiroga Suárez]]"
  from:1981  till:1987 color:AP    text:"1981-1987_[[Xerardo_Fern%C3%A1ndez_Albor|Xerardo Fernández Albor]]"
  from:1987  till:1990 color:PSOE  text:"1987-1990_[[Fernando_Ignacio_Gonz%C3%A1lez_Laxe|Fernando Ignacio González Laxe]]"
  from:1990  till:2005 color:PP     text:"1990-_[[Manuel_Fraga_Iribarne]]"
  from:2005  till:end color:PSOE  text:"2005-maintenant_[[Emilio_P%C3%A9rez_Touri%C3%B1o|Emilio Pérez Touriño]]"
| Labarthe-sur-Lèze | top next |

First version by Hbbk on Thursday, June 8, 2006, last update on Thursday, July 13, 2006
ImageSize  = width:250 height:200
PlotArea   = left:40 right:10 top:10 bottom:20
TimeAxis   = orientation:horizontal
AlignBars  = justify
Colors =
  id:gray1 value:gray(0.9)

DateFormat = yyyy
Period     = from:1960 till:2010
ScaleMajor = unit:year increment:10 start:1960

PlotData =
  bar:6600 color:gray1 width:1
  from:start till:end
  bar:4400 color:gray1
  from:start till:end
  bar:2200 color:gray1
  from:start till:end
  bar:0 color:gray1


LineData =
  layer:front
  points:(48,33)(84,41) color:blue  width:2 #1962 tot 1968. Inwonertal 1962: 518 1968: 810
  points:(84,41)(100,63)    color:blue    width:2 #1975: 1672
  points:(100,63)(128,74)   color:blue    width:2 #1982: 2110
  points:(128,74)(160,117)   color:blue    width:2 #1990: 3772
  points:(160,117)(196,139)   color:blue    width:2 #1999: 4632
| Berrwiller | top next |

First version by Dr gonzo on Friday, June 2, 2006, last update on Wednesday, July 12, 2006
ImageSize  = width:250 height:200
PlotArea   = left:40 right:10 top:10 bottom:20
TimeAxis   = orientation:horizontal
AlignBars  = justify
Colors =
  id:gray1 value:gray(0.9)

DateFormat = yyyy
Period     = from:1960 till:2010
ScaleMajor = unit:year increment:10 start:1960

PlotData =
  bar:1500 color:gray1 width:1
  from:start till:end
  bar:1000 color:gray1
  from:start till:end
  bar:500 color:gray1
  from:start till:end
  bar:0 color:gray1


LineData =
  layer:front
  points:(48,96)(84,101) color:blue  width:2 #1962 tot 1968. Inwonertal 1962: 671 1968: 719
  points:(84,101)(100,110)    color:blue    width:2 #1975: 797
  points:(100,110)(128,119)   color:blue    width:2 #1982: 870
  points:(128,119)(160,123)   color:blue    width:2 #1990: 912
  points:(160,123)(196,140)   color:blue    width:2 #1999: 1058
| Template:La trilogie de Mars | top next |

First version by VIGNERON on Saturday, July 2, 2005, last update on Tuesday, May 9, 2006
DateFormat = yyyy
ImageSize  = width:800 height:auto barincrement:30
PlotArea   = left:20 right:20 bottom:30 top:15

Colors     =
  id:gris     value:gray(0.7)
  id:grisf    value:gray(0.5)
  id:grisc    value:gray(0.8)
  id:rouge    value:rgb(1,0.3,0.5)
  id:rougef   value:rgb(1,0,0)
  id:vert     value:rgb(0.5,0.8,0.5)
  id:vertf    value:rgb(0.1,0.5,0.1)
  id:bleu     value:rgb(0.3,0.5,1)
  id:orange   value:rgb(1,0.6,0)
  id:orangef  value:rgb(1,0.5,0.3)

Period = from:2026 till:2212
TimeAxis   = orientation:horizontal format:yyyy
ScaleMajor = unit:year  increment:100 start:2100 gridcolor:black
ScaleMinor = unit:year  increment:10 start:2030 gridcolor:gris
AlignBars  = justify

BarData=
  bar:Timeperiod
  barset:premier
  bar:Arkady
  bar:Simon
  bar:Nadia
  bar:Ann
  bar:Sax
  bar:Roko
  barset:fond
  barset:evmnt
  bar:ascenseur

PlotData =
  width:25 fontsize:S textcolor:black align:center

  bar:Timeperiod color:gris shift:(2)
  from:start till:end color:gris

  from:start till:2061 text:Mars_la_Rouge color:rouge fontsize:L
  from:2061 till:2127 text:Mars_la_Verte color:vert fontsize:L
  from:2127 till:end text:Mars_la_Bleue color:bleu fontsize:L

  barset:premier
  from:start till:2035 text:Tatiana_Durova  shift:(50,0)
  from:start till:2050 text:John_Boone color:grisc
  from:start till:2061 text:Frank_Chalmers
  from:start till:2061 text:Sacha_Yefremov color:grisc

  bar:Arkady
  from:start till:2061 text:Arkady_Bogdanov color:grisc
  from:2028 till:2029 text:~sur_Phobos

  bar:Simon
  from:start till:2080 text:~Simon_Frazier color:grisc shift:50
  from:2027  till:2027 text:Pôle_nord align:left color:black
  from:2080  till:2080 text:~[[Leucémie]] color:black

  bar:Nadia
  from:start till:2128  text:Nadia_Chernechvski color:grisc
  from:2027  till:2027 text:Pôle_nord align:left color:black
  from:2050  till:2050 text:~Nicosia align:left color:black
  from:2128  till:2134 text:~Présidence color:gris
  from:2134  till:end  color:grisc
  from:2211 till:2211 align:left text:Réunion_d'Underhill align:right

  bar:Ann
  from:start till:end  text:Ann_Clayborne color:orangef
  from:2027  till:2027 text:Pôle_nord align:left color:black
  from:2180  till:2181  text:~visite_de_Jupiter_et_Uranus color:Rougef
  from:2211 till:2211 align:left text:Réunion_d'Underhill align:right

  bar:Sax
  from:start till:end text:Sax_Russel color:vert
  from:2050  till:2050 text:~Nicosia align:left color:black
  from:2106  till:2106 text:2106_Destruction_de_la_loupe_aérienne align:right color:vertf
  from:2108  till:2108 text:~[[Déimos_(lune)|2106_Ejection_de_Déimos]] align:right color:vertf
  from:2211 till:2211 align:left text:Réunion_d'Underhill align:right

  bar:Roko
  from:start till:2120 text:Hiroko_Ai color:vertf
  from:2120  till:2120 text:~Prise_de_Sabiishi
  from:2120  till:end text:? color:vert

  barset:fond
  from:start till:2202 text:Phyllis Boyle

  from:start till:end  text:Maya_Toitovna
  from:start till:2206 color:grisc text:Michel Duval
  from:2048 till:end text:Peter_Clayborne
  from:2085 till:end text:Art_Randolph color:grisc
  from:2075  till:end  text:Jackie
  from:2075  till:end  text:Dao,_Tiu... color:grisc
  from:2076  till:end  text:Nirgal
  from:2129  till:2200 text:Zo_Boone color:grisc

  barset:evmnt

  from:2102 till:2102 text:M-38 color:orange align:left
  from:2123 till:2123 text:M-50 align:left

  from:2061 till:2061 text:2061_Révolution align:left color:black
  from:2104 till:2104 text:2104_Conférence_de_Dorsia_Brevia align:left
  from:2127 till:2127 text:[[Antarctique|Incident_de_l'Antarctique]] align:right
  from:2128 till:2129 text:2128_Congrès_constitutionnel align:left
  from:2040 till:end  text:Émergence_des_transnationales

  barset:break
  from:2160 till:2160 align:left  text:Premiers voyages spatiaux
  from:2181 till:2181 align:left text:Campagne électorale
  from:2190 till:end  text:Immigration_illégale color: grisc shift:(-30,0)

  bar:ascenseur
  from:2100 till:2127 text:2ème_ascenseur

LineData=
  at:2061 color:grisf
  at:2127 color:grisf
  at:2102 color:orange
  at:2123
| Méréville (Meurthe-et-Moselle) | top next |

First version by 194.214.217.17 on Tuesday, July 4, 2006, last update on Thursday, July 13, 2006
ImageSize  = width:250 height:200
PlotArea   = left:40 right:10 top:10 bottom:20
TimeAxis   = orientation:horizontal
AlignBars  = justify
Colors =
  id:gray1 value:gray(0.9)

DateFormat = yyyy
Period     = from:1960 till:2010
ScaleMajor = unit:year increment:10 start:1960

PlotData =
  bar:1800 color:gray1 width:1
  from:start till:end
  bar:1200 color:gray1
  from:start till:end
  bar:600 color:gray1
  from:start till:end
  bar:0 color:gray1


LineData =
  layer:front
  points:(48,46)(84,45) color:blue  width:2 #1962 tot 1968. Inwonertal 1962: 275 1968: 263
  points:(84,45)(100,78)    color:blue    width:2 #1975: 617
  points:(100,78)(128,124)   color:blue    width:2 #1982: 1101
  points:(128,124)(160,142)   color:blue    width:2 #1990: 1289
  points:(160,142)(196,147)   color:blue    width:2 #1999: 1349
  points:(196,147)(228,153)     color:blue    width:2 #2004/5
| Saint-Étienne-de-Tinée | top next |

First version by Geoffrey06 on Tuesday, April 4, 2006, last update on Friday, July 14, 2006
ImageSize  = width:250 height:200
PlotArea   = left:40 right:10 top:10 bottom:20
TimeAxis   = orientation:horizontal
AlignBars  = justify
Colors =
  id:gray1 value:gray(0.9)

DateFormat = yyyy
Period     = from:1960 till:2010
ScaleMajor = unit:year increment:10 start:1960

PlotData =
  bar:2400 color:gray1 width:1
  from:start till:end
  bar:1600 color:gray1
  from:start till:end
  bar:800 color:gray1
  from:start till:end
  bar:0 color:gray1


LineData =
  layer:front
  points:(48,127)(84,130) color:blue  width:2 #1962 tot 1968. Inwonertal 1962: 1505 1968: 1549
  points:(84,130)(100,140)    color:blue    width:2 #1975: 1700
  points:(100,140)(128,146)   color:blue    width:2 #1982: 1780
  points:(128,146)(160,146)   color:blue    width:2 #1990: 1783
  points:(160,146)(196,128)   color:blue    width:2 #1999: 1528
| Armelle | top next |
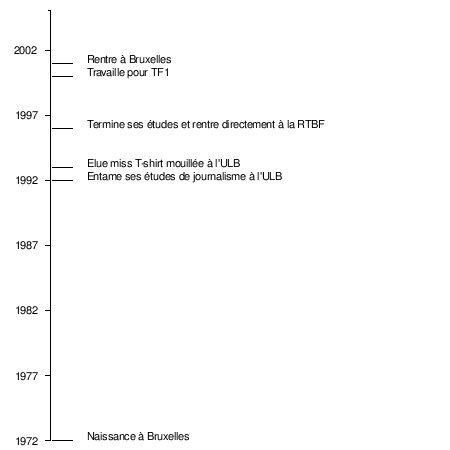
Initial version by 80.201.88.242 on Tuesday, July 12, 2005
ImageSize  = width:450 height:450
PlotArea   = left:50 right:0 bottom:10 top:10

DateFormat = yyyy
Period     = from:1972 till:2005
TimeAxis   = orientation:vertical
ScaleMajor = unit:year increment:5 start:1972
ScaleMinor = unit:year increment:1 start:2005

PlotData=
  color:red mark:(line,black) align:left fontsize:S
  shift:(25,0) # shift text to right side of bar

  # there is no automatic collision detection, fontsize:XS
  # so shift texts up or down manually to avoid overlap shift:(25,-10)

  at:1972             text:Naissance à Bruxelles
  at:1992             text:Entame ses études de journalisme à l'ULB
  at:1993             text:Elue miss T-shirt mouillée à l'ULB
  at:1996             text:Termine ses études et rentre directement à la RTBF
  at:2000             text:Travaille pour TF1
  at:2001             text:Rentre à Bruxelles
| Civilisation précolombienne | top next |

First version by El Comandante on Monday, June 5, 2006, last update on Sunday, June 11, 2006
DateFormat = yyyy
ImageSize  = width:650 height:auto barincrement:12
PlotArea   = left:20 right:20 bottom:20 top:10
Colors     =
  id:blanc             value:rgb(1,1,1)
  id:noir              value:black
  id:canvas            value:gray(0.98)
  id:grilleMajor       value:gray(0.7)
  id:grilleMinor       value:gray(0.9)
  id:evenement         value:gray(0.5)
  id:grisclair         value:gray(0.85)
  id:gris              value:gray(0.75)
  id:grisfonce         value:gray(0.6)
  id:grissombre        value:gray(0.5)
  id:or                value:rgb(1,0.9,0)
  id:orangeclair       value:rgb(1,0.8,0.6)
  id:orange            value:rgb(1,0.75,0.3)
  id:orangesom         value:rgb(0.9,0.55,0.35)
  id:rouge             value:rgb(0.8,0.4,0.3)
  id:rougemoy          value:rgb(0.75,0.3,0.2)
  id:rougefonce        value:rgb(0.7,0.25,0.15)
  id:vertclair         value:rgb(0.64,0.92,0.64)
  id:vertmoy           value:rgb(0.45,0.88,0.45)
  id:vert              value:rgb(0.30,0.8,0.30)
  id:vertfonce         value:rgb(0.2,0.5,0.4)
  id:bleufonce         value:rgb(0.2,0.4,0.6)
  id:bleu              value:rgb(0.3,0.5,0.8)
  id:bleuclair         value:rgb(0.65,0.65,0.90)
  id:violet            value:rgb(0.7,0.45,0.9)
  id:violetfonce       value:rgb(0.65,0.35,0.6)
  id:violetsombre      value:rgb(0.55,0.3,0.5)

Period     = from:-1200 till:1700
TimeAxis   = orientation:horizontal format:yyyy
AlignBars  = justify
ScaleMinor = unit:year increment:50 start:-1200 gridcolor:grilleMinor
ScaleMajor = unit:year increment:200 start:-1200 gridcolor:grilleMajor
BackgroundColors = canvas:canvas bars:canvas
BarData=
 bar:Hopewells
   bar:espace1
 bar:Mogollon
   bar:espace2
 bar:Anasazi
   bar:espace3
 bar:Hohokam
   bar:espace4
 bar:Olmèques
   bar:espace5
 bar:Mayas
   bar:espace6
 bar:Zapotèques
   bar:espace7
 bar:Teotihuacán
   bar:espace8
 bar:Toltèques
   bar:espace9
 bar:Aztèques
   bar:espace10
 bar:Chavín
   bar:espace11
 bar:Paracas
   bar:espace12
 bar:Moches
   bar:espace13
 bar:Nazcas
   bar:espace14
 bar:Huaris
   bar:espace15
 bar:Tiahuanacos
   bar:espace16
 bar:Sicán
   bar:espace17
 bar:Chimús
   bar:espace18
 bar:Incas
   bar:espace19
 bar:Chibchas
   bar:espace20

Define $left   = anchor:from align:left  shift:( 4,-4)

#LineData=
  # 1er concile
#  at:-500 color:grilleMajor
  # 2d concile
#  at:-383 color:grilleMajor
  # Pāṭaliputra
#  at:-250 color:grilleMajor
  # premiers écris
  #at:-110 color:grilleMajor

PlotData=
# CIVILISATIONS

 bar:Hopewells width:15
   from:-200 till:400 color:grisclair text:"[[Hopewells]]" $left

 bar:Mogollon width:15
   from:500 till:1350 color:gris text:"[[Mogollon]]" $left

 bar:Anasazi width:15
   from:700 till:1350 color:grisfonce text:"[[Anasazi]]" $left

 bar:Hohokam width:15
   from:-200 till:1450 color:grissombre text:"[[Hohokam]]" $left

 bar:Olmèques width:15
   from:-1200 till:-500 color:or text:"[[Olmèques]]" $left

 bar:Mayas width:15
   from:-1000 till:1697  color:orange text:"[[Civilisation maya|Mayas]]" $left
   from:250 till:900 color:orangeclair text:"Période classique" $left

 bar:Zapotèques width:15
   from:-500 till:700  color:orangesom text:"[[Zapotèques]]"  $left

 bar:Teotihuacán width:15
   from:-100 till:700  color:rouge text:"[[Teotihuacán]]" $left

 bar:Toltèques width:15
   from:900 till:1200 color:rougemoy text:"[[Toltèques]]" $left

 bar:Aztèques width:15
   from:1300 till:1519 color:rougefonce text:"[[Aztèques]]" $left

 bar:Chavín width:15
   from:-800 till:-200 color:vertclair text:"[[Chavín]]" $left

 bar:Paracas width:15
   from:-800 till:200 color:vertmoy text:"[[Paracas]]" $left

 bar:Moches width:15
   from:100 till:700 color:vert text:"[[Moches]]" $left

 bar:Nazcas width:15
   from:-300 till:800 color:vertfonce text:"[[Nazcas]]" $left

 bar:Huaris width:15
   from:500 till:800 color:bleufonce text:"[[Huaris]]" $left

 bar:Tiahuanacos width:15
   from:-500 till:1000 color:bleu text:"[[Tiahuanacos]]" $left

 bar:Sicán width:15
   from:700 till:1300 color:bleuclair text:"[[Sicán]]" $left

 bar:Chimús width:15
   from:1000 till:1460 color:violet text:"[[Chimús]]" $left

 bar:Incas width:15
   from:1300 till:1533 color:violetfonce text:"[[Incas]]" $left

 bar:Chibchas width:15
   from:-500 till:1539 color:violetsombre text:"[[Chibchas]]" $left
| Histoire de l'Égypte antique | top next |

First version by Dom on Saturday, April 29, 2006, last update on Tuesday, June 6, 2006
# définition de la taille de la frise
ImageSize  = width:800 height:600 # taille totale largeur, hauteur
PlotArea   = width:80% height:70% left:10% bottom:20% # taille réelle de la frise
DateFormat = yyyy # format de la date
Period     = from:-3200 till:-30 # période
TimeAxis   = orientation:horizontal # orientation (« vertical » ou « horizontal »)
ScaleMajor = unit:year increment:500 start:-3200 # incrément temporel

# définition d'une variable à titre d'exemple
Define $dy = 40
Define $haut = 80
Define $moyen= 60
Define $bas  = 40

Colors =
   id:Hyksôs        value:black      legend:Hyksôs
   id:perse         value:green      legend:Perse
   id:macédonienne  value:blue       legend:Macédonienne
   id:gris          value:gray(0.7)
BarData=
  bar:titrePériode
  barset:Périodes

  bar:titreEvènements
  bar:Evènements

  bar:titreOccupations
  bar:Occupations
PlotData=

# définition de la première barre
  bar:titrePériode color:gris width:20 align:center fontsize:S
  from:start  till:end text:"Périodes"

  barset:Périodes color:red width:25 mark:(line,white) align:center fontsize:S
# bar:Périodes color:red width:25 mark:(line,white) align:left fontsize:S

# informations temporelles (cf. explications sur les commandes)

 from:start  till:-2920 text:[[période prédynastique|prédynastique]]
 from:-2920  till:-2700 text:[[époque thinite|thinite]]
 from:-2700  till:-2200 text:[[Ancien Empire égyptien|Ancien Empire]]
 from:-2200  till:-2022 text:[[Première période intermédiaire égyptienne|{{Ire}} période intermédiaire]]
 from:-2022  till:-1650 text:[[Moyen Empire égyptien|Moyen Empire]]
 from:-1650  till:-1539 text:[Deuxième période intermédiaire égyptienne|{{IIe}} période intermédiaire]] #fontsize:XS
 from:-1539  till:-1070 text:[[Nouvel Empire égyptien|Nouvel Empire]]
 from:-1070  till:-715  text:[[Troisième période intermédiaire égyptienne|{{IIIe}} période intermédiaire]]
 from:-715  till:-30  text:[[Basse époque égyptienne|Basse époque]]

# définition de la deuxième barre, 15 pixels, bleu
  bar:titreEvènements color:gris width:20 align:center fontsize:S
    from:start  till:end text:"Évènements"

  bar:Evènements color:red width:15 mark:(line,white)  shift:(2,0) fontsize:S
    from:-2700 till:-2450 text:[[Pyramides d'Égypte|Pyramides]]
    from:-1290 till:-1310 text:[[Temple de Louxor]]

# définition de la troisième barre, 15 pixels, bleu
  bar:titreOccupations color:gris width:20 align:center fontsize:S
    from:start  till:end text:"Occupations"

  bar:Occupations
    color:Hyksôs        from:-1674 till:-1539
    color:perse         from:-525 till:-404
    color:perse         from:-341 till:-332
    color:macédonienne  from:-332 till:-305

Legend = orientation:horizontal position:bottom
| Template:Chronologie comparative Europe 1745-1940 | top next |

First version by Witoki on Friday, August 19, 2005, last update on Thursday, September 22, 2005
#Fait par Witoki sur la base des articles
#correspondant. N'hésitez pas à me poser
#vos questions sur ma page de discussion!

ImageSize  = width:1000 height:800
PlotArea   = width:900  height:700 left:50 bottom:70
Legend    = columns:4 left:250 top:50 columnwidth:160

DateFormat = yyyy
Period     = from:1745 till:1940
TimeAxis   = orientation:vertical
ScaleMajor = unit:year increment:10 start:1750

# there is no automatic collision detection,
# so shift texts up or down manually to avoid overlap

Colors=
  id:Mon  value:gray(0.9) legend:Monarchie
  id:Emp  value:purple    legend:Empire
  id:Tra  value:red       legend:Période_de_transition
  id:Rep  value:blue      legend:République
  id:Fas  value:black     legend:Régime_fasciste
  id:Soc  value:rgb(0.8,0.5,0.5)  legend:République_socialiste
  id:War  value:gray(0.5)

Define $dx = 25 # shift text to right side of bar
Define $dy = -4 # adjust height

PlotData=


  bar:Allemagne/Prusse width:25 mark:(line,white) align:left fontsize:S

  from:1745  till:1806 shift:($dx,$dy)    color:Emp    text:Saint Empire rom. germ.
  from:1806  till:1871 shift:($dx,$dy)    color:Mon    text:[[Royaume de Prusse]]
  from:1871  till:1918 shift:($dx,$dy)    color:Emp    text:[[Empire allemand]]
  from:1918  till:1934 shift:($dx,$dy)    color:Rep    text:[[République de Weimar]]
  from:1934  till:1940 shift:($dx,$dy)    color:Fas    text:[[Troisième Reich]]

  width:33  shift:(25,-5) align:left color:War fontsize:S
  from:1914  till:1918 text:"Prem. guerre mondiale" textcolor:War

  bar:Autriche width:25 mark:(line,white) align:left fontsize:7

  from:1745  till:1806 shift:($dx,-2)     color:Emp    text:Saint Empire rom. germ.
  from:1806  till:1867 shift:($dx,$dy)    color:Emp    text:Empire d'Aut. (Habsb.)
  from:1867  till:1918 shift:($dx,$dy)    color:Mon    text:[[Autriche-Hongrie]]
  from:1918  till:1933 shift:($dx,$dy)    color:Rep    text:Première_République
  from:1933  till:1940 shift:($dx,$dy)    color:Fas    text:Austrofasc.,_3e_Reich

  width:33  shift:(25,-5) align:left color:War fontsize:S
  from:1914  till:1918 text:"Prem. guerre mondiale" textcolor:War

  bar:France width:25 mark:(line,white) align:left fontsize:7

  from:1745  till:1792 shift:($dx,-2)     color:Mon    text:[[Ancien Régime]]_(Bourb.)
  from:1792  till:1804 shift:($dx,$dy)    color:Tra    text:Conv.-Direct.-Consulat
  from:1804  till:1814 shift:($dx,$dy)    color:Emp    text:[[Premier_Empire]]
  from:1814  till:1848 shift:($dx,$dy)    color:Mon    text:[[Restauration]]s
  from:1848  till:1852 shift:($dx,$dy)    color:Rep    text:[[Deuxième République (France)|Deuxième_République]]
  from:1852  till:1870 shift:($dx,$dy)    color:Emp    text:[[Second_Empire]]
  from:1870  till:1940 shift:($dx,$dy)    color:Rep    text:[[Troisième_République]]

  width:33  shift:(25,-5) align:left color:War fontsize:S
  from:1914  till:1918 text:"Prem. guerre mondiale" textcolor:War

  bar:Russie width:25 mark:(line,white) align:left fontsize:7

  from:1745  till:1917 shift:($dx,-2)     color:Emp    text:Empire tsar._([[Romanov]])
  from:1917  till:1922 shift:($dx,$dy)    color:Tra    text:[[Révolution]]_&_troubles
  from:1922  till:1940 shift:($dx,$dy)    color:Soc    text:[[URSS]]

  width:33  shift:(25,-5) align:left color:War fontsize:S
  from:1914  till:1918 text:"Prem. guerre mondiale" textcolor:War

  bar:Royaume-Uni width:25 mark:(line,white) align:left fontsize:7

  from:1745  till:1901 shift:($dx,$dy)    color:Mon    text:[[Monarchie]]_(Hanovre)
  from:1901  till:1917 shift:($dx,$dy)    color:Mon    text:[[Monarchie]]_(Saxe-Coburg-Gotha)
  from:1917  till:1940 shift:($dx,$dy)    color:Mon    text:[[Monarchie]]_(Windsor)

  width:33  shift:(25,-5) align:left color:War fontsize:S
  from:1914  till:1918 text:"Prem. guerre mondiale" textcolor:War
| Dynastie théodosienne | top next |

First version by Neuceu ? on Monday, August 22, 2005, last update on Tuesday, July 25, 2006
ImageSize  = width:1000 height:80
PlotArea   = width:980 height:60 left:10 bottom:20

Period      = from:370 till:460
TimeAxis    = orientation:horizontal
ScaleMajor  = unit:year increment:10 start:370
ScaleMinor  = unit:year increment:5 start:370

Colors =
    id:yellow    value:rgb(0.7,0.7,1) # light yellow
    id:red       value:rgb(1,0.7,0.7) # light red
    id:green     value:rgb(0.7,1,0.7) # light green
    id:blue      value:rgb(1,1,0.7)   # light blue
    id:cyan      value:rgb(0.7,1,1)   # light blue
    id:purple    value:rgb(1,0.7,1)   # light purple
    id:grey      value:gray(0.8)      # grey

PlotData=
  align:center textcolor:black fontsize:8 mark:(line,black) width:25 shift:(0,-5)

  from:  379   till:  395  color:red     text:[[Théodose Ier]]
  from:    395   till:  423  color:green   text:[[Honorius]]
  from:    423   till:  425  color:blue   text:[[Jean (usurpateur)|Jean]]
  from:    425   till:  455  color:cyan   text:[[Valentinien III]]
| Dynastie théodosienne | top next |

First version by Neuceu ? on Monday, August 22, 2005, last update on Tuesday, July 25, 2006
ImageSize  = width:1000 height:80
PlotArea   = width:980 height:60 left:10 bottom:20

Period      = from:370 till:520
TimeAxis    = orientation:horizontal
ScaleMajor  = unit:year increment:10 start:370
ScaleMinor  = unit:year increment:5 start:370

Colors =
    id:yellow    value:rgb(0.7,0.7,1) # light yellow
    id:red       value:rgb(1,0.7,0.7) # light red
    id:green     value:rgb(0.7,1,0.7) # light green
    id:blue      value:rgb(1,1,0.7)   # light blue
    id:cyan      value:rgb(0.7,1,1)   # light blue
    id:purple    value:rgb(1,0.7,1)   # light purple
    id:grey      value:gray(0.8)      # grey

PlotData=
  align:center textcolor:black fontsize:8 mark:(line,black) width:25 shift:(0,-5)

  from:    379   till:  395  color:red     text:[[Théodose Ier]]
  from:    395   till:  408  color:green   text:[[Arcadius]]
  from:    408   till:  450  color:blue   text:[[Théodose II]]
  from:    450   till:  457  color:cyan   text:[[Marcien]]
  from:    457   till:  474  color:purple   text:[[Léon Ier (empereur byzantin)|Léon Ier]]
  from:    474   till:  474  color:grey   shift:(0,5) text:[[Léon II (empereur byzantin)|Léon II]]
  from:    474   till:  491  color:yellow   text:[[Zénon Ier]]
  from:    491   till:  518  color:red   text:[[Anastase Ier (empereur byzantin)|Anastase Ier]]
| Template:Niveau de la mer | top next |

First version by VIGNERON on Wednesday, August 24, 2005, last update on Monday, November 21, 2005
ImageSize  = width:800 height:800
PlotArea   = left:0 right:0 bottom:60 top:10
AlignBars  = justify

DateFormat = yyyy
Period     = from:-28000 till:-5300
TimeAxis   = orientation:vertical

Colors=
  id:g8 value:gray(0.8)
  id:g5 value:gray(0.5)


Define $l = align:right shift:(-16,0)
Define $r = align:left  shift:(16,0)

PlotData=

  from:start till:end color:g8

  at:-28000 $l text:-28 000 le niveau de la mer~se trouve environ 40 m plus haut qu'aujourd'hui

  at:-25000 $r text:-25 000 extension maximale des [[Calotte polaire|calottes glaciaires]]

  at:-21000 $l text:-21 000 climat froid et sec.~Température moyenne inférieure de 4 à 5°C à celle~d'aujourd'hui.Baisse du niveau de la mer de 110 m.

  at:-15000 $l text:-15000 la [[Manche (mer)|Manche]] et la [[mer du Nord]] n'existent pas,~la [[mer Noire]] est un lac d'eau douce~qui ne communique pas avec la [[Méditerranée]].

  from:-14500 till:-9300 $l color:g5 text:de-14 500 à -9 300 réchauffement climatique général

  at:-13500 $r text:-13500 continuation du réchauffement.~Le niveau de la mer a augmenté de 30 m par rapport~à son niveau le plus bas et se trouve donc encore~80 m plus basqu'aujourd'hui. En moins de 100 ans,~le niveau marin augmente encore de 20 m.

  at:-11000 $r text:-11000 ouverture de nouveaux passages maritimes~notamment en [[Méditerranée]],~comme le [[détroit de Messine]] entre l'Italie et la Sicile,~les [[Bouches de Bonifacio]] entre la Sardaigne et la Corse.

  from:-11000 till:-8000 $l color:g5 text:de -11 000 à -8 000 longue période de stabilisation.~Le niveau marin est -55 m plus bas qu'à l'heure actuelle.

  at:-9500 $r text:-9 500 fin de la [[glaciation de Würm]]

  at:-8000 $r text:-8 000 le [[Sahara]] est marécageux, verdoyant,~comportant 3 grands lacs et prairies.~La mer recommence à monter sur la Terre entière.~Augmentation de la température moyenne de 4°C.

  at:-7000 align:right shift:(-16,-20) text:-7 000 ouverture du [[Pas de Calais]].~Des fleuves comme la [[Seine]] et la [[Tamise]]~se jetaient jusqu'alors dans l'océan Atlantique.

  at:-6900 $l text:-6 900 ouverture de la [[mer Baltique]].

  at:-6700 align:left  shift:(16,5) text:-6 700 débâcle du glacier recouvrant la [[Scandinavie]]~due à la fin de la glaciation.~Celui-ci s'effondre dans la mer Baltique,~tandis que la mer Noire commence à déborder vers le Sud.

  at:-6000 $l text:-6 000 La déglaciation au Nord fait avancer le désert saharien plus au Sud qu'actuellement

  at:-5800 $r text:-5 800 fermeture de la mer Baltique.

  at:-5300 $l text:-5 300 réouverture de la mer Baltique.
| Tour de France 2006 | top next |
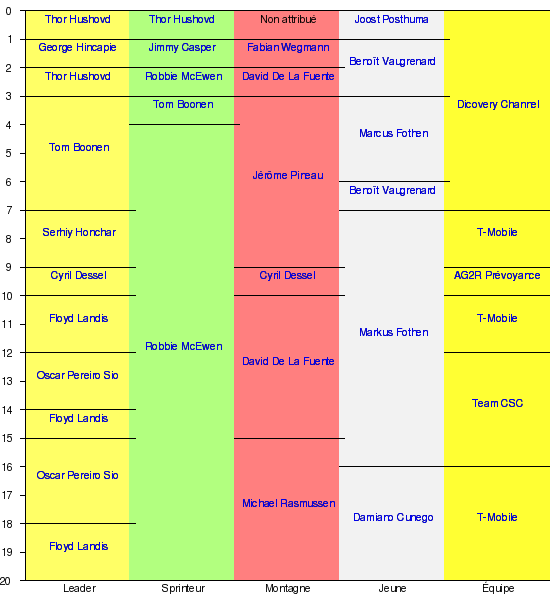
First version by Sanguinez on Sunday, July 2, 2006, last update on Sunday, July 23, 2006
ImageSize  = width:550 height:600
PlotArea   = left:25 right:1 bottom:20 top:10
DateFormat = yyyy
Period     = from:0 till:20
TimeAxis   = orientation:vertical order:reverse
ScaleMajor = gridcolor:white unit:year increment:1 start:1

Colors =
  id:alggeel    value:rgb(1,1,0.4)
  id:bergrood   value:rgb(1,0.5,0.5)
  id:puntgroen  value:rgb(0.7,1,0.5)
  id:lichtgrijs value:rgb(0.95,0.95,0.95)
  id:team       value:rgb(1,1,0.2)

PlotData=

  bar:Leader color:alggeel width:110 mark:(line,black) align:center fontsize:S shift:(0,2)
  # shift texts up or down manually to avoid overlap
  from:0  till:1  text:[[Thor Hushovd]]
  from:1  till:2  text:[[George Hincapie]]
  from:2  till:3  text:[[Thor Hushovd]]
  from:3  till:7  text:[[Tom Boonen]]
  from:7  till:9 text:[[Serhiy Honchar]]
  from:9 till:10 text:[[Cyril Dessel]]
  from:10 till:12 text:[[Floyd Landis]]
  from:12 till:14 text:[[Oscar Pereiro Sio]]
  from:14 till:15 text:[[Floyd Landis]]
  from:15 till:18 text:[[Oscar Pereiro Sio]]
  from:18 till:20 text:[[Floyd Landis]]

  bar:Sprinteur color:puntgroen width:110 mark:(line,black) align:center fontsize:S shift:(0,2)
  # shift texts up or down manually to avoid overlap
  from:0  till:1  text:[[Thor Hushovd]]
  from:1  till:2  text:[[Jimmy Casper]]
  from:2  till:3  text:[[Robbie McEwen]]
  from:3  till:4  text:[[Tom Boonen]]
  from:4  till:20 text:[[Robbie McEwen]]

  bar:Montagne color:bergrood width:110 mark:(line,black) align:center fontsize:S shift:(0,2)
  # shift texts up or down manually to avoid overlap
  from:0  till:1  text:Non attribué
  from:1  till:2  text:[[Fabian Wegmann]]
  from:2  till:3  text:[[David De La Fuente]]
  from:3  till:9 text:[[Jérôme Pineau]]
  from:9  till:10 text:[[Cyril Dessel]]
  from:10  till:15 text:[[David De La Fuente]]
  from:15  till:20 text:[[Michael Rasmussen]]

  bar:Jeune color:lichtgrijs width:110 mark:(line,black) align:center fontsize:S shift:(0,2)
  # shift texts up or down manually to avoid overlap
  from:0  till:1  text:[[Joost Posthuma]]
  from:1  till:3  text:[[Benoît Vaugrenard]]
  from:3  till:6  text:[[Marcus Fothen]]
  from:6  till:7  text:[[Benoît Vaugrenard]]
  from:7  till:16  text:[[Markus Fothen]]
  from:16  till:20  text:[[Damiano Cunego]]

  bar:Équipe color:team width:110 mark:(line,black) align:center fontsize:S shift:(0,2)
  from:0  till:7  text:[[Équipe cycliste Discovery Channel|Dicovery Channel]]
  from:7  till:9 text:[[Équipe cycliste T-Mobile|T-Mobile]]
  from:9  till:10 text:[[Équipe cycliste AG2R Prévoyance|AG2R Prévoyance]]
  from:10 till:12 text:[[Équipe cycliste T-Mobile|T-Mobile]]
  from:12 till:16 text:[[Équipe cycliste Team CSC|Team CSC]]
  from:16 till:20 text:[[Équipe cycliste T-Mobile|T-Mobile]]
| Saint-Brieuc-des-Iffs | top next |

First version by Archipel on Wednesday, April 12, 2006, last update on Friday, April 14, 2006
ImageSize  = width:680 height:380
PlotArea   = left:40 right:10 top:10 bottom:20
TimeAxis   = orientation:horizontal
AlignBars  = justify
Colors =
  id:gray1 value:gray(0.9)

DateFormat = yyyy
Period     = from:1800 till:2010
ScaleMajor = unit:year increment:10 start:1800

PlotData =
  bar:700 color:gray1 width:1
  from:start till:end
  bar:600 color:gray1
  from:start till:end
  bar:500 color:gray1
  from:start till:end
  bar:400 color:gray1
  from:start till:end
  bar:300 color:gray1
  from:start till:end
  bar:200 color:gray1
  from:start till:end
  bar:100 color:gray1
  from:start till:end
  bar:0 color:gray1

LineData =
  layer:front
  points:(40,349)(133,309)   color:blue    width:2
  points:(133,309)(238,305)   color:blue    width:2
  points:(238,305)(358,241)   color:blue    width:2
  points:(358,241)(373,236)   color:blue    width:2
  points:(373,236)(403,213)   color:blue    width:2
  points:(403,213)(418,200)   color:blue    width:2
  points:(418,200)(433,197)   color:blue    width:2
  points:(433,197)(448,186)   color:blue    width:2
  points:(448,186)(478,176)   color:blue    width:2
  points:(478,176)(502,177)   color:blue    width:2
  points:(502,177)(526,138)   color:blue    width:2
  points:(526,138)(544,149)   color:blue    width:2
  points:(544,149)(565,158)   color:blue    width:2
  points:(565,158)(586,159)   color:blue    width:2
  points:(586,159)(610,164)   color:blue    width:2
  points:(610,164)(637,168)   color:blue    width:2
| Dynastie macédonienne | top next |

Initial version by Neuceu on Sunday, September 11, 2005
ImageSize  = width:1000 height:80
PlotArea   = width:980 height:60 left:10 bottom:20

Period      = from:865 till:1060
TimeAxis    = orientation:horizontal
ScaleMajor  = unit:year increment:10 start:870
ScaleMinor  = unit:year increment:5 start:865

Colors =
    id:yellow    value:rgb(0.7,0.7,1) # light yellow
    id:red       value:rgb(1,0.7,0.7) # light red
    id:green     value:rgb(0.7,1,0.7) # light green
    id:blue      value:rgb(1,1,0.7)   # light blue
    id:cyan      value:rgb(0.7,1,1)   # light blue
    id:purple    value:rgb(1,0.7,1)   # light purple
    id:grey      value:gray(0.8)      # grey

PlotData=
  align:center textcolor:black fontsize:8 mark:(line,black) width:25 shift:(0,-5)

  from:    867   till:  886  color:yellow  text:[[Basile Ier (empereur byzantin)|Basile Ier]]
  from:    886   till:  912  color:red     text:[[Léon VI (empereur byzantin)|Léon VI]]
  from:    912   till:  959  color:green   text:[[Constantin VII|Constantin VII]]
  from:    959   till:  963  color:blue   text:[[Romain II (empereur byzantin)|Romain II]]
  from:    963   till:  969  color:cyan   shift:(0,5) text:[[Nicéphore II]]
  from:    969   till:  976  color:purple   text:[[Jean Ier (empereur byzantin)|Jean Ier]]
  from:    976   till: 1025  color:grey   text:[[Basile II (empereur byzantin)|Basile II]]
  from:   1025   till: 1028  color:yellow  shift:(0,5)  text:[[Constantin VIII (empereur byzantin)|Constantin VIII]]
  from:   1028   till: 1050  color:red   text:[[Zoé de Byzance|Zoé]]
  from:   1050   till: 1054  color:green  shift:(0,5) text:[[Constantin IX (empereur byzantin)|Constantin IX]]
  from:   1054   till: 1056  color:cyan   text:[[Théodora Porphyrogénète|Théodora]]
  from:   1056   till: 1057  color:purple  shift:(1,12)  text:[[Michel VI (empereur byzantin)|Michel VI]]
| Empereurs illyriens | top next |

Initial version by Mandrak on Friday, January 20, 2006
ImageSize  = width:1000 height:120
PlotArea   = width:950 height:60 left:10 bottom:20

Colors =
    id:yellow    value:rgb(0.7,0.7,1) # light yellow
    id:red       value:rgb(1,0.7,0.7) # light red
    id:green     value:rgb(0.7,1,0.7) # light green
    id:blue      value:rgb(1,1,0.7)   # light blue
    id:cyan      value:rgb(0.7,1,1)   # light blue
    id:purple    value:rgb(1,0.7,1)   # light purple
    id:grey      value:gray(0.8)      # grey

Period      = from:265 till:287
TimeAxis    = orientation:horizontal
ScaleMajor  = unit:year increment:10 start:270
ScaleMinor =  unit:year increment:5 start:265

BarData=
  bar:barre1
  bar:barre2

LineData =
 width:1

 at:   270 color:blue tillpos:60
 at:   276 color:blue tillpos:60

PlotData=

  align:center textcolor:black fontsize:8 mark:(line,black) shift:(0,-5)

  bar:barre1
  from:    283  till:  284  color:grey     text:[[Numérien]]

  bar:barre2
  at:  270  shift:(0,40) color:blue width:25 text:[[Quintilius]]
  at:  276  shift:(0,40) color:blue width:25 text:[[Florien]]


  from:    268   till:  270   color:purple   text:[[Claude le Gothique|Claude II]]
  from:    270   till:  275  color:yellow   text:[[Aurélien (empereur romain)|Aurélien]]
  from:    275  till:  276  color:blue     text:[[Tacite]]
  from:    276  till:  282  color:red      text:[[Probus]]
  from:    282  till:  283  color:green    text:[[Carus]]
  from:    283  till:  285  color:cyan     text:[[Carin]]
| Palinges | top next |

First version by 195.24.223.133 on Friday, June 9, 2006, last update on Thursday, July 20, 2006
ImageSize  = width:250 height:200
PlotArea   = left:40 right:10 top:10 bottom:20
TimeAxis   = orientation:horizontal
AlignBars  = justify
Colors =
  id:gray1 value:gray(0.9)

DateFormat = yyyy
Period     = from:1960 till:2010
ScaleMajor = unit:year increment:10 start:1960

PlotData =
  bar:2400 color:gray1 width:1
  from:start till:end
  bar:1600 color:gray1
  from:start till:end
  bar:800 color:gray1
  from:start till:end
  bar:0 color:gray1


LineData =
  layer:front
  points:(48,148)(84,146) color:blue  width:2 #1962 tot 1968. Inwonertal 1962: 1805 1968: 1782
  points:(84,146)(100,147)    color:blue    width:2 #1975: 1792
  points:(100,147)(128,141)   color:blue    width:2 #1982: 1714
  points:(128,141)(160,135)   color:blue    width:2 #1990: 1630
  points:(160,135)(196,126)   color:blue    width:2 #1999: 1494
| Template:Histoire de Lille | top next |

Initial version by Poleta33 on Monday, November 21, 2005
DateFormat = yyyy
ImageSize  = width:800 height:auto barincrement:37
PlotArea   = left:15 right:15 bottom:30 top:15

Colors     =
  id:canvas      value:rgb(0.97,0.97,0.97)
  id:grid1       value:rgb(0.80,0.80,0.80)
  id:grid2       value:rgb(0.86,0.86,0.86)
  id:Timeperiod  value:red
  id:Timeperiod2 value:rgb(0.86,0.56,0.56)
  id:gris        value:gray(0.7)
  id:noir        value:black
  id:guerre      value:red
  id:blanc       value:white

Period     = from:600 till:2020
TimeAxis   = orientation:horizontal format:yyyy
ScaleMajor = unit:year  increment:100 start:600 gridcolor:grid1
ScaleMinor = unit:year  increment:50  start:1050 gridcolor:grid2
AlignBars  = justify

BackgroundColors = canvas:canvas bars:canvas

BarData=
  bar:Timeperiod
  barset:Timeperiod2

PlotData=
  width:30 fontsize:S textcolor:noir align:center

  # Époques
  bar:Timeperiod color:Timeperiod shift:(0,0)
  from:start till:end color:gris # Arrière plan

  from:866  till:1304 text: "Flandre" color:Timeperiod2
  from:1304 till:1369 text: "~France"
  from:1369 till:1477 text: "Bourgogne" color:Timeperiod2
  from:1477 till:1579 text: "~Habsbourg"
  from:1579 till:1667 text: "Espagne" color:Timeperiod2
  from:1667 till:end  text: "~France"

  # Évennements
  #alignement →
  width:25 fontsize:S textcolor:black anchor:from align:left color:noir
  barset:Timeperiod2
  from:640  till:640  text:"640 ~Fondation légendaire de Lille" shift:(2,0)
  from:1066 till:1066 text:"1066 ~Mention de la ville dans les archives" shift:(2,0)

  #alignement ←
  width:25 fontsize:S textcolor:black anchor:from align:right color:noir

  from:1454 till:1454 text:"1454 ~Voeu du faisan" shift:(0,0)
  from:1581 till:1582 text:"1581-1582 ~Assauts des Hurlus" shift:(0,0) color:guerre
  from:1708 till:1713 text:"1708-1713 ~Occupation hollandaise" shift:(0,0) color:guerre
  from:1792 till:1792 text:"1792 ~Siège autrichien" shift:(0,0) color:guerre
  from:1846 till:1846 text:"1846 ~Chemin de fer Paris-Lille" shift:(0,0)
  from:1853 till:1853 text:"1853 ~Composition du Ptit Quinquin" shift:(0,0)

  # Recommencer l'indentation en haut
  barset:break

  from:1914 till:1918 text:"1914-1918 ~Occupation allemande" shift:(0,0) color:guerre
  from:1940 till:1944 text:"1940-1944 ~Occupation nazie" shift:(0,0) color:guerre
  from:1960 till:1980 text:"Crise métallurgique, textile et minière" shift:(0,0) color:gris
  from:1969 till:1969 text:"1969 ~Communauté urbaine de Lille" shift:(0,0)
  from:1993 till:1993 text:"1993 ~TGV Paris-Lille" shift:(0,0)
  from:2003 till:2004 text:"2004 ~Lille 2004" shift:(0,0)
| Template:Historique des sorties de Mozilla Firefox | top next |
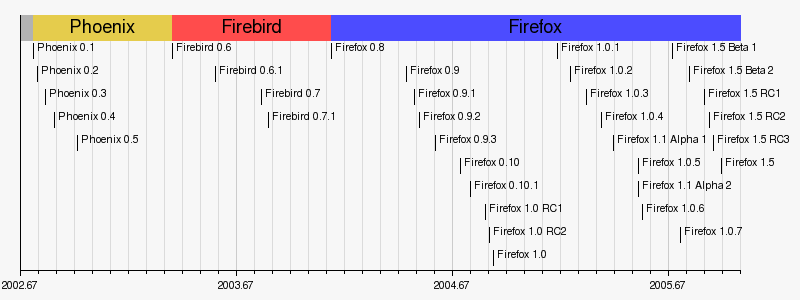
First version by Poleta33 on Monday, November 21, 2005, last update on Wednesday, November 30, 2005
DateFormat = dd/mm/yyyy
ImageSize  = width:800 height:300 # barincrement:20
PlotArea   = left:20 right:60 bottom:30 top:15

Colors     =
  id:canvas      value:rgb(0.97,0.97,0.97)
  id:grid1       value:rgb(0.80,0.80,0.80)
  id:grid2       value:rgb(0.86,0.86,0.86)
  id:Timeperiod  value:red
  id:Timeperiod2 value:rgb(0.86,0.56,0.56)
  id:gris        value:gray(0.7)
  id:noir        value:black
  id:blanc       value:white
  id:phoenyx     value:rgb(0.9,0.8,0.3)
  id:firebird    value:rgb(1,0.3,0.3)
  id:firefox     value:rgb(0.3,0.3,1)

Period     = from:01/09/2002 till:31/12/2005
TimeAxis   = orientation:horizontal format:dd/mm/yyyy
ScaleMajor = unit:year  increment:1  start:01/09/2002 gridcolor:grid1
ScaleMinor = unit:month increment:1  start:01/09/2002 gridcolor:grid2

AlignBars  = justify

BackgroundColors = canvas:canvas bars:canvas
# il faudrait mettre les versions du moteur gecko en periode
BarData=
  bar:Timeperiod
  barset:Timeperiod2

PlotData=
  width:25 fontsize:L textcolor:noir align:center shift:(0,-5)

  # Époques
  bar:Timeperiod color:Timeperiod
  from:start till:end color:gris # Arrière plan
  from:23/09/2002 till:17/05/2003 text:"Phoenix" color:phoenyx
  from:17/05/2003 till:09/02/2004 text:"Firebird" color:firebird
  from:09/02/2004 till:end        text:"Firefox"  color:firefox

  # Évennements
  #alignement →
  width:15 fontsize:S textcolor:black anchor:from align:left color:noir shift:(4,0)
  barset:Timeperiod2
  from:23/09/2002 till:23/09/2002 text:"Phoenix 0.1"
  from:01/10/2002 till:01/10/2002 text:"Phoenix 0.2"
  from:14/10/2002 till:14/10/2002 text:"Phoenix 0.3"
  from:29/10/2002 till:29/10/2002 text:"Phoenix 0.4"
  from:07/12/2002 till:07/12/2002 text:"Phoenix 0.5"
  barset:break
  from:17/05/2003 till:17/05/2003 text:"Firebird 0.6"
  from:28/07/2003 till:28/07/2003 text:"Firebird 0.6.1"
  from:15/10/2003 till:15/10/2003 text:"Firebird 0.7"
  from:26/10/2003 till:26/10/2003 text:"Firebird 0.7.1"
  barset:break
  from:09/02/2004 till:09/02/2004 text:"Firefox 0.8"
  from:15/06/2004 till:15/06/2004 text:"Firefox 0.9"
  from:29/06/2004 till:29/06/2004 text:"Firefox 0.9.1"
  from:08/07/2004 till:08/07/2004 text:"Firefox 0.9.2"
  from:04/08/2004 till:04/08/2004 text:"Firefox 0.9.3"
  from:14/09/2004 till:14/09/2004 text:"Firefox 0.10"
  from:01/10/2004 till:01/10/2004 text:"Firefox 0.10.1"
  from:27/10/2004 till:27/10/2004 text:"Firefox 1.0 RC1"
  from:03/11/2004 till:03/11/2004 text:"Firefox 1.0 RC2"
  from:09/11/2004 till:09/11/2004 text:"Firefox 1.0"
  barset:break
  from:26/02/2005 till:26/02/2005 text:"Firefox 1.0.1"
  from:19/03/2005 till:19/03/2005 text:"Firefox 1.0.2"
  from:15/04/2005 till:15/04/2005 text:"Firefox 1.0.3"
  from:11/05/2005 till:11/05/2005 text:"Firefox 1.0.4"
  from:31/05/2005 till:31/05/2005 text:"Firefox 1.1 Alpha 1"
  from:12/07/2005 till:12/07/2005 text:"Firefox 1.0.5"
  from:12/07/2005 till:12/07/2005 text:"Firefox 1.1 Alpha 2"
  from:19/07/2005 till:19/07/2005 text:"Firefox 1.0.6"
  from:21/09/2005 till:21/09/2005 text:"Firefox 1.0.7"
  barset:break
  from:08/09/2005 till:08/09/2005 text:"Firefox 1.5 Beta 1"
  from:06/10/2005 till:06/10/2005 text:"Firefox 1.5 Beta 2"
  from:01/11/2005 till:01/11/2005 text:"Firefox 1.5 RC1"
  from:10/11/2005 till:10/11/2005 text:"Firefox 1.5 RC2"
  from:16/11/2005 till:16/11/2005 text:"Firefox 1.5 RC3"
  from:30/11/2005 till:30/11/2005 text:"Firefox 1.5"
| Template:Histoire de l'Autriche | top next |
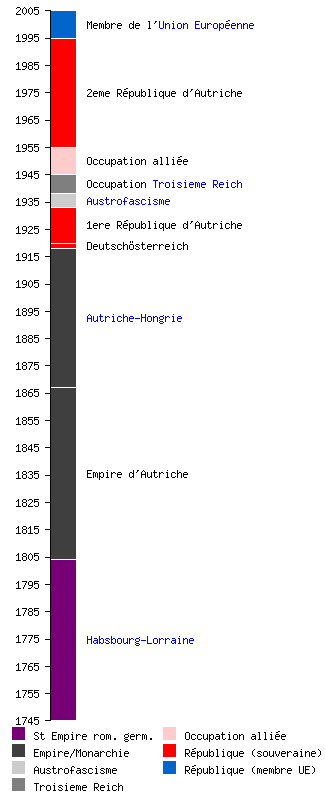
Initial version by Poleta33 on Monday, November 21, 2005
ImageSize  = width:325 height:800
PlotArea   = left:50 right:0 top:10 bottom:80
Legend     = columns:2 left:15 top:75 columnwidth:150

DateFormat = yyyy
Period     = from:1745 till:2005
TimeAxis   = orientation:vertical
ScaleMajor = unit:year increment:10 start:1745

# there is no automatic collision detection,
# so shift texts up or down manually to avoid overlap

Colors=
  id:SER  value:purple     legend:St_Empire_rom._germ.
  id:Mon  value:gray(0.25) legend:Empire/Monarchie
  id:Sta  value:gray(0.8)  legend:Austrofascisme
  id:Dik  value:gray(0.5)  legend:Troisième_Reich
  id:fre  value:pink       legend:Occupation_alliée
  id:Rep  value:red        legend:République_(souveraine)
  id:EU   value:blue       legend:République_(membre_UE)

PlotData=

  bar:BReg color:red width:25 mark:(line,white) align:left fontsize:7 shift:(25,-4)

  from:1745  till:1804 color:SER text:[[Habsbourg-Lorraine]]
  from:1804  till:1867 color:Mon text:Empire d'Autriche
  from:1867  till:1918 color:Mon text:[[Autriche-Hongrie]]
  from:1918  till:1920 color:Rep text:Deutschösterreich
  from:1920  till:1933 color:Rep text:1ère République d'Autriche
  from:1933  till:1938 color:Sta text:[[Austrofascisme]]
  from:1938  till:1945 color:Dik text:Occupation [[Troisième Reich]]
  from:1945  till:1955 color:fre text:Occupation alliée
  from:1955  till:1995 color:Rep text:2ème République d'Autriche
  from:1995  till:end  color:EU  text:Membre de l'[[UE|Union Européenne]]
| Template:Chronologie de l'adoption du calendrier grégorien | top next |

First version by Poleta33 on Monday, November 21, 2005, last update on Tuesday, April 11, 2006
DateFormat = yyyy
ImageSize = width:800 height:auto barincrement:38
PlotArea = left:20 right:20 bottom:20 top:10
Colors =
  id:noir              value:black
  id:canvas            value:rgb(0.97,0.97,0.97)
  id:gris              value:gray(0.80)
  id:grilleMajor       value:rgb(0.80,0.80,0.80)
  id:bleuclair         value:rgb(0.56,0.56,0.86)
  id:rouge             value:red
  id:rougeclair        value:rgb(0.86,0.56,0.56)
  id:bleuclair         value:rgb(0.76,0.76,0.96)
  id:grilleMinor       value:rgb(0.86,0.86,0.86)

Period     = from:1550 till:2050
TimeAxis   = orientation:horizontal format:yyyy
AlignBars  = justify
ScaleMinor = unit:year increment:50 start:1550 gridcolor:grilleMinor
ScaleMajor = unit:year increment:100 start:1600 gridcolor:grilleMajor
BackgroundColors = canvas:canvas bars:canvas
BarData=
  bar:epoque
  barset:evennement

PlotData=
  bar:epoque shift:(0,0) width:30
  from:start till:end color:gris # Arrière plan

  from:start till:1581  text:" Calendrier~ julien" color:rougeclair  anchor:from
  from:1582  till:end   text:" Calendrier grégorien" color:rouge
  barset:evennement color:noir shift:(2,0) width:25

  from:1582  till:1582  text:"[[1582]]~Portugal, Espagne, France et leur possesions;~Italie, Pays-Bas catholiques, Savoie, Luxembourg"   shift:(2,5)
  from:1583  till:1583  text:"[[1583]]~Autriche ; Suisse et Allemagne catholiques"
  from:1586  till:1586  text:"[[1586]]~Pologne"
  from:1587  till:1587  text:"[[1587]]~Hongrie"
  from:1605  till:1710  text:"[[1605]]-1710~Nouvelle Écosse" color:bleuclair anchor:from
  from:1610  till:1610  text:"[[1610]]~Prusse"
  from:1582  till:1735  text:"[[1582]]-1735~Duché de Lorraine" color:bleuclair anchor:from
  from:1648  till:1648  text:"[[1648]]~Alsace"
  from:1682  till:1682  text:"[[1682]]~Strasbourg"
  from:1700  till:1700  text:"[[1700]]~Allemagne, Suisse et Pays-Bas protestants ; ~Norvège, Danemark" shift:(2,5)

  from:1753  till:1753  text:"[[1753]]~Suède & Finlande"

  #Recommencer l'indentation en haut
  barset:break
  at:1752 #blank line
  at:1752 #blank line
  at:1752 #blank line
  at:1752 #blank line
  from:1752  till:1752  text:"[[1752]]~Grande-Bretagne et ses possessions"
  at:1760 #blank line
  from:1760  till:1760  text:"[[1760]]~Lorraine (Habsbourg -> France)"
  at:1584 #blank line
  at:1584 #blank line
  from:1584  till:1584  text:"[[1584]]~Bohème et Moravie"

  #Recommencer l'indentation en haut
  barset:break
  from:1811  till:1811  text:"[[1811]]~Canton suisse de Grisons"
  from:1867  till:1867  text:"[[1867]]~Alaska (Russie -> USA)"
  from:1873  till:1873  text:"[[1873]]~Japon"
  from:1875  till:1875  text:"[[1875]]~Égypte"
  from:1912  till:1912  text:"[[1912]]~Chine, Albanie"
  from:1915  till:1915  text:"[[1915]]~Lettonie, Littuanie"
  from:1916  till:1916  text:"[[1916]]~Bulgarie"
  from:1918  till:1918  text:"[[1918]]~URSS, Estonie, "
  from:1919  till:1919  text:"[[1919]]~Roumanie, Yougoslavie
  from:1923  till:1923  text:"[[1923]]~Grèce"
  from:1926  till:1926  text:"[[1926]]~Turquie"

  #Recommencer l'indentation en haut
  barset:break
  from:1949  till:1949  text:"[[1949]]~République populaire ~de Chine"  shift:(2,5)
| Template:Chronologie des lillois célèbres | top next |

First version by Poleta33 on Monday, November 21, 2005, last update on Thursday, February 9, 2006
DateFormat = yyyy
ImageSize  = width:800 height:auto barincrement:20
PlotArea   = left:15 right:15 bottom:30 top:15
Define $blank = at:1730

Colors     =
  id:canvas      value:rgb(0.97,0.97,0.97)
  id:grid1       value:rgb(0.80,0.80,0.80)
  id:grid2       value:rgb(0.86,0.86,0.86)
  id:Timeperiod  value:red
  id:Timeperiod2 value:rgb(0.86,0.56,0.56)
  id:gris        value:gray(0.7)
  id:noir        value:black
  id:bleu        value:rgb(0.5,0.5,1)
  id:vert        value:rgb(0.5,1,0.5)
  id:rouge       value:rgb(1,0.5,0.5)
  id:blanc       value:white

Period     = from:1730 till:2006
TimeAxis   = orientation:horizontal format:yyyy
ScaleMajor = unit:year  increment:50  start:1750 gridcolor:grid1
ScaleMinor = unit:year  increment:10  start:1730 gridcolor:grid2
AlignBars  = justify

BackgroundColors = canvas:canvas bars:canvas

BarData=
  bar:Timeperiod
  barset:Timeperiod2

PlotData=
  width:30 fontsize:S textcolor:noir align:center

  # Époques
  bar:Timeperiod color:Timeperiod shift:(0,-5)
  from:start till:end color:gris # Arrière plan

  width:25 fontsize:M
  from:start till:end  text:"Lillois célèbres depuis 1730"

  # Évennements
  # alignement →
  width:15 fontsize:S textcolor:black anchor:from align:left color:bleu shift:(5,-5)
  barset:Timeperiod2
  $blank
  from:1735 till:1788 text:"Panckoucke" color:bleu
  from:1762 till:1834 text:"Jean Baptiste Wicar" color:vert
  from:1789 till:1864 text:"Scrive-Labbe" color:bleu
  $blank
  from:1815 till:1899 text:"Scalbert" color:bleu
  $blank
  from:1818 till:1889 text:"Faidherbe" color:rouge
  $blank
  from:1820 till:1892 text:"Desrousseaux" color:vert

  # Recommencer l'indentation en haut
  barset:break
  $blank
  from:1823 till:1892 text:"Lalo" color:vert
  $blank
  $blank
  from:1825 till:1872 text:"Renard" color:vert
  $blank
  from:1832 till:1916 text:"Gosselet" color:bleu
  $blank
  from:1837 till:1917 text:"Carolus-Duran" color:vert
  $blank
  from:1840 till:1914 text:"Mongy" color:bleu
  from:1848 till:1932 text:"Degeyter" color:vert
  from:1858 till:1900 text:"Samain" color:vert
  from:1863 till:1933 text:"Calmette" color:bleu
  from:1868 till:1941 text:"Bernard" color:vert
  from:1870 till:1942 text:"Perrin" color:bleu
  from:1872 till:1961 text:"Guérin" color:bleu
  from:1880 till:1918 text:"de Bettignies" color:rouge
  from:1884 till:1973 text:"Liénart" color:rouge
  from:1886 till:1956 text:"Dariel" color:vert
  from:1890 till:1936 text:"Salengro" color:rouge
  from:1890 till:1970 text:"De Gaulle" color:rouge
  from:1896 till:1967 text:"Duvivier" color:vert
  from:1896 till:1990 text:"Laurent" color:rouge

  # Recommencer l'indentation en haut
  barset:break
  $blank
  from:1898 till:1933 text:"Adorée" color:vert
  from:1899 till:1964 text:"Arnoux" color:vert
  from:1901 till:1979 text:"Simons" color:vert
  from:1917 till:1944 text:"Damerment" color:rouge
  from:1928 till:1977 text:"Godewaersvelde" color:vert
  from:1925 till:end text:"Decaux" color:vert
  from:1928 till:end text:"Mauroy" color:rouge
  from:1928 till:end text:"Furneaux" color:vert
  from:1930 till:end text:"Noiret" color:vert
  from:1938 till:end text:"Aubret" color:vert
  from:1947 till:end text:"Masure" color:vert
  from:1949 till:end text:"Béhat" color:vert
  from:1950 till:end text:"Aubry" color:rouge
  from:1955 till:end text:"Hulot" color:vert
| Template:Chronologie de l'architecture lilloise | top next |

Initial version by Poleta33 on Monday, November 21, 2005
DateFormat = yyyy
ImageSize  = width:800 height:auto barincrement:37
PlotArea   = left:10 right:10 bottom:30 top:15

Colors     =
  id:canvas      value:rgb(0.97,0.97,0.97)
  id:grid1       value:rgb(0.80,0.80,0.80)
  id:grid2       value:rgb(0.86,0.86,0.86)
  id:Timeperiod  value:red
  id:Timeperiod2 value:rgb(0.86,0.56,0.56)
  id:Batiments   value:rgb(0.56,0.56,0.96)
  id:gris        value:gray(0.7)
  id:noir        value:black
  id:blanc       value:white

Period     = from:1200 till:2005
TimeAxis   = orientation:horizontal format:yyyy
ScaleMajor = unit:year  increment:100 start:1200 gridcolor:grid1
ScaleMinor = unit:year  increment:50  start:1250 gridcolor:grid2
AlignBars  = justify

BackgroundColors = canvas:canvas bars:canvas

BarData=
  bar:Timeperiod
  barset:Batiments

PlotData=
  width:25 fontsize:M textcolor:noir align:center

  # Époques
  bar:Timeperiod color:Timeperiod shift:(0,2)
  from:start till:end color:gris # Arrière plan

  from:1200 till:1304 text: "Flandre" color:Timeperiod2 shift:(0,-5)
  from:1304 till:1369 text: "France" shift:(0,-5)
  from:1369 till:1477 text: "Bourgogne" color:Timeperiod2 shift:(0,-5)
  from:1477 till:1579 text: "Habsbourg" shift:(0,-5)
  from:1579 till:1667 text: "Espagne" color:Timeperiod2 shift:(0,-5)
  from:1667 till:end  text: "France" shift:(0,-5)

  # Les bâtiments
  width:25 fontsize:S textcolor:black anchor:from align:left color:Batiments
  barset:Batiments
  from:1453 till:1473 text:"1453-1473 ~Palais Rihour"
  align:right
  from:1652 till:1652 text:"1652 ~Vieille Bourse"
  from:1667 till:1670 text:"1667-1670 ~Citadelle Vauban"
  from:1685 till:1692 text:"1685-1692 ~Porte de Paris"
  from:1717 till:1717 text:"1717 ~Théâtre du Nord"

  # Recommencer l'indentation en haut
  barset:break
  from:1845 till:1845 text:"1845 ~Colonne de la Déesse"
  from:1885 till:1892 text:"1885-1892 ~Palais des Beaux-Arts"
  from:1924 till:1932 text:"1924-1932 ~Hôtel de Ville"  align:left
  from:1991 till:1995 text:"1991-1995~Euralille" shift:(0,0)

  align:left
  from:1907 till:1923 text:"1907-1923 ~Opéra de Lille" shift:(4,0)
  from:1822 till:1822 text:"1822 ~ Musée d'Histoire Naturelle" align:right
  from:1854 till:1999 text:"1854-1999 ~Notre Dame de la Treille" shift:(4,0)

  # Recommencer l'indentation en haut
  barset:break
  from:1869 till:1892 text:"1869-1892 ~Gare Lille-Flandres" shift:(2,0)
  from:2004 till:2004 text:"Lille 2004 ~Maisons Folies" align:right
  from:1237 till:1237 text:"1237 ~Hospice Comtesse" align:left shift:(2,0)
  from:1910 till:1921 text:"1910-1921 ~Chambre de commerce" align:right
| Template:Chronologie de la Chine | top next |

First version by Poleta33 on Monday, November 21, 2005, last update on Saturday, April 29, 2006
DateFormat = yyyy
ImageSize  = width:800 height:auto barincrement:37
PlotArea   = left:20 right:20 bottom:30 top:15

Colors     =
  id:rouge    value:rgb(1,0.3,0.5)
  id:vert     value:rgb(0.5,0.8,0.5)
  id:bleu     value:rgb(0.3,0.5,1)
  id:orange   value:rgb(1,0.6,0)


Period     = from:-221 till:1911
TimeAxis   = orientation:horizontal format:yyyy
ScaleMajor = unit:year  increment:500 start:0
ScaleMinor = unit:year  increment:100  start:-200
AlignBars  = justify

BarData=
  bar:Nord
  bar:Sud
  barset:event

PlotData=
  bar:Nord

  from:-221 till:-207 color:rouge text:~[[Qin]]
  from:-206 till:220 color:vert text:[[Dynastie_Han|Han]]
  from:220 till:265 color:orange text:~[[Trois_Royaumes]]
  from:265 till:316 color:bleu text:[[Jin]]
  from:317 till:420 color:rouge text:~[[Jin]]_postérieurs

  bar:Sud
  from:304 till:439 color:vert text:[[Seize Royaumes]]

  bar:Nord
  from:420 till:589 color:orange text:~[[Dynasties_du_Nord_et_du Sud]]
  from:589 till:618 color:bleu text:[[Dynastie Sui|Sui]]
  from:618 till:907 color:rouge text:~[[Dynastie Tang|Tang]]
  from:907 till:960 color:vert text:[[Cinq_Dynasties]]
  from:960 till:1127 color:orange text:~[[Song_du_Nord]]

  bar:Sud
  from:1127 till:1279 color:bleu text:[[Song_du_Sud]]

  bar:Nord
  from:1115 till:1234 color:rouge text:~[[Jin]]
  from:1277 till:1367 color:vert text:[[Yuan]]_([[Mongols]])
  from:1368 till:1644 color:orange text:~[[dynastie Ming|Ming]]
  from:1644 till:1911 color:bleu text:[[Qing]]_([[Mandchous]])
| Saint-Médard-d'Eyrans | top next |

First version by Erasmus on Sunday, June 4, 2006, last update on Monday, July 17, 2006
ImageSize  = width:250 height:200
PlotArea   = left:40 right:10 top:10 bottom:20
TimeAxis   = orientation:horizontal
AlignBars  = justify
Colors =
  id:gray1 value:gray(0.9)

DateFormat = yyyy
Period     = from:1960 till:2010
ScaleMajor = unit:year increment:10 start:1960

PlotData =
  bar:3300 color:gray1 width:1
  from:start till:end
  bar:2200 color:gray1
  from:start till:end
  bar:1100 color:gray1
  from:start till:end
  bar:0 color:gray1

LineData =
  layer:front
  points:(48,63)(84,77) color:blue  width:2 #1962 tot 1968. Inwonertal 1962: 831 1968: 1109
  points:(84,77)(100,89)    color:blue    width:2 #1975: 1330
  points:(100,89)(128,97)   color:blue    width:2 #1982: 1490
  points:(128,97)(160,125)   color:blue    width:2 #1990: 2033
  points:(160,125)(196,137)   color:blue    width:2 #1999: 2277
  points:(196,137)(228,151)     color:blue    width:2 #2004/5
| Élections mexicaines de 2006 | top next |

Initial version by Xfigpower on Monday, July 10, 2006
ImageSize = width:450 height:225
PlotArea = left:30 bottom:20 top:20 right:20
TimeAxis = orientation:horizontal format:yyyy
AlignBars = justify
DateFormat = x.y
Period     = from:0 till:45.0
TimeAxis   = orientation:horizontal
AlignBars  = early
Colors     =
  id:gray     value:rgb(0.97,0.97,0.97)
  id:PAN      value:rgb(0.4, 0.6, 1)
  id:PRD      value:rgb(1, 0.84314, 0)
  id:PRI      value:rgb(0.8, 0, 0)
  id:ALT      value:rgb(0.2, 0.2, 0.8)
  id:NA       value:rgb(0,0.6667,0.6667)
  id:darkgray     value:rgb(0.27,0.27,0.27)
  id:midgray     value:rgb(0.57,0.57,0.57)
ScaleMajor = gridcolor:midgray increment:10 start:0
ScaleMinor = gridcolor:gray increment:1 start:0

BarData=
  barset:Candidates

PlotData=
  width:15 fontsize:S textcolor:black align:left anchor:from shift:(10,-4) color:red
  barset:Candidates
  from:0 till:37.35 color:PAN width:20 align:left fontsize:S text:"[[Felipe Calderón]]"
  from:0 till:36.35 color:PRD width:20 align:left fontsize:S text:"[[Andrés Manuel López Obrador]]"
  from:0 till:21.57 color:PRI width:20 align:left fontsize:S text:"[[Roberto Madrazo]]"
  from:0 till:2.81 color:ALT width:20 align:left fontsize:S text:"      [[Patricia Mercado]]"
  from:0 till:0.99 color:NA width:20 align:left fontsize:S text:"[[Roberto Campa]]
  from:0 till:0.72 color:midgray width:20 align:left fontsize:S text:"Autres candidats"
  from:0 till:2.14 color:darkgray width:20 align:left fontsize:S text:"    votes doubles / votes nuls"

TextData=
  pos:(155,215) fontsize:M text:Répartition actuelle des votes
  pos:(167,205) fontsize:S text:données du PREP à 0200 UTC
  pos:(400,1) fontsize:S text:(%)
| Belleville-sur-Saône | top next |

Initial version by Pabix on Monday, July 31, 2006
ImageSize  = width:250 height:200
PlotArea   = left:40 right:10 top:10 bottom:20
TimeAxis   = orientation:horizontal
AlignBars  = justify
Colors =
  id:gray1 value:gray(0.9)

DateFormat = yyyy
Period     = from:1960 till:2010
ScaleMajor = unit:year increment:10 start:1960

PlotData =
  bar:9000 color:gray1 width:1
  from:start till:end
  bar:6000 color:gray1
  from:start till:end
  bar:3000 color:gray1
  from:start till:end
  bar:0 color:gray1


LineData =
  layer:front
  points:(48,96)(84,130) color:blue  width:2 #1962 à 1968. Habitants en 1962: 4040, en 1968: 5837
  points:(84,130)(100,140)    color:blue    width:2 #1975: 6360
  points:(100,140)(128,141)   color:blue    width:2 #1982: 6397
  points:(128,141)(160,132)   color:blue    width:2 #1990: 5935
  points:(160,132)(196,130)   color:blue    width:2 #1999: 5840
| Template:Histoire de Liège | top next |

First version by Jrenier on Sunday, January 1, 2006, last update on Sunday, March 5, 2006
DateFormat = yyyy
ImageSize  = width:820 height:auto barincrement:45
PlotArea   = left:10 right:10 bottom:20 top:2

Colors     =
  id:canvas      value:rgb(0.97,0.97,0.97)
  id:grid1       value:gray(0.83)
  id:grid2       value:gray(0.92)
  id:Timeperiod  value:red
  id:Timeperiod2 value:rgb(0.86,0.56,0.56)
  id:gris        value:gray(0.7)
  id:noir        value:black
  id:guerre      value:red
  id:blanc       value:white

Period     = from:700 till:2010
TimeAxis   = orientation:horizontal format:yyyy
ScaleMajor = unit:year  increment:100 start:700 gridcolor:grid1
ScaleMinor = unit:year  increment:50  start:1050 gridcolor:grid2
AlignBars  = justify

BackgroundColors = canvas:canvas bars:canvas

BarData=
  bar:Timeperiod
  barset:Timeperiod2

PlotData=
  width:20 fontsize:M textcolor:noir align:center

  # Époques
  bar:Timeperiod color:Timeperiod shift:(0,0)
  from:start till:end color:gris # Arrière plan

  from:720 till:985 text: "[[Liste des princes-évêques de Liège|Évêché de Liège]]" color:yellow shift:(0,-5)
  from:985 till:1789 text: "[[Principauté de Liège]]" color:Timeperiod2 shift:(0,-5)
  from:1789 till:1795 color:red
  from:1795 till:1815 color:blue
  from:1815 till:1830 color:orange
  from:1830 till:end  text: "[[Belgique]]" color:Timeperiod2 shift:(0,-5)

  # Évennements
  #alignement →
  width:25 fontsize:S textcolor:black anchor:from align:left color:noir
  barset:Timeperiod2
  from:705  till:705  text:"705 ~Saint Lambert est assassiné à Liège" shift:(2,3)
  from:722  till:722  text:"722 ~Saint-Hubert transfert le siège de ~l'évêché de Tongres-Maastricht vers Liège" shift:(2,3)
  from:747  till:747  text:"Vers 747 ~Charlemagne naît dans les ~environs de Liège" shift:(2,3)
  from:985  till:985  text:"985 ~Naissance de la Principauté de Liège" shift:(2,3)

  barset:break # Recommencer l'indentation en haut
  #alignement ←
  width:25 fontsize:S textcolor:black anchor:from align:right color:noir

  from:1789 till:1795 text:"1789-1795 ~Révolution liégeoise" shift:(0,0) color:red
  from:1795 till:1815 text:"1795-1815 ~Liège est sous tutelle francaise" shift:(0,0) color:blue
  from:1815 till:1830 text:"1815-1830 ~Liège est sous tutelle hollandaise" shift:(0,0) color:orange
  from:1830 till:1830 text:"1830 ~Révolution belge" shift:(0,0) color:red
| Situation géostratégique de l'Empire ottoman | top next |

Initial version by Alkashi on Wednesday, June 21, 2006
Preset    = TimeHorizontal_AutoPlaceBars_UnitYear
ImageSize = width:800 barincrement:20
PlotArea  = left:20 right:60 bottom:40

Colors     =
  id:canvas  value:rgb(0.97,0.97,0.97)
  id:white  value:rgb(1,1,1)
  id:subtitle  value:gray(0.8)
  id:grid1   value:gray(0.7)
  id:grid2   value:gray(0.88)
  id:black   value:rgb(0,0,0)
  id:events value:rgb(0.75,1,0.75)
  id:mark1   value:rgb(0,0.7,0)
  id:mark2    value:rgb(0.7,0,0)
  id:years    value:gray(0.5)
  id:period1  value:rgb(1,1,0)
  id:period2  value:rgb(1,0.75,0)
  id:retired   value:rgb(1,0.60,0.50) legend:Reinado
  id:forced   value:claret            legend:abdicación
  id:killed   value:magenta           legend:asesinado
  id:qaz      value:rgb(0.9,0.8,0.8)
  id:zaq value:rgb(0.9,0.4,0.4)
  id:eastern   value:rgb(0.7,0.8,0.8)
  id:western value:rgb(0.7,0.4,0.4)
  id:Mil value:rgb(1,0.8,0.4)
  id:Soc value:rgb(1,0.4,0.8)

BackgroundColors = canvas:canvas

Period     = from:1250 till:1925
ScaleMajor = unit:year increment:100 start:1300 gridcolor:grid1
ScaleMinor = unit:year increment:10 start:1250 gridcolor:grid2
AlignBars  = justify

BarData=

  bar:title_sultans
  bar:sultanes1
  bar:sultanes2
  bar:sultanes3
  bar:sultanes4
  bar:title_events
  barset:eventos
  bar:dummy2 # separator
  bar:title_periods
  bar:periodos


PlotData =

  mark:(line,black)

  fontsize:XS
  width:13

  shift:(5,-6)

  bar:title_sultans    from:start till:end text:[[Osmanli]] fontsize:M anchor:middle align:center width:10 color:subtitle
  bar:title_events     from:start till:end text:"eventos" fontsize:M anchor:middle align:center width:10 color:subtitle mark:(line,white)
  bar:title_periods    from:start till:end text:"periodos" fontsize:M anchor:middle align:center width:10 color:subtitle mark:(line,white)

  shift:(5,-5)
  fontsize:S
  mark:(line,Mil)

  color:events

  barset:eventos
  at:1389 text:[[Batalla de Kosovo|Kosovo]]
  at:1453 text:[[Caida de Constantinopla|Estambul]]
  at:1514 text:[[Batalla de Chaldiran|Chaldiran]]
  from:1683 till:1699 shift:(1,-5) text:"Santa Liga"
  barset:break
  at:1683 text:[[Batalla de Viena|Viena]]
  from:1718  till:1730 shift:(1,-5) color:pink text:[[Periodo Tulipán]]
  from:1839 till:1922 shift:(1,-5) text: Nacionalismo
  from:1789  till:1842 shift:(1,-5) color:pink text:Reformas militares
  from:1676 till:1917 shift:(1,-5) text:"Guerras Ruso-Turcas"
  barset:break
  from:1821 till:1832 shift:(1,-5) text:"Grecia"
  from:1839 till:1876 shift:(1,-5) color:pink text:[[Tanzimat]]
  at:1798 text:Egipto
  from:1908 till:1918 shift:(-10,-5) color:pink text:II Era Mesrutiyet

  barset:break
  from:1876 till:1880 shift:(1,-7) color:pink text:I Era Mesrutiyet

  mark:(none,mark2)
  color:retired
  width:22
  align:left

  bar:sultanes1
  from:1281 till:1326 shift:(1,0) fontsize:XS text:"[[Osman I]]"
  from:1413 till:1421 shift:(-4,0) fontsize:XS text:"[[Mehmed I]]"
  from:1451 till:1481 shift:(1,0) fontsize:XS text:"[[Mehmed II]]"
  from:1520 till:1566 shift:(1,0) fontsize:XS text:"[[Suleiman el magnífico|Suleiman I]]"
  from:1617 till:1618 shift:(-12,0) fontsize:XS color:forced text:"[[Mustafa I]]"
  from:1618 till:1622 shift:(1,-7) fontsize:XS color:killed   text:"[[Osman II]]"
  from:1648 till:1687 shift:(1,0) fontsize:XS color:forced   text:"[[Mehmed IV]]"
  from:1703 till:1730 shift:(1,-7) fontsize:XS color:forced   text:"[[Ahmed III]]"
  from:1808 till:1839 shift:(1,0) fontsize:XS text:"[[Mahmud II]]"
  from:1876 till:1909 shift:(1,0) fontsize:XS color:forced   text:"[[Abd-ul-Hamid II]]"

  bar:sultanes2
  from:1326 till:1359 shift:(1,0) fontsize:XS text:"[[Orhan I]]"
  from:1445 till:1451 shift:(-4,0) fontsize:XS text:"[[Murad II]]"
  from:1481 till:1512 shift:(1,-7) fontsize:XS text:"[[Beyazid II]]"
  from:1574 till:1595 shift:(-4,0) fontsize:XS text:"[[Murad III]]"
  from:1622 till:1623 shift:(1,0) fontsize:XS color:forced   text:"[[Mustafa I]]"
  from:1687 till:1691 shift:(-8,0) fontsize:XS text:"[[Suleiman II]]"
  from:1730 till:1754 shift:(1,-7) fontsize:XS text:"[[Mahmud I]]"
  from:1774 till:1789 shift:(1,0) fontsize:XS text:"[[Abd-ul-Hamid I]]"
  from:1839 till:1861 shift:(1,-7) fontsize:XS text:"[[Abd-ul-Mejid I|Abd-ul-Mejid]]"
  from:1909 till:1918 shift:(1,0) fontsize:XS text:"[[Mehmed V]]"

  bar:sultanes3
  from:1359 till:1389 shift:(1,0) fontsize:XS text:"[[Murad I]]"
  from:1421 till:1444 shift:(1,0) fontsize:XS text:"[[Murad II]]"
  from:1566 till:1574 shift:(-4,-7) fontsize:XS text:"[[Selim II]]"
  from:1595 till:1603 shift:(1,0) fontsize:XS text:"[[Ahmed I]]"
  from:1623 till:1640 shift:(1,-7) fontsize:XS text:"[[Murad IV]]"
  from:1691 till:1695 shift:(1,0) fontsize:XS text:"[[Ahmed II]]"
  from:1754 till:1757 shift:(1,-7) fontsize:XS text:"[[Osman III]]"
  from:1789 till:1807 shift:(1,0) fontsize:XS color:killed   text:"[[Selim III]]"
  from:1861 till:1876 shift:(1,0) fontsize:XS color:killed   text:"[[Abd-ul-Aziz]]"
  from:1918 till:1922 shift:(1,0) fontsize:XS color:forced   text:"[[Mehmed VI]]"

  bar:sultanes4
  from:1389 till:1402 shift:(1,0) fontsize:XS text:"[[Beyazid I]]"
  from:1444 till:1445 shift:(1,0) fontsize:XS text:"[[Mehmed II]]"
  from:1512 till:1520 shift:(1,0) fontsize:XS text:"[[Selim I]]"
  from:1640 till:1648 shift:(1,0) fontsize:XS color:killed   text:"[[Ibrahim I]]"
  from:1695 till:1703 shift:(1,-7) fontsize:XS text:"[[Mustafa II]]"
  from:1757 till:1774 shift:(1,0) fontsize:XS text:"[[Mustafa III]]"
  from:1807 till:1808 shift:(1,0) fontsize:XS color:killed  text:"[[Mustafa IV]]"
  from:1876 till:1876 shift:(1,0) fontsize:XS color:forced   text:"[[Murad V]]"


 bar:periodos
  at:start shift:(2, 20) fontsize:XS text:<[[Edad Media]]
  at:1453  shift:(2, 22) fontsize:XS text:
| Template:Chronologie des rois de Norvège | top next |
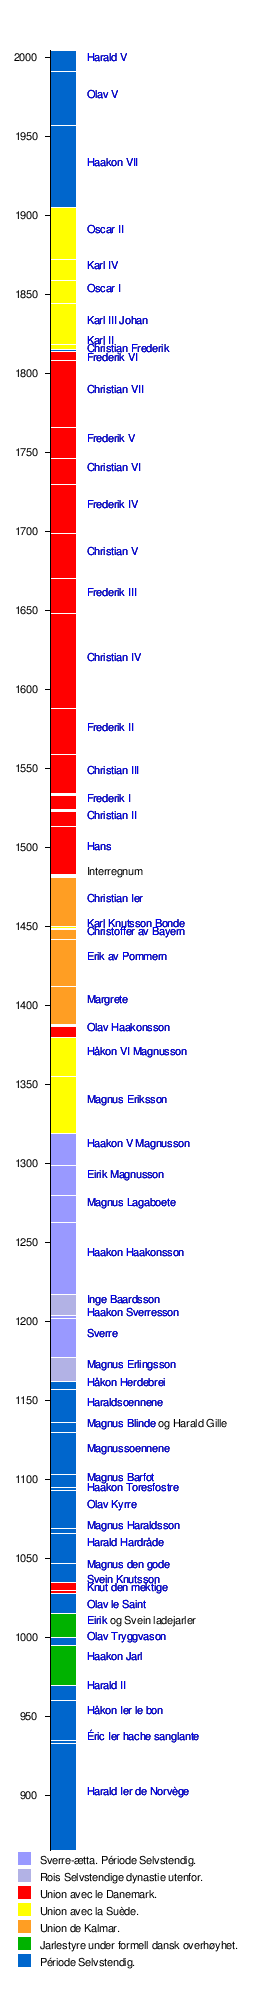
First version by Poleta33 on Tuesday, January 10, 2006, last update on Wednesday, June 7, 2006
ImageSize  = width:260 height:2000
PlotArea   = width:125 height:1800 left:50 bottom:150
AlignBars  = early

Legend     = columns:1 left:20 top:150 columnwidth:300

DateFormat = yyyy
Period     = from:865 till:2004
TimeAxis   = orientation:vertical
ScaleMajor = unit:year increment:50 start:900
Colors =
 id:SS  value:rgb(0.6,0.6,1)    legend:Sverre-ætta._Période_Selvstendig.
 id:OD  value:rgb(0.7,0.7,0.9)  legend:Rois_Selvstendige_dynastie_utenfor.
 id:DA  value:red               legend:Union_avec_le_Danemark.
 id:SV  value:yellow            legend:Union_avec_la_Suède.
 id:DS  value:orange            legend:Union_de_Kalmar.
 id:LJ  value:green             legend:Jarlestyre_under_formell_dansk_overhøyhet.
 id:NO  value:blue              legend:Période_Selvstendig.

# there is no automatic collision detection,
# so shift texts up or down manually to avoid overlap
Define $dx = 25


PlotData =
  bar:Regenter color:blue width:25 mark:(line,white) align:left fontsize:S

  from:start till:933 shift:($dx,2) text:[[Harald Ier de Norvège]]
  from:933   till:935 shift:($dx,1) text:[[Éric Ier de Norvège|Éric Ier hache sanglante]]
  from:935   till:960 shift:($dx,6) text:[[Håkon Ier de Norvège|Håkon Ier le bon]]
  from:960   till:970 shift:($dx,3) text:[[Harald II de Norvège|Harald II]]
  from:970   till:995 shift:($dx,5) color:green text:[[Håkon Sigurdsson|Haakon Jarl]]
  from:995   till:1000 shift:($dx,1) text:[[Olav Tryggvason]]
  from:1000   till:1015 shift:($dx,1) color:green text:[[Eirik Håkonsson|Eirik]] og [[Svein Håkonsson|Svein ladejarler]]
  from:1015   till:1028 shift:($dx,-5) text:[[Olav II de Norvège|Olav le Saint]]
  from:1028   till:1030 shift:($dx,0) color:DA text:[[Knut den mektige]]
  from:1030   till:1035 shift:($dx,3) color:DA text:[[Svein Knutsson]]
  from:1035   till:1047 shift:($dx,4) text:[[Magnus den gode]]
  from:1047   till:1066 shift:($dx,2) text:[[Harald III de Norvège|Harald Hardråde]]
  from:1066   till:1069 shift:($dx,1) text:[[Magnus Haraldsson]]
  from:1069   till:1093 shift:($dx,1) text:[[Olav Kyrre]]
  from:1093   till:1095 shift:($dx,-2) text:[[Håkon Magnusson Toresfostre|Haakon Toresfostre]]
  from:1093   till:1103 shift:($dx,1) text:[[Magnus Berrføtt|Magnus Barfot]]
  from:1103   till:1130 shift:($dx,1) text:[[Sigurd Jorsalfare|Magnussoennene]]
  from:1130   till:1136 shift:($dx,0) text:[[Magnus Blinde]] og [[Harald Gille]]
  from:1136   till:1157 shift:($dx,0) text:[[Sigurd Munn|Haraldsoennene]]
  from:1157   till:1162 shift:($dx,-1) text:[[Håkon Herdebrei|Håkon Herdebrei]]
  from:1162   till:1177 shift:($dx,1) color:OD text:[[Magnus Erlingsson]]
  from:1177   till:1202 shift:($dx,1) color:SS text:[[Sverre Sigurdsson|Sverre]]
  from:1202   till:1204 shift:($dx,0) color:SS text:[[Håkon Sverresson|Haakon Sverresson]]
  from:1204   till:1217 shift:($dx,1) color:OD text:[[Inge Bårdsson|Inge Baardsson]]
  from:1217   till:1263 shift:($dx,2) color:SS text:[[Håkon Håkonsson|Haakon Haakonsson]]
  from:1263   till:1280 shift:($dx,2) color:SS text:[[Magnus Lagabøte|Magnus Lagaboete]]
  from:1280   till:1299 shift:($dx,2) color:SS text:[[Eirik Magnusson]]
  from:1299   till:1319 shift:($dx,2) color:SS text:[[Håkon V Magnusson|Haakon V Magnusson]]
  from:1319   till:1355 shift:($dx,2) color:SV text:[[Magnus Eriksson]]
  from:1355   till:1380 shift:($dx,1) color:SV text:[[Håkon VI Magnusson]]
  from:1380   till:1387 shift:($dx,0) color:DA text:[[Olav Håkonsson|Olav Haakonsson]]
  from:1388   till:1412 shift:($dx,2) color:DS text:[[Dronning Margrete Valdemarsdotter|Margrete]]
  from:1412   till:1442 shift:($dx,2) color:DS text:[[Erik av Pommern]]
  from:1442   till:1448 shift:($dx,-1) color:DS text:[[Christoffer av Bayern]]
  from:1449   till:1450 shift:($dx,0) color:SV text:[[Karl Knutsson Bonde]]
  from:1450   till:1481 shift:($dx,0) color:DS text:[[Christian Ier de Norvège|Christian Ier]]
  from:1481   till:1483 shift:($dx,0) color:white text:Interregnum
  from:1483   till:1513 shift:($dx,0) color:DA text:[[Hans]]
  from:1513   till:1523 shift:($dx,0) color:DA text:[[Christian II]]
  from:1524   till:1533 shift:($dx,0) color:DA text:[[Frederik I]]
  from:1534   till:1559 shift:($dx,0) color:DA text:[[Christian III]]
  from:1559   till:1588 shift:($dx,0) color:DA text:[[Frederik II]]
  from:1588   till:1648 shift:($dx,0) color:DA text:[[Christian IV]]
  from:1648   till:1670 shift:($dx,0) color:DA text:[[Frederik III]]
  from:1670   till:1699 shift:($dx,0) color:DA text:[[Christian V]]
  from:1699   till:1730 shift:($dx,0) color:DA text:[[Frederik IV]]
  from:1730   till:1746 shift:($dx,0) color:DA text:[[Christian VI]]
  from:1746   till:1766 shift:($dx,0) color:DA text:[[Frederik V]]
  from:1766   till:1808 shift:($dx,0) color:DA text:[[Christian VII]]
  from:1808   till:1814 shift:($dx,-5) color:DA text:[[Frederik VI]]
  from:1814   till:1815 shift:($dx,-2) text:[[Christian Frederik]]
  from:1815   till:1818 shift:($dx,3) color:SV text:[[Karl II]]
  from:1818   till:1844 shift:($dx,0) color:SV text:[[Karl III Johan]]
  from:1844   till:1859 shift:($dx,0) color:SV text:[[Oscar I]]
  from:1859   till:1872 shift:($dx,0) color:SV text:[[Karl IV]]
  from:1872   till:1905 shift:($dx,0) color:SV text:[[Oscar II]]
  from:1905   till:1957 shift:($dx,0) text:[[Haakon VII]]
  from:1957   till:1991 shift:($dx,0) text:[[Olav V]]
  from:1991   till:2004 shift:($dx,0) text:[[Harald V]]
| Patrouille des Glaciers | top next |

First version by Romano1246 on Sunday, April 23, 2006, last update on Friday, June 30, 2006
ImageSize  = width:750 height:200
PlotArea   = left:40 right:40 top:20 bottom:20
TimeAxis   = orientation:vertical
AlignBars  = justify
Colors =
  id:gray1 value:gray(0.9)

DateFormat = yyyy
Period     = from:1500 till:3700
ScaleMajor = unit:year increment:200 start:1500 gridcolor:gray1

PlotData =
  bar:60 color:gray1 width:1
  from:start till:end
 bar:58 color:gray1 width:1
  from:start till:end
  from:1500 till:1520 text:[[Verbier]]   width:12 textcolor:red    fontsize:12px
  bar:56 color:gray1 width:1
  from:start till:end
 bar:54 color:gray1 width:1
  from:start till:end
   bar:52 color:gray1 width:1
  from:start till:end
  bar:50 color:gray1 width:1
  from:start till:end
  bar:48 color:gray1 width:1
  from:start till:end
 bar:46 color:gray1 width:1
  from:start till:end
  bar:44 color:gray1 width:1
  from:start till:end
 bar:42 color:gray1 width:1
  from:start till:end
   bar:40 color:gray1 width:1
  from:start till:end
  bar:38 color:gray1 width:1
  from:start till:end
  bar:36 color:gray1 width:1
  from:start till:end
 bar:34 color:gray1 width:1
  from:start till:end
  bar:32 color:gray1 width:1
  from:start till:end
 bar:30 color:gray1 width:1
  from:start till:end
   bar:28 color:gray1 width:1
  from:start till:end
  bar:26 color:gray1 width:1
  from:start till:end
  from:1990 till:2010 text:[[Arolla]]   width:12 textcolor:red    fontsize:12px
  bar:24 color:gray1 width:1
  from:start till:end
 bar:22 color:gray1 width:1
  from:start till:end
  bar:20 color:gray1 width:1
  from:start till:end
 bar:18 color:gray1 width:1
  from:start till:end
   bar:16 color:gray1 width:1
  from:start till:end
  from:3640 till:3660 text:Tête_Blanche   width:12 textcolor:blue    fontsize:12px
  bar:14 color:gray1 width:1
  from:start till:end
  bar:12 color:gray1 width:1
  from:start till:end
 bar:10 color:gray1 width:1
  from:start till:end
  bar:8 color:gray1 width:1
  from:start till:end
 bar:6 color:gray1 width:1
  from:start till:end
  from:1600 till:1620 text:[[Zermatt]]   width:12 textcolor:red    fontsize:12px
   bar:4 color:gray1 width:1
  from:start till:end
  bar:2 color:gray1 width:1
  from:start till:end
  bar:0 color:gray1 width:1
  from:start till:end


LineData =
  layer:front
  points:(710,25)(621,100) color:blue  width:2 #Zermatt-Schönbiel
  points:(621,100)(530,175)    color:blue    width:2 #Schönbiel-Blanche
  points:(530,175)(488,148)   color:blue    width:2 #Blanche-Col Bertol
  points:(488,148)(455,105)   color:blue    width:2 #Col Bertol-Plan Bertol
  points:(455,105)(398,55)   color:blue    width:2 #Plan Bertol-Arolla
  points:(398,55)(343,122)   color:blue    width:2 #Arolla-Riedmatten
  points:(343,122)(321,98)   color:blue    width:2 #Riedmatten-Chat
  points:(321,98)(288,98)   color:blue    width:2 #Chat-Berma
  points:(288,98)(232,140)   color:blue    width:2 #Berma-Rosablanche
  points:(232,140)(186,123)   color:blue    width:2 #Rosablanche-Chaux
  points:(186,123)(164,70)   color:blue    width:2 #Chaux-Ruinette
  points:(164,70)(120,22)   color:blue    width:2 #Ruinette-Verbier
| Chronologie détaillée de la tour Eiffel | top next |

Initial version by Kuxu ? on Tuesday, April 4, 2006
DateFormat = yyyy
ImageSize  = width:800 height:auto barincrement:37
PlotArea   = left:10 right:10 bottom:30 top:15

Colors     =
  id:canvas      value:rgb(0.86,0.92,0.99)
  id:grid1       value:rgb(0.80,0.80,0.80)
  id:grid2       value:rgb(0.86,0.86,0.86)
  id:Timeperiod  value:red
  id:Timeperiod2 value:rgb(0.86,0.56,0.56)
  id:Batiments   value:rgb(0.56,0.56,0.96)
  id:gris        value:gray(0.7)
  id:noir        value:black
  id:blanc       value:white

Period     = from:1783 till:2006
TimeAxis   = orientation:horizontal format:yyyy
ScaleMajor = unit:year  increment:10 start:1790 gridcolor:grid1
ScaleMinor = unit:year  increment:5  start:1795 gridcolor:grid2
AlignBars  = justify

BackgroundColors = canvas:canvas bars:canvas

BarData=
  bar:Timeperiod
  barset:Batiments

PlotData=
  width:25 fontsize:M textcolor:noir align:left

  # Époques
  bar:Timeperiod color:Timeperiod shift:(0,2)

  from:1783 till:1884 color:red
  from:1884 till:2006 color:white
| Chronologie détaillée de la tour Eiffel | top next |

Initial version by Kuxu ? on Tuesday, April 4, 2006
DateFormat = yyyy
ImageSize  = width:800 height:auto barincrement:37
PlotArea   = left:10 right:10 bottom:30 top:15

Colors     =
  id:canvas      value:rgb(0.86,0.92,0.99)
  id:grid1       value:rgb(0.80,0.80,0.80)
  id:grid2       value:rgb(0.86,0.86,0.86)
  id:Timeperiod  value:red
  id:Timeperiod2 value:rgb(0.86,0.56,0.56)
  id:Batiments   value:rgb(0.56,0.56,0.96)
  id:gris        value:gray(0.7)
  id:noir        value:black
  id:blanc       value:white

Period     = from:1783 till:2006
TimeAxis   = orientation:horizontal format:yyyy
ScaleMajor = unit:year  increment:10 start:1790 gridcolor:grid1
ScaleMinor = unit:year  increment:5  start:1795 gridcolor:grid2
AlignBars  = justify

BackgroundColors = canvas:canvas bars:canvas

BarData=
  bar:Timeperiod
  barset:Batiments

PlotData=
  width:25 fontsize:M textcolor:noir align:left

  # Époques
  bar:Timeperiod color:Timeperiod shift:(0,2)

  from:1783 till:1884 color:white
  from:1884 till:1889 color:red
  from:1889 till:2006 color:white
| Chronologie détaillée de la tour Eiffel | top next |

Initial version by Kuxu ? on Tuesday, April 4, 2006
DateFormat = yyyy
ImageSize  = width:800 height:auto barincrement:37
PlotArea   = left:10 right:10 bottom:30 top:15

Colors     =
  id:canvas      value:rgb(0.86,0.92,0.99)
  id:grid1       value:rgb(0.80,0.80,0.80)
  id:grid2       value:rgb(0.86,0.86,0.86)
  id:Timeperiod  value:red
  id:Timeperiod2 value:rgb(0.86,0.56,0.56)
  id:Batiments   value:rgb(0.56,0.56,0.96)
  id:gris        value:gray(0.7)
  id:noir        value:black
  id:blanc       value:white

Period     = from:1783 till:2006
TimeAxis   = orientation:horizontal format:yyyy
ScaleMajor = unit:year  increment:10 start:1790 gridcolor:grid1
ScaleMinor = unit:year  increment:5  start:1795 gridcolor:grid2
AlignBars  = justify

BackgroundColors = canvas:canvas bars:canvas

BarData=
  bar:Timeperiod
  barset:Batiments

PlotData=
  width:25 fontsize:M textcolor:noir align:left

  # Époques
  bar:Timeperiod color:Timeperiod shift:(0,2)

  from:1783 till:1890 color:white
  from:1890 till:1900 color:red
  from:1900 till:2006 color:white
| Chronologie détaillée de la tour Eiffel | top next |

Initial version by Kuxu ? on Tuesday, April 4, 2006
DateFormat = yyyy
ImageSize  = width:800 height:auto barincrement:37
PlotArea   = left:10 right:10 bottom:30 top:15

Colors     =
  id:canvas      value:rgb(0.86,0.92,0.99)
  id:grid1       value:rgb(0.80,0.80,0.80)
  id:grid2       value:rgb(0.86,0.86,0.86)
  id:Timeperiod  value:red
  id:Timeperiod2 value:rgb(0.86,0.56,0.56)
  id:Batiments   value:rgb(0.56,0.56,0.96)
  id:gris        value:gray(0.7)
  id:noir        value:black
  id:blanc       value:white

Period     = from:1783 till:2006
TimeAxis   = orientation:horizontal format:yyyy
ScaleMajor = unit:year  increment:10 start:1790 gridcolor:grid1
ScaleMinor = unit:year  increment:5  start:1795 gridcolor:grid2
AlignBars  = justify

BackgroundColors = canvas:canvas bars:canvas

BarData=
  bar:Timeperiod
  barset:Batiments

PlotData=
  width:25 fontsize:M textcolor:noir align:left

  # Époques
  bar:Timeperiod color:Timeperiod shift:(0,2)

  from:1783 till:1901 color:white
  from:1901 till:1918 color:red
  from:1918 till:2006 color:white
| Chronologie détaillée de la tour Eiffel | top next |

Initial version by Kuxu ? on Tuesday, April 4, 2006
DateFormat = yyyy
ImageSize  = width:800 height:auto barincrement:37
PlotArea   = left:10 right:10 bottom:30 top:15

Colors     =
  id:canvas      value:rgb(0.86,0.92,0.99)
  id:grid1       value:rgb(0.80,0.80,0.80)
  id:grid2       value:rgb(0.86,0.86,0.86)
  id:Timeperiod  value:red
  id:Timeperiod2 value:rgb(0.86,0.56,0.56)
  id:Batiments   value:rgb(0.56,0.56,0.96)
  id:gris        value:gray(0.7)
  id:noir        value:black
  id:blanc       value:white

Period     = from:1783 till:2006
TimeAxis   = orientation:horizontal format:yyyy
ScaleMajor = unit:year  increment:10 start:1790 gridcolor:grid1
ScaleMinor = unit:year  increment:5  start:1795 gridcolor:grid2
AlignBars  = justify

BackgroundColors = canvas:canvas bars:canvas

BarData=
  bar:Timeperiod
  barset:Batiments

PlotData=
  width:25 fontsize:M textcolor:noir align:left

  # Époques
  bar:Timeperiod color:Timeperiod shift:(0,2)

  from:1783 till:1919 color:white
  from:1919 till:1946 color:red
  from:1946 till:2006 color:white
| Chronologie détaillée de la tour Eiffel | top next |

Initial version by Kuxu ? on Tuesday, April 4, 2006
DateFormat = yyyy
ImageSize  = width:800 height:auto barincrement:37
PlotArea   = left:10 right:10 bottom:30 top:15

Colors     =
  id:canvas      value:rgb(0.86,0.92,0.99)
  id:grid1       value:rgb(0.80,0.80,0.80)
  id:grid2       value:rgb(0.86,0.86,0.86)
  id:Timeperiod  value:red
  id:Timeperiod2 value:rgb(0.86,0.56,0.56)
  id:Batiments   value:rgb(0.56,0.56,0.96)
  id:gris        value:gray(0.7)
  id:noir        value:black
  id:blanc       value:white

Period     = from:1783 till:2006
TimeAxis   = orientation:horizontal format:yyyy
ScaleMajor = unit:year  increment:10 start:1790 gridcolor:grid1
ScaleMinor = unit:year  increment:5  start:1795 gridcolor:grid2
AlignBars  = justify

BackgroundColors = canvas:canvas bars:canvas

BarData=
  bar:Timeperiod
  barset:Batiments

PlotData=
  width:25 fontsize:M textcolor:noir align:left

  # Époques
  bar:Timeperiod color:Timeperiod shift:(0,2)

  from:1783 till:1947 color:white
  from:1947 till:2006 color:red
| Template:Chronologie du Japon | top next |

First version by Tvpm on Monday, January 30, 2006, last update on Thursday, June 29, 2006
ImageSize  = width:320 height:620
PlotArea   = left:0 right:0 bottom:30 top:10
AlignBars  = justify

DateFormat = yyyy
Period     = from:-660 till:2006
TimeAxis   = orientation:vertical

Colors=
  id:canvas value:gray(0.5)
  id:Jid    value:orange
  id:Kod    value:lightorange
  id:Chu    value:gray(0.8)
  id:Kin    value:lavender
  id:Gen    value:purple

Define $left  = align:right shift:(-25,-5)
Define $right = align:left  shift:(25,-5)

PlotData=
  mark:(line,white) fontsize:S shift:(25,-5)
  width:25 fontsize:S textcolor:black
  from:start till:-300 color:Jid   $right  text:"[[Période Jōmon]]"
  from:-300  till:250  color:Jid   $right  text:"[[Période Yayoi]]"
  from:250   till:710  color:Kod   $right  text:"[[Période Yamato]]"
  from:710   till:794  color:Kod   $right  text:"[[Époque de Nara]]"
  from:794   till:1185 color:Kod   $right  text:"[[Époque de Heian]]"
  from:1185  till:1333 color:Chu   $right  text:"[[Époque de Kamamura]]"
  from:1333  till:1388 color:Chu   $right  text:"[[Restauration de Kemmu]]"
  from:1388  till:1573 color:Chu   $right  text:"[[Époque de Muromachi]]"
  from:1573  till:1603 color:Chu   $right  text:"[[Époque Azuchi Momoyama]]"
  from:1603  till:1868 color:Kin   $right  text:"[[Époque d'Edo]]"
  from:1868  till:1912 color:Gen   $right  text:"[[Ère Meiji]]" shift:(25,-8)
  from:1912  till:1926 color:Gen   $right  text:"[[Ère Taisho]]" shift:(25,-6)
  from:1926  till:1989 color:Gen   $right  text:"[[Ère Showa]]"
  from:1989  till:end  color:Gen   $right  text:"[[Ère Heisei]]"

  width:33 shift:(-25,-5) align:right color:tan1 fontsize:M textcolor:black
  from:-660  till:250  text:"Préhistoire~(Genshi-Jidai)"
  from:250   till:1185 text:"Antiquité~(Kodai)"
  from:1185  till:1603 text:"Époque féodale~(Chūsei)"
  from:1603  till:1868 text:"Époque pré-moderne~(Kinsei)"
  from:1868  till:end  text:"Époque moderne~(Kindai/Gendai)"

  fontsize:S textcolor:black align:right shift: (11, -11)
  at:-660 text:"-660" shift:(11, 1)
  at:250  text:"250"
  at:1185 text:"1185"
  at:1603 text:"1603"
  at:1868 text:"1868"
| Template:Chronologie de l'énergie solaire | top next |

First version by VIGNERON on Monday, January 30, 2006, last update on Wednesday, February 1, 2006
DateFormat = yyyy
ImageSize  = width:800 height:auto barincrement:30
PlotArea   = left:20 right:20 bottom:30 top:15

Colors     =
  id:Th    value:rgb(0,0,1)
  id:PV    value:rgb(0.2,0.6,0.8)
  id:gris  value:gray(0.7)

Period = from:1750 till:2050
TimeAxis   = orientation:horizontal format:yyyy
ScaleMajor = unit:year  increment:100 start:1800 gridcolor:black
ScaleMinor = unit:year  increment:10 start:1750 gridcolor:gris
AlignBars  = justify

BarData=
  barset:PV
  bar:Th
  bar:station

PlotData =
  width:25 fontsize:S textcolor:black align:center

 barset:PV color:PV
 from:1839 till:1839 text:Alexandre_Edmond_Becquerel_découvre_l'effet_photovoltaïque
 from:1887 till:1887 text:Heinrich_Rudolf_Hertz
 from:1904 till:1907 text:Albert_Einstein_explique_l'effet_photovoltaïque
 from:1912 till:1916 text:Robert_Andrews_Millikan_prouve_cet_effet
 bar:station
 from:1971 till:1972 text:la_station_Saliout_1_est_équipée_de_4_panneaux_solaires_soit_28_m² align:right
 from:1973 till:1975 text:~la_station_Skylab_est_équipée_de_panneaux_solaires align:right
 from:1986 till:2001 text:station_Mir

 bar:Th color:Th
 from:1767 till:1767 text:Horace_de_Saussure_construit_le_premier_four_solaire align:left
| Troia | top next |
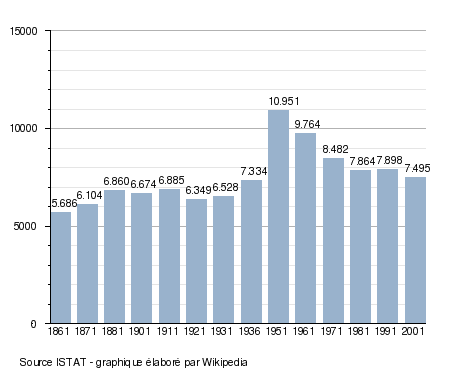
Initial version by Valérie75 on Saturday, June 17, 2006
Colors=
  id:lightgrey value:gray(0.9)
  id:darkgrey  value:gray(0.7)
  id:sfondo value:rgb(1,1,1)
  id:barra value:rgb(0.6,0.7,0.8)

ImageSize  = width:455 height:373
PlotArea   = left:50 bottom:50 top:30 right:30
DateFormat = x.y
Period     = from:0 till:15000
TimeAxis   = orientation:vertical
AlignBars  = justify
ScaleMajor = gridcolor:darkgrey increment:5000 start:0
ScaleMinor = gridcolor:lightgrey increment:1000 start:0
BackgroundColors = canvas:sfondo

BarData=
  bar:1861 text:1861
  bar:1871 text:1871
  bar:1881 text:1881
  bar:1901 text:1901
  bar:1911 text:1911
  bar:1921 text:1921
  bar:1931 text:1931
  bar:1936 text:1936
  bar:1951 text:1951
  bar:1961 text:1961
  bar:1971 text:1971
  bar:1981 text:1981
  bar:1991 text:1991
  bar:2001 text:2001

PlotData=
  color:barra width:20 align:left

  bar:1861 from:0 till: 5686
  bar:1871 from:0 till: 6104
  bar:1881 from:0 till: 6860
  bar:1901 from:0 till: 6674
  bar:1911 from:0 till: 6885
  bar:1921 from:0 till: 6349
  bar:1931 from:0 till: 6528
  bar:1936 from:0 till: 7334
  bar:1951 from:0 till: 10951
  bar:1961 from:0 till: 9764
  bar:1971 from:0 till: 8482
  bar:1981 from:0 till: 7864
  bar:1991 from:0 till: 7898
  bar:2001 from:0 till: 7495

PlotData=

  bar:1861 at: 5686 fontsize:S text: 5.686 shift:(-8,5)
  bar:1871 at: 6104 fontsize:S text: 6.104 shift:(-10,5)
  bar:1881 at: 6860 fontsize:S text: 6.860 shift:(-10,5)
  bar:1901 at: 6674 fontsize:S text: 6.674 shift:(-10,5)
  bar:1911 at: 6885 fontsize:S text: 6.885 shift:(-10,5)
  bar:1921 at: 6349 fontsize:S text: 6.349 shift:(-10,5)
  bar:1931 at: 6528 fontsize:S text: 6.528 shift:(-10,5)
  bar:1936 at: 7334 fontsize:S text: 7.334 shift:(-10,5)
  bar:1951 at: 10951 fontsize:S text: 10.951 shift:(-10,5)
  bar:1961 at: 9764 fontsize:S text: 9.764 shift:(-10,5)
  bar:1971 at: 8482 fontsize:S text: 8.482 shift:(-10,5)
  bar:1981 at: 7864 fontsize:S text: 7.864 shift:(-10,5)
  bar:1991 at: 7898 fontsize:S text: 7.898 shift:(-10,5)
  bar:2001 at: 7495 fontsize:S text: 7.495 shift:(-10,5)

TextData=
  fontsize:S pos:(20,20)
  text:Source ISTAT - graphique élaboré par Wikipedia
| Jerez de la Frontera | top next |

Initial version by Kuxu on Friday, July 21, 2006
Colors=
  id:lightgrey value:gray(0.9)
  id:darkgrey  value:gray(0.7)
  id:sfondo value:rgb(1,1,1)
  id:barra value:rgb(0.6,0.7,0.8)

ImageSize  = width:610 height:350
PlotArea   = left:50 bottom:50 top:30 right:30
DateFormat = x.y
Period     = from:0 till:200000
TimeAxis   = orientation:vertical
AlignBars  = justify
ScaleMajor = gridcolor:darkgrey increment:21000 start:0
ScaleMinor = gridcolor:lightgrey increment:7000 start:0
BackgroundColors = canvas:sfondo

BarData=
  bar:1900 text:1900
  bar:1910 text:1910
  bar:1920 text:1920
  bar:1930 text:1930
  bar:1940 text:1940
  bar:1950 text:1950
  bar:1960 text:1960
  bar:1970 text:1970
  bar:1981 text:1981
  bar:1991 text:1991
  bar:1996 text:1996
  bar:1998 text:1998
  bar:1999 text:1999
  bar:2000 text:2000
  bar:2001 text:2001
  bar:2002 text:2002
  bar:2003 text:2003
  bar:2004 text:2004
  bar:2005 text:2005

PlotData=
  color:barra width:20 align:center

  bar:1900 from:0 till: 63473
  bar:1910 from:0 till: 62628
  bar:1920 from:0 till: 64861
  bar:1930 from:0 till: 72055
  bar:1940 from:0 till: 89525
  bar:1950 from:0 till: 107770
  bar:1960 from:0 till: 130900
  bar:1970 from:0 till: 149867
  bar:1981 from:0 till: 176238
  bar:1991 from:0 till: 184364
  bar:1996 from:0 till: 182269
  bar:1998 from:0 till: 181602
  bar:1999 from:0 till: 182660
  bar:2000 from:0 till: 183677
  bar:2001 from:0 till: 185091
  bar:2002 from:0 till: 187087
  bar:2003 from:0 till: 191002
  bar:2004 from:0 till: 192648
  bar:2005 from:0 till: 196275

PlotData=

  bar:1900 at: 63473 fontsize:S text: 63.473 shift:(0,5)
  bar:1910 at: 62628 fontsize:S text: 62.628 shift:(0,5)
  bar:1920 at: 64861 fontsize:S text: 64.861 shift:(0,5)
  bar:1930 at: 72055 fontsize:S text: 72.055 shift:(0,5)
  bar:1940 at: 89525 fontsize:S text: 89.525 shift:(0,5)
  bar:1950 at: 107770 fontsize:S text: 107.770 shift:(0,5)
  bar:1960 at: 130900 fontsize:S text: 130.900 shift:(0,5)
  bar:1970 at: 149867 fontsize:S text: 149.867 shift:(0,5)
  bar:1981 at: 176238 fontsize:S text: 176.238 shift:(0,5)
  bar:1991 at: 184364 fontsize:S text: 184.364 shift:(0,15)
  bar:1996 at: 182269 fontsize:S text: 182.269 shift:(0,2)
  bar:1998 at: 181602 fontsize:S text: 181.602 shift:(0,15)
  bar:1999 at: 182660 fontsize:S text: 182.660 shift:(0,2)
  bar:2000 at: 183677 fontsize:S text: 183.677 shift:(0,15)
  bar:2001 at: 185091 fontsize:S text: 185.091 shift:(0,2)
  bar:2002 at: 187087 fontsize:S text: 187.087 shift:(0,15)
  bar:2003 at: 191002 fontsize:S text: 191.002 shift:(0,2)
  bar:2004 at: 192648 fontsize:S text: 192.648 shift:(0,15)
  bar:2005 at: 196275 fontsize:S text: 196.275 shift:(0,2)

TextData=
  fontsize:S pos:(20,20)
  text:Source = Instituto Nacional de Estadistica de España
| Template:Diagramme ombrothermique de Sikasso | top next |

First version by Tvpm on Monday, February 27, 2006, last update on Wednesday, April 12, 2006
ImageSize  = width:204 height:420
PlotArea   = top:20 right:30 bottom:20 left:30
AlignBars  = early
DateFormat = yyyy
Period     = from:0 till:355
TimeAxis   = orientation:vertical
ScaleMajor = unit:year increment:50 start:0 gridcolor:black

Colors=
  id:dred    value:rgb(0.6,0,0)

PlotData=
  color:blue width:10 fontsize:XS
  bar:Jv from:start till:1
  bar:F  from:start till:7
  bar:Mr from:start till:17
  bar:A  from:start till:41
  bar:M  from:start till:122
  bar:J  from:start till:162
  bar:Jt from:start till:273
  bar:At from:start till:338
  bar:S  from:start till:246
  bar:O  from:start till:105
  bar:N  from:start till:15
  bar:D  from:start till:2

LineData =
  layer:front
  from:0 till:355 atpos:173    color:black   width:0.1
  points:(31,69)(36,69)        color:red     width:0.5 #préJ
  points:(36,69)(48,74)        color:red     width:0.5 #J:24.4
  points:(48,74)(60,79)        color:red     width:0.5 #F:26.9
  points:(60,79)(72,62)        color:red     width:0.5 #M:29.7
  points:(72,62)(84,81)        color:red     width:0.5 #A:20.9
  points:(84,81)(96,76)        color:red     width:0.5 #M:30.3
  points:(96,76)(108,73)       color:red     width:0.5 #J:27.9
  points:(108,73)(120,71)      color:red     width:0.5 #J:26.3
  points:(120,71)(132,73)      color:red     width:0.5 #A:25.7
  points:(132,73)(144,76)      color:red     width:0.5 #S:26.3
  points:(144,76)(156,74)      color:red     width:0.5 #O:28
  points:(156,74)(168,69)      color:red     width:0.5 #N:26.9, D:24.3
  points:(168,69)(173,69)      color:red     width:0.5 #postD

TextData=
  pos:(8,411)   fontsize:S     text:"Précipitations"
  pos:(23,403)  fontsize:XS    text:"(mm)"
  pos:(140,411) fontsize:S     text:"Températures"
  pos:(167,403) fontsize:XS    text:"(°C)"
  pos:(180,123) fontsize:S     text:50       textcolor:dred
  pos:(180,70)  fontsize:S     text:25       textcolor:dred
  pos:(180,15)  fontsize:S     text:0        textcolor:dred
| Template:Histoire des écoles bouddhistes | top next |

First version by Nojhan on Monday, February 27, 2006, last update on Sunday, March 5, 2006
DateFormat = yyyy
ImageSize  = width:800 height:auto barincrement:15
PlotArea   = left:20 right:20 bottom:20 top:10
Colors     =
  id:blanc             value:rgb(1,1,1)
  id:noir              value:black
  id:canvas            value:gray(0.98)
  id:grilleMajor       value:gray(0.7)
  id:grilleMinor       value:gray(0.9)
  id:evenement         value:gray(0.5)
  id:bleufonce         value:rgb(0.4,0.4,0.8)
  id:bleu              value:rgb(0.45,0.45,0.80)
  id:bleuclair         value:rgb(0.65,0.65,0.90)
  id:cyan              value:rgb(0.5,0.80,0.80)
  id:cyanfonce         value:rgb(0.4,0.7,0.7)
  id:violet            value:rgb(0.80,0.45,0.80)
  id:violetfonce       value:rgb(0.7,0.4,0.7)
  id:rougefonce        value:rgb(0.7,0.2,0.2)
  id:rouge             value:rgb(0.8,0.30,0.30)
  id:rougemoy          value:rgb(0.9,0.4,0.4)
  id:rougeclair        value:rgb(0.92,0.64,0.64)
  id:rougeclair2       value:rgb(0.95,0.84,0.84)
  id:orange            value:rgb(1,0.7,0.3)
  id:orangeclair       value:rgb(1,0.8,0.4)
  id:orangesom         value:rgb(0.9,0.45,0.25)
  id:or                value:rgb(1,0.9,0)
  id:vert              value:rgb(0.30,0.8,0.30)
  id:vertmoy           value:rgb(0.45,0.88,0.45)
  id:vertclair         value:rgb(0.64,0.92,0.64)

Period     = from:-600 till:2000
TimeAxis   = orientation:horizontal format:yyyy
AlignBars  = justify
ScaleMinor = unit:year increment:20 start:-580 gridcolor:grilleMinor
ScaleMajor = unit:year increment:100 start:-600 gridcolor:grilleMajor
BackgroundColors = canvas:canvas bars:canvas
BarData=
 bar:origine
   bar:espace2
 bar:Sthavira
   bar:espace3
 bar:Pudgalavada
   bar:espace4
 bar:Sarvastivada
   bar:espace5
 bar:Vibhajyavada
   bar:espace6
 bar:Disparues
   bar:espace7
 bar:Theravada
   bar:espace1
 bar:Mahasanghika
   bar:espace8
 bar:Mahayana
   bar:espace9
 bar:Madhyamika
   bar:espace11
 bar:Yogacara
   bar:espace12
 bar:Vajrayana
   bar:espace14
 bar:ShingonTendai
   bar:espace15
 bar:tibet
   bar:espace16
 bar:TerrePure
   bar:espace17
 bar:Cimin
   bar:espace18
 bar:Tiantai
   bar:espace20
 bar:Shandao
   bar:espace19
 bar:Jodoshu
   bar:espace21
 bar:evenements1
   bar:espace13
 bar:evenements2
   bar:espace10
 bar:periodes

Define $center = anchor:from align:center
Define $left   = anchor:from align:left  shift:( 4,-4)
Define $right  = anchor:till align:right shift:(-4,-4)
Define $left2  = anchor:from align:left  shift:( 4, 3)
Define $right2 = anchor:till align:right shift:(-4, 3)

#LineData=
  # 1er concile
#  at:-500 color:grilleMajor
  # 2d concile
#  at:-383 color:grilleMajor
  # Pāṭaliputra
#  at:-250 color:grilleMajor
  # premiers écris
  #at:-110 color:grilleMajor

PlotData=
# écoles
 bar:origine width:20
   from:-563 till:-483 color:rougefonce text:"[[Gautama Bouddha|Bouddha]]" $right
   from:-483 till:-383 color:rouge text:"Première communauté" $left

 bar:Mahasanghika width:20
   from:-383 till:-100  color:rouge text:"[[Mahāsanghika]] ]" $left

 bar:Sthavira width:20
   from:-383 till:-200  color:rouge text:"[[Sthavira]] ]"  $left

 bar:Pudgalavada width:20
   from:-280 till:900  color:orange text:"[[Pudgalavāda]]" $left

 bar:Sarvastivada width:20
   from:-260 till:1200  color:orange text:"[[Sarvastivāda]] ]"  $left

 bar:Vibhajyavada width:20
   from:-250 till:1200  color:orange text:"[[Vibhajyavāda]] ]" $left

 bar:Disparues width:20
   from:-230 till:1200  color:orange text:"Autes écoles indiennes" $left

 bar:Theravada width:20
   from:-230 till:2000  color:orangesom text:"[[Theravāda]]" $left

 bar:Mahayana width:20
   from:-150 till:200 color:bleuclair text:"[[Mahāyāna|Débuts du Mahāyāna]]" $left

 bar:Madhyamika width:20
   from:200 till:700 color:bleuclair text:"[[Mādhyamika]] ]" $left

 bar:Yogacara width:20
   from:400 till:700 color:bleuclair text:"[[Yogācāra]] ]" $left

 bar:Vajrayana width:20
   from:300 till:1200 color:violet text:"[[Vajrayāna|Débuts du Vajrayāna]]" $left

 bar:tibet width:20
   from:700 till:2000 color:violetfonce text:"[[Bouddhisme tibétain]]" $left

 bar:ShingonTendai width:20
   from:806 till:2000 color:violetfonce text:"[[Shingon]]" $left

 bar:TerrePure width:20
   from:300 till:750 color:cyan text:"[[Terre pure|Débuts du Terre Pure]]" $left

 bar:Tiantai width:20
   from:550 till:2000 color:cyanfonce text:"[[Tiantai]]" $left

 bar:Shandao width:20
   from:500 till:845 color:cyan text:"[[Shandao]]" $left

 bar:Jodoshu width:20
   from:800 till:2000 color:cyanfonce text:"[[Jodo Shu]]" $left

 bar:Cimin width:20
   from:700 till:2000 color:cyanfonce text:"[[Cimin]]" $left


# évenements
 bar:evenements1 width:20
   from:-500 till:-495 color:evenement text:"1er concile"
   from:-250 till:-245 color:evenement text:"[[Concile de Pāṭaliputra|3e concile]]"
   from:100 till:105 color:evenement text:"4e concile (Jalandhar)"

 bar:evenements2 width:20
   from:-383 till:-378 color:evenement text:"2d concile"
   from:-29 till:-17 color:evenement text:"Premiers écris" $left

# périodes
 bar:periodes width:40
   from:-483 till:-261 color:vert text:"Bouddhisme ancien" $right
   from:-261 till:-232 color:vertmoy text:"[[Ashoka]]" anchor:from align:left shift:(2,-15)
   from:-232 till:100 color:vertclair text:"Greco-bouddhisme" anchor:from align:left shift:(5,5)
   from:100 till:1000 color:vert text:"Expansion Mahāyāna, déclin indien" $left
   from:1000 till:1800 color:vertmoy text:"Diffusion en Asie" $left
   from:1800 till:2000 color:vertclair text:"Réveil" $left

# espacements
 bar:espace1 width:10
 bar:espace2 width:10
 bar:espace3 width:10
 bar:espace4 width:10
 bar:espace5 width:10
 bar:espace6 width:10
 bar:espace7 width:10
 bar:espace8 width:30
 bar:espace9 width:30
 bar:espace10 width:50
 bar:espace11 width:30
 bar:espace12 width:30
 bar:espace13 width:30
 bar:espace14 width:30
 bar:espace15 width:30
 bar:espace16 width:30
 bar:espace17 width:30
 bar:espace18 width:30
 bar:espace19 width:30
 bar:espace20 width:30
 bar:espace21 width:30
| Template:Histoire des principales écoles bouddhistes | top next |

First version by Nojhan on Tuesday, February 28, 2006, last update on Sunday, March 5, 2006
DateFormat = yyyy
ImageSize  = width:800 height:auto barincrement:15
PlotArea   = left:20 right:20 bottom:20 top:10
Colors     =
  id:blanc             value:rgb(1,1,1)
  id:noir              value:black
  id:canvas            value:gray(0.98)
  id:grilleMajor       value:gray(0.7)
  id:grilleMinor       value:gray(0.9)
  id:evenement         value:gray(0.5)
  id:bleufonce         value:rgb(0.4,0.4,0.8)
  id:bleu              value:rgb(0.45,0.45,0.80)
  id:bleuclair         value:rgb(0.65,0.65,0.90)
  id:cyan              value:rgb(0.5,0.80,0.80)
  id:cyanfonce         value:rgb(0.4,0.7,0.7)
  id:violet            value:rgb(0.80,0.45,0.80)
  id:violetfonce       value:rgb(0.7,0.4,0.7)
  id:rougefonce        value:rgb(0.7,0.2,0.2)
  id:rouge             value:rgb(0.8,0.30,0.30)
  id:rougemoy          value:rgb(0.9,0.4,0.4)
  id:rougeclair        value:rgb(0.92,0.64,0.64)
  id:rougeclair2       value:rgb(0.95,0.84,0.84)
  id:orange            value:rgb(1,0.7,0.3)
  id:orangeclair       value:rgb(1,0.8,0.4)
  id:orangesom         value:rgb(0.9,0.45,0.25)
  id:or                value:rgb(1,0.9,0)
  id:vert              value:rgb(0.30,0.8,0.30)
  id:vertmoy           value:rgb(0.45,0.88,0.45)
  id:vertclair         value:rgb(0.64,0.92,0.64)

Period     = from:-600 till:2000
TimeAxis   = orientation:horizontal format:yyyy
AlignBars  = justify
ScaleMinor = unit:year increment:20 start:-580 gridcolor:grilleMinor
ScaleMajor = unit:year increment:100 start:-600 gridcolor:grilleMajor
BackgroundColors = canvas:canvas bars:canvas
BarData=
 bar:origine
   bar:espace2
 bar:Sthavira
   bar:espace3
 bar:Disparues
   bar:espace7
 bar:Theravada
   bar:espace1
 bar:Mahasanghika
   bar:espace8
 bar:Mahayana
   bar:espace9
 bar:ChanZen
   bar:espace14
 bar:Vajrayana
   bar:espace13
 bar:TerrePure
   bar:espace17
 bar:evenements2
   bar:espace10
 bar:periodes

Define $center = anchor:from align:center
Define $left   = anchor:from align:left  shift:( 4,-4)
Define $right  = anchor:till align:right shift:(-4,-4)
Define $left2  = anchor:from align:left  shift:( 4, 3)
Define $right2 = anchor:till align:right shift:(-4, 3)

#LineData=
  # 1er concile
#  at:-500 color:grilleMajor
  # 2d concile
#  at:-383 color:grilleMajor
  # Pāṭaliputra
#  at:-250 color:grilleMajor
  # premiers écris
  #at:-110 color:grilleMajor

PlotData=
# écoles
 bar:origine width:20
   from:-563 till:-483 color:rougefonce text:"[[Gautama Bouddha|Bouddha]]" $right
   from:-483 till:-383 color:rouge text:"Première communauté" $left

 bar:Mahasanghika width:20
   from:-383 till:-100  color:rouge text:"[[Mahāsanghika]] *" $left

 bar:Sthavira width:20
   from:-383 till:-200  color:rouge text:"[[Sthavira]] *"  $left

 bar:Disparues width:20
   from:-280 till:1200  color:orange text:"Écoles indiennes" $left

 bar:Theravada width:20
   from:-230 till:2000  color:orangesom text:"[[Theravāda]]" $left

 bar:Mahayana width:20
   from:-150 till:700 color:bleuclair text:"[[Mahāyāna|Débuts du Mahāyāna]]" $left

 bar:Vajrayana width:20
   from:300 till:2000 color:violet text:"[[Vajrayāna|Vajrayāna]]" $left

 bar:TerrePure width:20
   from:300 till:2000 color:vertclair text:"[[Terre pure]]" $left

 bar:ChanZen width:20
   from:600 till:2000 color:cyan text:"Chan & Zen" $left

# périodes
 bar:periodes width:40
   from:-483 till:650 color:vert text:"Diffusion autour de l'Inde" $left
   from:650 till:1050 color:vertmoy text:"Déclin Indien" $left
   from:1050 till:1850 color:vertclair text:"Trois courants : Tibet, Chine, Ceylan" $left
   from:1850 till:2000 color:vert text:"Occident" $left

# espacements
 bar:espace1 width:10
 bar:espace2 width:10
 bar:espace3 width:10
# bar:espace4 width:10
# bar:espace5 width:10
# bar:espace6 width:10
 bar:espace7 width:10
 bar:espace8 width:30
 bar:espace9 width:30
 bar:espace10 width:50
# bar:espace11 width:30
# bar:espace12 width:30
 bar:espace13 width:30
 bar:espace14 width:30
# bar:espace15 width:30
# bar:espace16 width:30
 bar:espace17 width:30
# bar:espace18 width:30
# bar:espace19 width:30
# bar:espace20 width:30
# bar:espace21 width:30
| Saint-Leu-la-Forêt | top next |

Initial version by 192.85.50.1 on Friday, July 28, 2006
Colors=
  id:lightgrey value:gray(0.9)
  id:darkgrey  value:gray(0.7)
  id:sfondo value:rgb(1,1,1)
  id:barra value:rgb(0.6,0.7,0.8)

ImageSize  = width:500 height:323
PlotArea   = left:50 bottom:50 top:30 right:30
DateFormat = x.y
Period     = from:0 till:18000
TimeAxis   = orientation:vertical
AlignBars  = justify
ScaleMajor = gridcolor:darkgrey increment:5000 start:0
ScaleMinor = gridcolor:lightgrey increment:1000 start:0
BackgroundColors = canvas:sfondo

BarData=
  bar:1962 text:1962
  bar:1968 text:1968
  bar:1975 text:1975
  bar:1982 text:1982
  bar:1990 text:1990
  bar:1999 text:1999

PlotData=
  color:barra width:30 align:left

  bar:1962 from:0 till: 8802
  bar:1968 from:0 till: 10004
  bar:1975 from:0 till: 9664
  bar:1982 from:0 till: 11627
  bar:1990 from:0 till: 14489
  bar:1999 from:0 till: 15127

PlotData=

  bar:1962 at: 8802 fontsize:S text: 8.802 shift:(-12,5)
  bar:1968 at: 10004 fontsize:S text: 10.004 shift:(-16,5)
  bar:1975 at: 9664 fontsize:S text: 9.664 shift:(-12,5)
  bar:1982 at: 11627 fontsize:S text: 11.627 shift:(-16,5)
  bar:1990 at: 14489 fontsize:S text: 14.489 shift:(-16,5)
  bar:1999 at: 15127 fontsize:S text: 15.127 shift:(-16,5)

TextData=
  fontsize:S pos:(30,20)
  text:source INSEE
| Anciens maïeurs d'Amiens | top next |
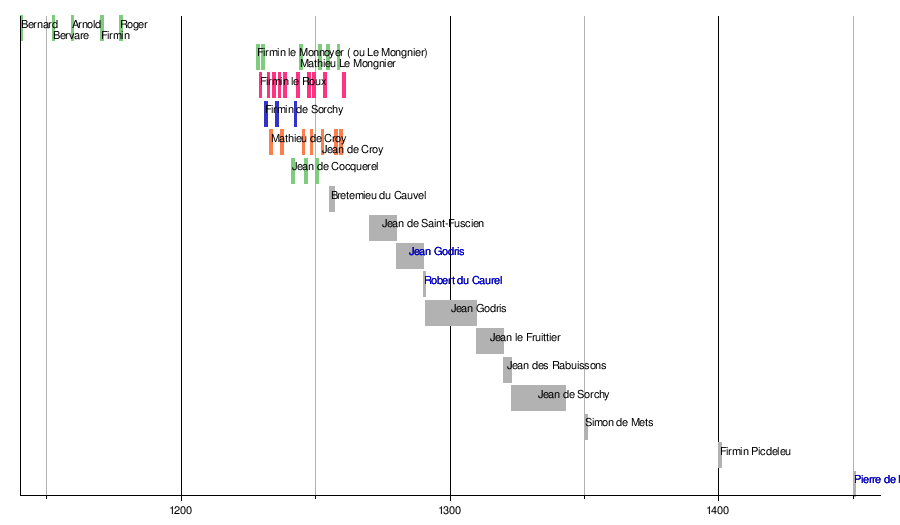
Initial version by VIGNERON on Thursday, May 18, 2006
DateFormat = yyyy
ImageSize  = width:900 height:auto barincrement:30
PlotArea   = left:20 right:20 bottom:30 top:15

Colors     =
  id:gris     value:gray(0.7)
  id:rouge    value:rgb(1,0.2,0.5)
  id:vert     value:rgb(0.5,0.8,0.5)
  id:bleu     value:rgb(0.2,0.2,0.8)
  id:orange   value:rgb(1,0.5,0.3)

Period = from:1140 till:1460
TimeAxis   = orientation:horizontal format:yyyy
ScaleMajor = unit:year  increment:100 start:1200 gridcolor:black
ScaleMinor = unit:year  increment:100 start:1150 gridcolor:gris
AlignBars  = justify


BarData=
  bar:premier
  bar:Mongnier
  bar:Roux
  bar:Sorchy
  bar:Croy
  bar:Cocquerel
  barset:divers

PlotData =

  bar:Mongnier color:vert
 from:1228 till:1229 text:Firmin_le_Monnoyer_(_ou_Le_Mongnier)
 from:1230 till:1231
 from :1244 till :1245 text:~Mathieu_Le_Mongnier
 from :1251 till :1252
 from :1254 till :1255
 from :1258 till :1259

 bar:Roux color:rouge
 from:1229 till:1230 text:Firmin_le_Roux
 from:1232 till:1233
 from:1234 till:1235
 from:1236 till:1237
 from:1238 till:1239
 from:1243 till:1244
 from:1247 till:1248
 from:1249 till:1250
 from:1253 till:1254
 from:1260 till:1261

 bar:Sorchy color:bleu
 from:1231 till:1232 text:Firmin_de_Sorchy
 from:1235 till:1236
 from:1242 till:1243

 bar:Croy color:orange
 from:1233 till:1234 text:Mathieu_de_Croy
 from:1237 till:1238
 from:1245 till:1246
 from:1248 till:1249
 from:1252 till:1253 text:~Jean_de_Croy
 from:1257 till:1258
 from:1259 till:1260

  bar:Cocquerel color:vert
 from:1241 till:1242 text:Jean_de_Cocquerel
 from:1246 till:1247
 from:1250 till:1251

  bar:premier
 from:1140 till:1141 text:Bernard
 from:1152 till:1153 text:~Bervare
 from:1159 till:1160 text:Arnold
 from:1170 till:1171 text:~Firmin
 from:1177 till:1178 text:Roger

  barset:divers color:gris
 from:1255 till:1257 text:Bretemieu_du_Cauvel
 from:1270 till:1280 text:Jean_de_Saint-Fuscien
 From:1280 till :1290 text:[[Jean_Godris]]
 From:1290 till :1291 text:[[Robert_du_Caurel]]
 From:1291 till:1310 text:Jean_Godris
 From:1310 till:1320 text:Jean_le_Fruittier
 from:1320 till:1323 text:Jean_des_Rabuissons
 from:1323 till:1343 text:Jean_de_Sorchy
 from:1350 till:1351 text:Simon_de_Mets
 from:1400 till:1401 text:Firmin_Picdeleu
 from:1450 till:1451 text:[[Pierre_de_May]]
| Template:Frise Chronologique Iran | top next |

First version by Fabienkhan on Thursday, March 30, 2006, last update on Sunday, April 2, 2006
Preset    = TimeHorizontal_AutoPlaceBars_UnitYear
ImageSize = width:820 barincrement:22
PlotArea  = left:20 right:47 bottom:40
Colors    =
  id:canvas  value:rgb(0.97,0.97,0.97)
  id:white  value:rgb(1,1,1)
  id:subtitle  value:gray(0.8)
  id:grid1   value:gray(0.7)
  id:grid2   value:gray(0.88)
  id:black   value:rgb(0,0,0)
  id:events value:rgb(0.75,1,0.75)
  id:mark1   value:rgb(0,0.7,0)
  id:mark2    value:rgb(0.7,0,0)
  id:years    value:gray(0.5)
  id:period1  value:rgb(1,1,0)
  id:period2  value:rgb(1,0.75,0)
  id:Mil value:rgb(1,0.8,0.4)
  id:sec   value:yellow          legend:post-Islam
  id:red   value:red          legend:pré-Islam

BackgroundColors = canvas:canvas
Period     = from:-3000 till:2000
ScaleMajor = unit:year increment:500 start:-3000 gridcolor:grid1
ScaleMinor = unit:year increment:100 start:-3000 gridcolor:grid2
AlignBars  = justify

BarData=
  bar:title_empires
  bar:hist1
  bar:hist2
  bar:hist3
  bar:hist4
  bar:hist5
  bar:hist6
  bar:hist7
  bar:hist8
  bar:hist9
  bar:title_empires

PlotData =
  mark:(line,black)
  fontsize:XS
  width:13
  shift:(5,-6)
  bar:title_empires    from:start till:end text:"Dynasties d'Iran" fontsize:M anchor:middle align:center width:10 color:subtitle

  bar:hist1
  from:-2700 till:-700 shift:(100,-5) fontsize:S color:red text:[[Élamites]]
  from:-333 till:-60 shift:(2,-5)  fontsize:S color:red text:[[Séleucides]]
  from:224 till:651 shift:(5,-5)  fontsize:S color:red text:[[Sassanides]]
  from:861 till:1003 shift:(-2,-5)  fontsize:S color:sec text:[[Saffarides]]
  from:1256 till:1353 shift:(0,-5) fontsize:S color:sec text:[[Houlagides]]
  from:1750 till:1794 shift:(0,-5) fontsize:S color:sec text:[[Dynastie Zand]]

  bar:hist2
  from:-3000 till:-700 shift:(100,-5) fontsize:S color:red text:[[civilisation de Jiroft]]
  from:-500 till:-333 shift:(-5,-5)  fontsize:S color:red text:[[Achéménides]]
  from:651 till:821 shift:(-20,-5) fontsize:S color:sec text:[[Conquête Islamique de l'Iran|Domination Arabe]]
  from:1314 till:1393 shift:(0,-5) fontsize:S color:sec text:[[Muzaffarides]]

  bar:hist3
  from:-3000 till:-2700 shift:(3,0) fontsize:S color:red text:[[Période proto-élamite|Période]]
  from:-3000 till:-2700 shift:(1,-9) fontsize:S color:red text:[[Période proto-élamite|proto-élamite]]
  from:-2500 till:-2100 shift:(5,-5) fontsize:S color:red text:[[Aratta]]
  from:-700 till:-500 shift:(2,-5)  fontsize:S color:red text:[[Mèdes]]
  from:-190 till:224 shift:(5,-5)  fontsize:S color:red text:[[Parthie|Parthes]]
  from:821 till:873 shift:(-5,-5) fontsize:S color:sec text:[[Tahirides]]
  from:1736 till:1802 shift:(0,-5) fontsize:S color:sec text:[[Afsharides]]

  bar:hist4
  from:-1000 till:-700 shift:(0,-5)  fontsize:S color:red text:[[Mannéens]]
  from:928 till:1043 shift:(-5,-5) fontsize:S color:sec text:[[Ziyarides]]
  from:1370 till:1500 shift:(-2,-5) fontsize:S color:sec text:[[Timourides]]
  from:1781 till:1925 shift:(0,-5) fontsize:S color:sec text:[[Dynastie Kadjar|Dynastie Qajar]]

  bar:hist5
  from:875 till:999 shift:(-5,-5) fontsize:S color:sec text:[[Samanides]]
  from:1501 till:1736 shift:(0,-5) fontsize:S color:sec text:[[Safavides]]

  bar:hist6
  from:934 till:1055 shift:(-5,-5) fontsize:S color:sec text:[[Bouyides]]
  from:1979 till:end shift:(-5,-5)  fontsize:S color:sec text:[[Iran|R.I.Iran]]

  bar:hist7
  from:992 till:1231 shift:(0,-5)  fontsize:S color:sec text:[[Khwârazm-Shahs|Khorezmiens]]
  from:1925 till:1979 shift:(0,-5)  fontsize:S color:sec text:[[dynastie Pahlavi|Pahlavi]]

  bar:hist8
  from:963 till:1187 shift:(0,-5) fontsize:S color:sec text:[[Ghaznévides]]

  bar:hist9
  from:864 till:928 shift:(-15,0) fontsize:S color:sec text:[[Alavides]]
  from:1037 till:1187 shift:(-5,-9) fontsize:S color:sec text:[[Seldjoukides]]
| Template:Frise plotzensee | top next |

First version by Cloclob on Sunday, April 9, 2006, last update on Friday, April 14, 2006
ImageSize  = width:365 height:420
PlotArea   = top:20 right:20 bottom:20 left:30
AlignBars  = early
DateFormat = yyyy
Period     = from:0 till:1200
TimeAxis   = orientation:vertical
ScaleMajor = unit:year increment:100 start:0 gridcolor:black

Colors=
  id:dred    value:rgb(0.9,0.7,0)
  id:gui     value:rgb(0.2,0.6,0.1)
  id:gp      value:rgb(0.4,0.2,0.1)

PlotData=
  color:red width:18 fontsize:XS
  bar:33 from:start till:4
  bar:34 from:start till:13
  bar:35 from:start till:21
  bar:36 from:start till:7
  color:gui
  bar:37 from:start till:38
  bar:38 from:start till:55
  bar:39 from:start till:95
  bar:40 from:start till:190
  bar:41 from:start till:87
  bar:42 from:start till:535
  color:gp
  bar:42 from:530  till:535
  bar:43 from:start till:1180
  bar:44 from:start till:534
  bar:45 from:start till:132

  bar:42 at:530 mark:(line,orange)

LineData =
  layer:front
  from:0 till:1200 atpos:346    color:black   width:0.1

TextData=
  pos:(8,410)   fontsize:S     text:"Exécutions"
  pos:(26,0)   fontsize:S     text:"Années"
  pos:(37,40)   fontsize:S     text:4       textcolor:dred
  pos:(55,40)   fontsize:S     text:13      textcolor:dred
  pos:(80,40)   fontsize:S     text:21      textcolor:dred
  pos:(105,40)  fontsize:S     text:7       textcolor:dred
  pos:(126,40)  fontsize:S     text:38      textcolor:dred
  pos:(150,40)  fontsize:S     text:55      textcolor:dred
  pos:(140,200)  fontsize:S   text:"Début des pendaisons" textcolor:black
  pos:(140,190)  fontsize:S   text:"de l'Orchestre rouge" textcolor:black
  pos:(37,370)   fontsize:S     text:"* Exécutions à la hache" textcolor:red
  pos:(37,355)   fontsize:S     text:"* Exécutions par guillotine" textcolor:gui
  pos:(37,340)   fontsize:S     text:"* Exécutions guillotine et pendaisons" textcolor:gp
| Template:Chronologie du siècle des Lumières | top next |

First version by Romram on Tuesday, April 11, 2006, last update on Friday, June 9, 2006
DateFormat = yyyy
ImageSize = width:800 height:auto barincrement:38
PlotArea = left:20 right:20 bottom:20 top:10
Colors =
  id:noir              value:black
  id:bleuclair         value:rgb(0.76,0.76,0.96)
  id:bleu              value:rgb(0.50,0.50,0.98)
  id:gris              value:gray(0.80)
  id:canvas            value:rgb(0.97,0.97,0.97)
  id:grilleMajor       value:rgb(0.80,0.80,0.80)
  id:grilleMinor       value:rgb(0.86,0.86,0.86)

Period     = from:1645 till:1830
TimeAxis   = orientation:horizontal format:yyyy
ScaleMinor = unit:year increment:10 start:1650 gridcolor:grilleMinor
ScaleMajor = unit:year increment:50 start:1700 gridcolor:grilleMajor

BackgroundColors = canvas:canvas bars:canvas
BarData=
  bar:epoque
  barset:evenemment


PlotData=
  bar:epoque shift:(0,0) width:30
  from:start till:end color:gris # Arrière plan

  from:start till:1645  text:" " color:gris
  from:1688  till:1800  text:"Siècle des Lumières" color:bleu fontsize:M align:center
  from:1801  till:end   text:" " color:gris

  barset:evenemment color:bleuclair shift:(2,0) width:17

  from:1648  till:1648  text:"[[1648]]~[[Traité de Westphalie]]" color:noir anchor:from
  from:1688  till:1688  text:"[[1688]]~[[Glorieuse Révolution|Révolution anglaise]]" color:noir
  from:1689  till:1755  text:"[[Montesquieu (philosophe)|1689-1755  Montesquieu]]" anchor:from
  from:1694  till:1778  text:"[[Voltaire|1694-1778  Voltaire]]" anchor:from
  from:1706  till:1790  text:"[[Benjamin Franklin|1706-1790  Benjamin Franklin]]" anchor:from
  from:1712  till:1778  text:"[[Jean-Jacques Rousseau|1712-1778  Jean-Jacques Rousseau]]" anchor:from
  from:1713  till:1784  text:"[[Denis Diderot|1713-1784  Denis Diderot]]" anchor:from
  from:1717  till:1783  text:"[[Jean le Rond d'Alembert|1717-1783  D'Alembert]]" anchor:from
  from:1723  till:1790  text:"[[Adam Smith|1723-1790  Adam Smith]]" anchor:from
  from:1724  till:1804  text:"[[Emmanuel Kant|1724-1804  Emmanuel Kant]]" anchor:from
  from:1743  till:1826  text:"[[Thomas Jefferson|1743-1826  Thomas Jefferson]]" anchor:from

  #Recommencer l'indentation en haut
  barset:break
  from:1751  till:1751  text:"[[1751]]~[[Encyclopédie ou dictionnaire raisonné des sciences, des arts et des métiers|1re parution de l'Encyclopédie]]" anchor:from  color:noir
  from:1776  till:1776  text:"[[1776]]~[[Déclaration d'indépendance des États-Unis d'Amérique|Déclaration d'indépendance des États-Unis]]" anchor:from  color:noir
  from:1789  till:1789  text:"[[1789]]~[[Révolution française]]" anchor:from  color:noir
| Orgosolo | top next |

Initial version by Yugiz on Thursday, April 13, 2006
Colors=
  id:lightgrey value:gray(0.9)
  id:darkgrey  value:gray(0.7)
  id:sfondo value:rgb(1,1,1)
  id:barra value:rgb(0.6,0.7,0.8)

ImageSize  = width:455 height:373
PlotArea   = left:50 bottom:50 top:30 right:30
DateFormat = x.y
Period     = from:0 till:5000
TimeAxis   = orientation:vertical
AlignBars  = justify
ScaleMajor = gridcolor:darkgrey increment:500 start:0
ScaleMinor = gridcolor:lightgrey increment:100 start:0
BackgroundColors = canvas:sfondo

BarData=
  bar:1861 text:1861
  bar:1871 text:1871
  bar:1881 text:1881
  bar:1901 text:1901
  bar:1911 text:1911
  bar:1921 text:1921
  bar:1931 text:1931
  bar:1936 text:1936
  bar:1951 text:1951
  bar:1961 text:1961
  bar:1971 text:1971
  bar:1981 text:1981
  bar:1991 text:1991
  bar:2001 text:2001

PlotData=
  color:barra width:20 align:left

  bar:1861 from:0 till: 2133
  bar:1871 from:0 till: 2162
  bar:1881 from:0 till: 2207
  bar:1901 from:0 till: 2845
  bar:1911 from:0 till: 3181
  bar:1921 from:0 till: 3158
  bar:1931 from:0 till: 3411
  bar:1936 from:0 till: 3563
  bar:1951 from:0 till: 4250
  bar:1961 from:0 till: 4638
  bar:1971 from:0 till: 4801
  bar:1981 from:0 till: 4896
  bar:1991 from:0 till: 4779
  bar:2001 from:0 till: 4538

PlotData=

  bar:1861 at: 2133 fontsize:S text: 2133 shift:(-8,5)
  bar:1871 at: 2162 fontsize:S text: 2162 shift:(-10,5)
  bar:1881 at: 2207 fontsize:S text: 2207 shift:(-10,5)
  bar:1901 at: 2845 fontsize:S text: 2845 shift:(-10,5)
  bar:1911 at: 3181 fontsize:S text: 3181 shift:(-10,5)
  bar:1921 at: 3158 fontsize:S text: 3158 shift:(-10,5)
  bar:1931 at: 3411 fontsize:S text: 3411 shift:(-10,5)
  bar:1936 at: 3563 fontsize:S text: 3563 shift:(-10,5)
  bar:1951 at: 4250 fontsize:S text: 4250 shift:(-10,5)
  bar:1961 at: 4638 fontsize:S text: 4638 shift:(-10,5)
  bar:1971 at: 4801 fontsize:S text: 4801 shift:(-10,5)
  bar:1981 at: 4896 fontsize:S text: 4896 shift:(-10,5)
  bar:1991 at: 4779 fontsize:S text: 4779 shift:(-10,5)
  bar:2001 at: 4538 fontsize:S text: 4538 shift:(-10,5)

TextData=
  fontsize:S pos:(20,20)
  text:source ISTAT - Elaboration graphique de Wikipédia
| Template:ChronologieSarde1 | top next |
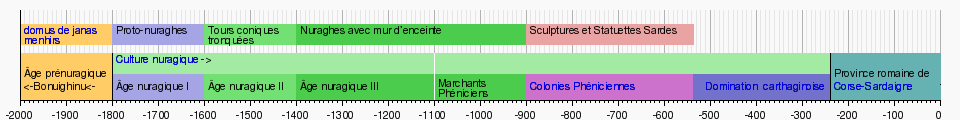
First version by Yugiz on Sunday, April 16, 2006, last update on Friday, July 21, 2006
DateFormat = yyyy
ImageSize  = width:960 height:auto barincrement:15
PlotArea   = left:20 right:20 bottom:20 top:10
Colors     =
  id:blanc             value:rgb(1,1,1)
  id:noir              value:black
  id:canvas            value:gray(0.98)
  id:grilleMajor       value:gray(0.7)
  id:grilleMinor       value:gray(0.9)
  id:evenement         value:gray(0.5)
  id:bleufonce         value:rgb(0.4,0.4,0.8)
  id:bleu              value:rgb(0.45,0.45,0.80)
  id:bleuclair         value:rgb(0.65,0.65,0.90)
  id:cyan              value:rgb(0.5,0.80,0.80)
  id:cyanfonce         value:rgb(0.4,0.7,0.7)
  id:violet            value:rgb(0.80,0.45,0.80)
  id:violetfonce       value:rgb(0.7,0.4,0.7)
  id:rougefonce        value:rgb(0.7,0.2,0.2)
  id:rouge             value:rgb(0.8,0.30,0.30)
  id:rougemoy          value:rgb(0.9,0.4,0.4)
  id:rougeclair        value:rgb(0.92,0.64,0.64)
  id:rougeclair2       value:rgb(0.95,0.84,0.84)
  id:orange            value:rgb(1,0.7,0.3)
  id:orangeclair       value:rgb(1,0.8,0.4)
  id:orangesom         value:rgb(0.9,0.45,0.25)
  id:or                value:rgb(1,0.9,0)
  id:vert              value:rgb(0.30,0.8,0.30)
  id:vertmoy           value:rgb(0.45,0.88,0.45)
  id:vertclair         value:rgb(0.64,0.92,0.64)


Period     = from:-2000 till:0
TimeAxis   = orientation:horizontal format:yyyy
AlignBars  = justify
ScaleMinor = unit:year increment:10 start:-2000 gridcolor:grilleMinor
ScaleMajor = unit:year increment:100 start:-2000 gridcolor:grilleMajor
BackgroundColors = canvas:canvas bars:canvas
BarData=
 bar:archeo
   bar:espace3
 bar:origine
   bar:espace2
 bar:periodes
   bar:espace21
 bar:evenement


Define $center = anchor:from align:center
Define $left   = anchor:from align:left  shift:( 4,-13)
Define $right  = anchor:till align:right shift:(-4,-4)
Define $left2  = anchor:from align:left  shift:( 4, 0)
Define $right2 = anchor:till align:right shift:(-4, 3)
Define $left3  = anchor:from align:left  shift:( 4, -10)
Define $left4  = anchor:from align:left  shift:( 4, -20)

PlotData=
# événements
 bar:evenement width:47
   from:-2000 till:-1800 color:orangeclair text:"Âge prénuragique" $left2
   from:-2000 till:-1800 color:orangeclair text:"<-Bonuighinu<-" $left
   at:-1800 mark:(line, black)
   from:-1800 till:-1600 color:bleuclair  text:"Âge nuragique I" $left
   from:-1600 till:-1400 color:vertmoy text:"Âge nuragique II" $left
   from:-1400 till:-1100 color:vert text:"Âge nuragique III" $left

   from:-1100 till:-900 color:vert text:"Marchants" $left3
   from:-1100 till:-900 color:vert text:"Phéniciens" $left4
   at:-1100 mark:(line, blanc)

   from:-900 till:-535 color:violet text:"[[Phéniciens|Colonies Phéniciennes]]" $left

   from:-535 till:-239 color:bleu text:"   [[carthaginois|Domination  carthaginoise]]" $left

   from:-239 till:0 color:cyanfonce text:"Province romaine de" $left2
   from:-239 till:0 color:cyanfonce text:"[[Corse-Sardaigne]]" $left
   at:-239 mark:(line, black)

# périodes
 bar:periodes width:20
   from:-1800 till:-239 color:vertclair text:"[[Culture nuragique]] ->" $left2

# archeo
 bar:archeo width:20
   from:-2000 till:-1800 color:orangeclair text:"[[domus de janas]]" $left2
   from:-2000 till:-1800 color:orangeclair text:"[[menhirs]]" $left3
   from:-1800 till:-1600 color:bleuclair  text:"Proto-nuraghes" $left2
   from:-1600 till:-1400 color:vertmoy text:"Tours coniques" $left2
   from:-1600 till:-1400 color:vertmoy text:"tronquées " $left3
   from:-1400 till:-900 color:vert text:"Nuraghes avec mur d’enceinte " $left2
   from:-900 till:-535 color:rougeclair text:"Sculptures et Statuettes Sardes" $left2

# espacements
 bar:espace2 width:10
 bar:espace3 width:40
 bar:espace21 width:40
| Template:ChronologieSarde2 | top next |

First version by Yugiz on Sunday, April 16, 2006, last update on Friday, July 21, 2006
 DateFormat = yyyy
ImageSize  = width:960 height:auto barincrement:15
PlotArea   = left:10 right:30 bottom:20 top:30
Colors     =
  id:blanc             value:rgb(1,1,1)
  id:noir              value:black
  id:canvas            value:gray(0.98)
  id:grilleMajor       value:gray(0.7)
  id:grilleMinor       value:gray(0.9)
  id:evenement         value:gray(0.5)
  id:bleufonce         value:rgb(0.4,0.4,0.8)
  id:bleu              value:rgb(0.45,0.45,0.80)
  id:bleuclair         value:rgb(0.65,0.65,0.90)
  id:cyan              value:rgb(0.5,0.80,0.80)
  id:cyanfonce         value:rgb(0.4,0.7,0.7)
  id:violet            value:rgb(0.80,0.45,0.80)
  id:violetfonce       value:rgb(0.7,0.4,0.7)
  id:rougefonce        value:rgb(0.7,0.2,0.2)
  id:rouge             value:rgb(0.8,0.30,0.30)
  id:rougemoy          value:rgb(0.9,0.4,0.4)
  id:rougeclair        value:rgb(0.92,0.64,0.64)
  id:rougeclair2       value:rgb(0.95,0.84,0.84)
  id:orange            value:rgb(1,0.7,0.3)
  id:orangeclair       value:rgb(1,0.8,0.4)
  id:orangesom         value:rgb(0.9,0.45,0.25)
  id:or                value:rgb(1,0.9,0)
  id:vert              value:rgb(0.30,0.8,0.30)
  id:vertmoy           value:rgb(0.45,0.88,0.45)
  id:vertclair         value:rgb(0.64,0.92,0.64)

Period     = from:0 till:2006
TimeAxis   = orientation:horizontal format:yyyy
AlignBars  = justify
ScaleMinor = unit:year increment:10 start:0 gridcolor:grilleMinor
ScaleMajor = unit:year increment:100 start:0 gridcolor:grilleMajor
BackgroundColors = canvas:canvas bars:canvas
BarData=
 bar:periodes2
   bar:espace0
 bar:événement
   bar:espace3
 bar:periodes

Define $center = anchor:from align:center shift:( 10,30)
Define $center2 = anchor:from align:center shift:( 10,20)
Define $center3 = anchor:from align:center shift:( 10,40)
Define $center4 = anchor:from align:center shift:( 10,30)
Define $left   = anchor:from align:left  shift:( 4,-5)
Define $right  = anchor:till align:right shift:(-4,-4)
Define $left2  = anchor:from align:left  shift:( 0,35)
Define $right2 = anchor:till align:right shift:(-4, 3)
Define $left3  = anchor:from align:left  shift:( 0,25)
Define $left4  = anchor:from align:left  shift:( 4,-15)

#LineData=


PlotData=

# périodes
 bar:periodes width:40
   from:0 till:460 color:cyan text:"    [[Corse-Sardaigne|Province Romaine de Corse-Sardaigne]]" $left
   from:460 till:530 color:vertclair text:"Razzia" $left
   from:460 till:530 color:vertclair text:"[[Vandales]]" $left4
   from:530 till:1014 color:vert text:"             [[Byzance|Domination de Byzance]]" $left
   from:1014 till:1297 color:bleu text:"     [[Judicat|Les 4 Giudicati sardes]]" $left
   from:1297 till:1479 color:cyanfonce text:"      Domination" $left
   from:1297 till:1479 color:cyanfonce text:"      [[Royaume d'Aragon|Aragonaise]]" $left4
   from:1479 till:1708 color:vert text:"[[Espagne|Domination Espagnole]]" $left
   from:1708 till:1718 color:violet
   from:1718 till:1861 color:bleu text:"[[Royaume de Sardaigne|Royaume de]]" $left
   from:1718 till:1861 color:bleu text:"[[Royaume de Sardaigne|Sardaigne]] " $left4
   from:1861 till:1946 color:vert text:"[[Royaume d'Italie|Royaume]]" $left
   from:1861 till:1946 color:vert text:"[[Royaume d'Italie|d'Italie]]" $left4
   from:1946 till:2006 color:rouge text:"[[République]]" $left4
   at:1014 mark:(line, black)


 bar:événement width:50
   from:1013 till:1015 color:black text:"Défaite de Museto" $center
   from:1409 till:1411 color:black text:"Fin de l'indépendance" $center3
   from:1409 till:1411 color:black text:"[[Judicat d'Arborée|du Judicat d'Arborée]]" $center4
   from:1717 till:1719 color:black text:"[[Traité de Londres]]" $center

# périodes2
 bar:periodes2 width:20
   from:1297 till:1410 color:bleu
| Template:ÂgePrénuragique | top next |
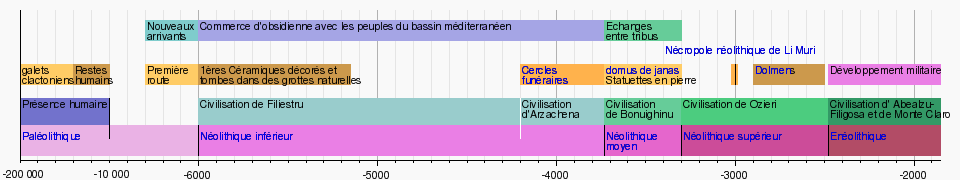
First version by Yugiz on Wednesday, April 19, 2006, last update on Friday, July 21, 2006
DateFormat = yyyy
ImageSize  = width:960 height:auto barincrement:15
PlotArea   = left:20 right:20 bottom:20 top:10
Colors     =
  id:blanc             value:rgb(1,1,1)
  id:noir              value:black
  id:canvas            value:gray(0.98)
  id:grilleMajor       value:gray(0.7)
  id:grilleMinor       value:gray(0.9)

  id:bleu              value:rgb(0.45,0.45,0.80)


  id:cyan              value:rgb(0.5,0.80,0.80)
  id:cyanfonce         value:rgb(0.4,0.7,0.7)

  id:rougefonce        value:rgb(0.7,0.3,0.4)
  id:rouge             value:rgb(0.8,0.3,0.60)
  id:rougemoy          value:rgb(0.9,0.4,0.8)
  id:rougeclair        value:rgb(0.92,0.5,0.9)
  id:rougeclair2        value:rgb(0.92,0.7,0.9)

  id:orange            value:rgb(1,0.7,0.3)
  id:orangeclair       value:rgb(1,0.8,0.4)
  id:orange2            value:rgb(0.8,0.5,0.2)
  id:orangeclair2       value:rgb(0.8,0.6,0.3)

  id:vertfonce         value:rgb(0.20,0.60,0.40)
  id:vert              value:rgb(0.30,0.80,0.50)
  id:vertmoy           value:rgb(0.40,0.80,0.60)
  id:vertclair         value:rgb(0.60,0.80,0.80)
  id:bleuclair         value:rgb(0.65,0.65,0.90)


Period     = from:-7000 till:-1855
TimeAxis   = orientation:horizontal format:yyyy
AlignBars  = justify
ScaleMinor = unit:year increment:100 start:-7000 gridcolor:grilleMinor
ScaleMajor = unit:year increment:1000 start:-6000 gridcolor:grilleMajor
BackgroundColors = canvas:canvas bars:canvas
BarData=
 bar:societe
   bar:espace1
   bar:espace5
   bar:espace6
 bar:archeo
   bar:espace3
 bar:origine
   bar:espace2
  bar:civilisation
   bar:espace4
  bar:age


Define $center = anchor:from align:center shift:( 4,30)
Define $center2 = anchor:from align:center shift:( 4,20)
Define $center3 = anchor:from align:center shift:( 4,-60)
Define $left   = anchor:from align:left  shift:( 2,10)
Define $right  = anchor:till align:right shift:(-4,-4)
Define $left2  = anchor:from align:left  shift:( 4, 5)
Define $right2 = anchor:till align:right shift:(-4, 13)
Define $left3  = anchor:from align:left  shift:( 2, 0)
Define $left4  = anchor:from align:left  shift:( 2, -10)

PlotData=
# Âge
 bar:age width:30
   from:-7000 till:-6000 color:rougeclair2 text:"[[Paléolithique]]" $left3
   at:-6000 mark:(line, black)
   from:-6000 till:-3730 color:rougeclair text:"[[Néolithique inférieur]]" $left3
   at:-3730 mark:(line, black)
   from:-3730 till:-3300 color:rougemoy text:"[[Néolithique moyen|Néolithique]]" $left3
   from:-3730 till:-3300 color:rougemoy text:"[[Néolithique moyen|moyen]]" $left4
   at:-3300 mark:(line, black)
   from:-3300 till:-2480 color:rouge text:"[[Néolithique supérieur]]" $left3
   at:-2480 mark:(line, black)
   from:-2480 till:-1855 color:rougefonce text:"[[Enéolithique]]" $left3

# civilisations
 bar:civilisation width:40
   from:-7000 till:-6500 color:bleu text:"Présence humaine" $left
   from:-7000 till:-7000 color:bleu text:"-200 000" $center3
   from:-6500 till:-6500 color:bleu text:"-10 000" $center3
   at:-6500 mark:(line, black)

   from:-6000 till:-4200 color:vertclair text:"Civilisation de Filiestru" $left


   from:-4200 till:-3730 color:vertclair text:"Civilisation" $left
   from:-4200 till:-3730 color:vertclair text:"d'Arzachena" $left3
   at:-4200 mark:(line, blanc)

   from:-3730 till:-3300 color:vertmoy text:"Civilisation" $left
   from:-3730 till:-3300 color:vertmoy text:"de Bonuighinu" $left3

   from:-3300 till:-2480 color:vert text:"Civilisation de Ozieri" $left
   from:-2480 till:-1855 color:vertfonce text:"Civilisation d' Abealzu-" $left
   from:-2480 till:-1855 color:vertfonce text:"Filigosa et de Monte Claro" $left3

# archeo
 bar:archeo width:20
   from:-7000 till:-6700 color:orangeclair text:"galets" $left3
   from:-7000 till:-6700 color:orangeclair text:"clactoniens" $left4

   from:-6700 till:-6500 color:orangeclair2 text:"Restes" $left3
   from:-6700 till:-6500 color:orangeclair2 text:"humains" $left4

   from:-6300 till:-6000 color:orangeclair text:"Première" $left3
   from:-6300 till:-6000 color:orangeclair text:"route" $left4

   from:-6000 till:-5150 color:orangeclair2 text:"1ères Céramiques décorés et" $left3
   from:-6000 till:-5150 color:orangeclair2 text:"tombes dans des grottes naturelles" $left4


   from:-4200 till:-3730 color:orange text:"[[Cercle mégalithique|Cercles]]" $left3
   from:-4200 till:-3730 color:orange text:"[[Cercle mégalithique|funéraires]]" $left4

   from:-3730 till:-3300 color:orangeclair text:"[[domus de janas]]" $left3
   from:-3730 till:-3300 color:orangeclair text:"Statuettes en pierre" $left4

   from:-2990 till:-3020 color:orange text:"[[Nécropole|Nécropole néolithique de Li Muri]]" $center2
   at:-3000 mark:(line, black)

   from:-2900 till:-2500 color:orangeclair2 text:"[[Dolmen]]s" $left3

   from:-2480 till:-1855 color:rougeclair text:"Développement militaire" $left3


# societe
 bar:societe width:20
   from:-6300 till:-6000 color:cyan text:"Nouveaux" $left3
   from:-6300 till:-6000 color:cyan text:"arrivants" $left4

   from:-6000 till:-3730 color:bleuclair text:"Commerce d'obsidienne avec les peuples du bassin méditerranéen" $left3

   from:-3730 till:-3300 color:vertmoy text:"Echanges" $left3
   from:-3730 till:-3300 color:vertmoy text:"entre tribus" $left4

# espacements
 bar:espace1 width:20
 bar:espace2 width:20
 bar:espace3 width:40
 bar:espace4 width:40
 bar:espace5 width:20
 bar:espace6 width:20
| Template:ÂgeNuragique | top next |
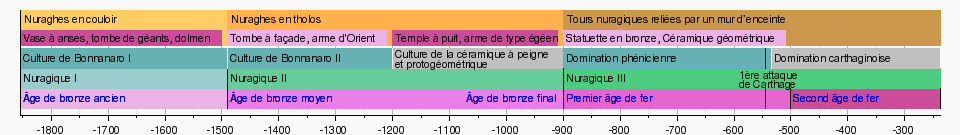
First version by Yugiz on Sunday, April 23, 2006, last update on Friday, July 21, 2006
DateFormat = yyyy
ImageSize  = width:960 height:auto barincrement:15
PlotArea   = left:20 right:20 bottom:20 top:10
Colors     =
  id:blanc             value:rgb(1,1,1)
  id:noir              value:black
  id:canvas            value:gray(0.98)
  id:grilleMajor       value:gray(0.7)
  id:grilleMinor       value:gray(0.9)

  id:bleu              value:rgb(0.35,0.65,0.80)
  id:gris              value:rgb(0.75,0.75,0.75)

  id:cyan              value:rgb(0.5,0.80,0.80)
  id:cyanfonce         value:rgb(0.4,0.7,0.7)

  id:rougefonce        value:rgb(0.7,0.3,0.4)
  id:rouge             value:rgb(0.8,0.3,0.60)
  id:rougemoy          value:rgb(0.9,0.4,0.8)
  id:rougeclair        value:rgb(0.92,0.5,0.9)
  id:rougeclair2        value:rgb(0.92,0.7,0.9)

  id:orange            value:rgb(1,0.7,0.3)
  id:orangeclair       value:rgb(1,0.8,0.4)
  id:orange2            value:rgb(0.8,0.5,0.2)
  id:orangeclair2       value:rgb(0.8,0.6,0.3)

  id:vertfonce         value:rgb(0.20,0.60,0.40)
  id:vert              value:rgb(0.30,0.80,0.50)
  id:vertmoy           value:rgb(0.40,0.80,0.60)
  id:vertclair         value:rgb(0.60,0.80,0.80)
  id:bleuclair         value:rgb(0.65,0.65,0.90)


Period     = from:-1855 till:-238
TimeAxis   = orientation:horizontal format:yyyy
AlignBars  = justify
ScaleMinor = unit:year increment:50 start:-1850 gridcolor:grilleMinor
ScaleMajor = unit:year increment:100 start:-1800 gridcolor:grilleMajor
BackgroundColors = canvas:canvas bars:canvas
BarData=
 bar:archeo
 bar:archeologie
   bar:espace3
 bar:domination
   bar:espace2
 bar:civilisation
   bar:espace4
 bar:age


Define $center = anchor:from align:center shift:( 4,30)
Define $center2 = anchor:from align:center shift:( 4,19)
Define $center3 = anchor:from align:center shift:( 4,10)
Define $left   = anchor:from align:left  shift:( 3,-4)
Define $right  = anchor:till align:right shift:(-4,-4)
Define $left2  = anchor:from align:left  shift:( 4, 5)
Define $right2 = anchor:till align:right shift:(-4, 13)
Define $left3  = anchor:from align:left  shift:( 3, 0)
Define $left4  = anchor:from align:left  shift:( 3, -10)

PlotData=
# Âge
 bar:age width:20
   from:-1855 till:-1490 color:rougeclair2 text:"[[Bronze ancien|Âge de bronze ancien]]" $left
   at:-1490 mark:(line, black)

   from:-1490 till:-900 color:rougeclair text:"[[Bronze moyen|Âge de bronze moyen]]" $left
   from:-1490 till:-900 color:rougeclair text:"[[Bronze final|Âge de bronze final]]" $right
   at:-900 mark:(line, black)

   from:-900 till:-500 color:rougemoy text:"[[Hallstatt|Premier âge de fer]]" $left
   at:-500 mark:(line, black)

   from:-500 till:-238 color:rouge text:"[[La Tène|Second âge de fer]]" $left
   at:-238 mark:(line, black)

   at:-545 mark:(line, black) text:"1ère attaque" $center2
   at:-545 mark:(line, black) text:"de Carthage" $center3

# civilisations
 bar:civilisation width:20
   from:-1855 till:-1490 color:vertclair text:"Nuragique I" $left
   at:-1490 mark:(line, black)

   from:-1490 till:-900 color:vertmoy text:"Nuragique II" $left
   at:-900 mark:(line, black)

   from:-900 till:-238 color:vert text:"Nuragique III" $left

# archeo
 bar:archeo width:35
   from:-1855 till:-1490 color:orangeclair text:"Nuraghes en couloir" $left2

   from:-1490 till:-900 color:orange text:"Nuraghes en tholos" $left2

   from:-900 till:-238 color:orangeclair2 text:"Tours nuragiques reliées par un mur d’enceinte" $left2

# archeologie
 bar:archeologie  width:15
   from:-1855 till:-1500 color:rouge text:"Vase à anses, tombe de géants, dolmen" $left
   from:-1490 till:-1210 color:rougeclair2 text:"Tombe à façade, arme d'Orient" $left
   from:-1200 till:-910 color:rouge text:"Temple à puit, arme de type égéen" $left
   from:-900 till:-510 color:rougeclair2 text:"Statuette en bronze, Céramique géométrique" $left


# domination
 bar:domination width:20
   from:-1855 till:-1490 color:cyanfonce text:"Culture de Bonnanaro I" $left
   at:-1490 mark:(line, blanc)
   from:-1490 till:-1200 color:cyanfonce text:"Culture de Bonnanaro II" $left
   at:-1200 mark:(line, blanc)

   from:-1200 till:-900 color:gris text:"Culture de la céramique à peigne" $left3
   from:-1200 till:-900 color:gris text:"et protogéométrique" $left4

   from:-900 till:-535 color:cyanfonce text:"Domination phénicienne" $left
   at:-535 mark:(line, blanc)
   at:-545 mark:(line, black)

   from:-535 till:-239 color:gris text:"Domination carthaginoise" $left

# espacements
 bar:espace2 width:10
 bar:espace3 width:10
 bar:espace4 width:10
| Template:Frise chronologique du Big Bang | top next |

First version by Giordano Bruno on Sunday, April 23, 2006, last update on Wednesday, May 24, 2006
ImageSize  = width:600 height:2000
PlotArea   = left:200 right:350 bottom:45 top:45
AlignBars = early

Colors =
  id:period1  value:rgb(1,1,0.7) # light yellow
  id:period2  value:rgb(0.7,0.7,1) # light blue
  id:events  value:rgb(1,0.7,1) # light purple

Period      = from:-43 till:13
TimeAxis    = orientation:vertical
ScaleMajor  = unit:year increment:1 start:-43

BarData =
  bar:Timelines
  bar:Periods
  bar:Events

PlotData=
  width:20  mark:(line,red)  textcolor:black

  bar:Events  color:events  align:left  shift:(15,0)

  at:-43  text:"[[Temps de Planck]], la plus petite unité observable de temps~et la durée en-deça de laquelle la science actuelle ne peut pas décrire l'univers.~À ce moment, la force de [[gravitation]] se sépare de la [[force électronucléaire]]."
  at:-36  text:"Séparation de la [[force forte]] de la force électronucléaire."
  from:-35  till:-33  text:"[[Époque inflationnaire]]~L'univers entre en expansion exponentielle."
  at:-33  text:"[[Quark (particule)|Quarks]] et anti-quarks commencent à se former."
  at:-12  text:"La [[force faible]] se sépare de la force électromagnétique donnant ainsi~les quatre forces séparées que nous connaissons aujourd'hui."
  at:-6  text:"Les électrons et les positrons commencent à s'annihiler entre eux."
  at:-5  text:"Les quarks se combinent pour former des protons et des neutrons.~Les paires quark/anti-quark se combinent en [[méson]]s."
  at:-4  text:"Les paires [[lepton]]/anti-lepton sont annihilées par les photons existants.~Les [[neutrino]]s se libèrent et existent par eux-mêmes."
  at:0  text:"Formation des noyaux atomiques (hydrogène).~Ceux-ci entrent en collision et la [[fusion nucléaire]] démarre~pour former des éléments plus lourds."
  at:2  text:"La fusion nucléaire finit après environ 3 minutes."
  at:13  text:"372 000 à 387 000 années~Les noyaux d'hydrogène capturent les [[électron]]s pour former des [[atome]]s stables.~Les photons n'interagissent plus fortement avec les atomes.~[[Fond diffus cosmologique]]."

  bar:Periods  align:left  shift:(15,0)
  from:2  till:13 color:period1 text:"[[Nucléosynthèse primordiale]]~Époque de la nucléosynthèse"
  from:0  till:2 color:period2 text:"Ère leptonique"
  from:-6  till:0 color:period1 text:"Ère hadronique"
  from:-12  till:-6 color:period2 text:"Ère électrofaible"
  from:-35  till:-12 color:period1 text:"Ère de la Grande Unification"
  from:-43  till:-35 color:period2 text:"Ère de Planck"

  bar:Timelines align:right shift:(-75,0)

TextData =
  tabs:(210-left)

  pos:(50,1995)
  text:"Chronologie"^"Événements"
  text:"---------"^"------"
| Template:Tableau Histoire Hominidés 2 | top next |
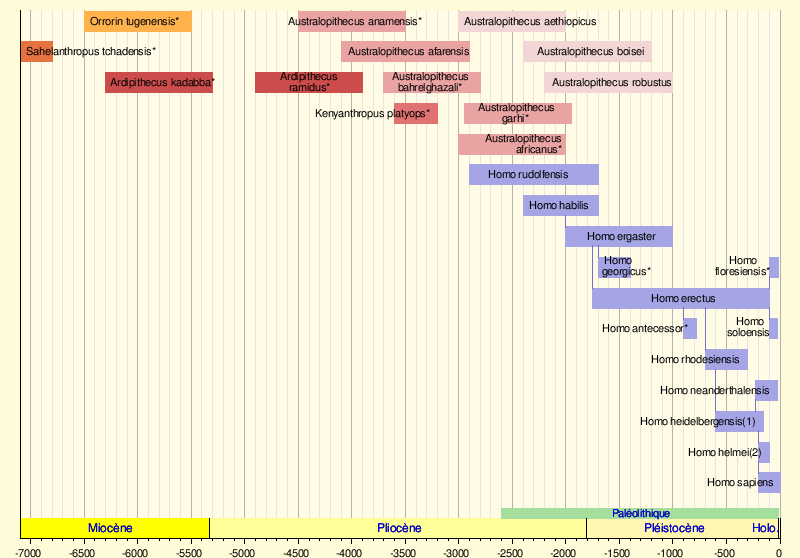
First version by Elapied on Tuesday, May 2, 2006, last update on Tuesday, May 9, 2006
DateFormat = yyyy
ImageSize  = width:800 height:auto barincrement:16
PlotArea   = left:20 right:20 bottom:20 top:10
Colors     =
  id:blanc             value:rgb(1,1,1)
  id:noir              value:black
  id:canvas            value:gray(0.98)
  id:fond1             value:rgb(1,0.985,0.85)
  id:fond2             value:rgb(1,0.985,0.9)
  id:holocene          value:rgb(1,0.984,0.941)
  id:pleisto           value:rgb(1,0.968,0.690)
  id:pliocene          value:rgb(1,1,0.6)
  id:miocene           value:rgb(1,1,0)
  id:paleo             value:rgb(0.651,0.875,0.616)
  id:gris              value:gray(0.80)
  id:exbleu            value:rgb(0.3,0.3,0.7)
  id:bleu              value:rgb(0.45,0.45,0.80)
  id:bleuclair         value:rgb(0.65,0.65,0.90)
  id:rouge             value:rgb(0.8,0.30,0.30)
  id:rougemoy          value:rgb(0.88,0.45,0.45)
  id:rougeclair        value:rgb(0.92,0.64,0.64)
  id:rougeclair2       value:rgb(0.95,0.84,0.84)
  id:orange            value:rgb(1,0.7,0.3)
  id:orangesom         value:rgb(0.9,0.45,0.25)
  id:or                value:rgb(1,0.9,0)
  id:grilleMajor       value:gray(0.7)
  id:grilleMinor       value:gray(0.9)

Period     = from:-7100 till:0
TimeAxis   = orientation:horizontal format:yyyy
AlignBars  = justify
ScaleMinor = unit:year increment:100 start:-6900 gridcolor:grilleMinor
ScaleMajor = unit:year increment:500 start:-7000 gridcolor:grilleMajor
BackgroundColors = canvas:fond1 bars:fond2
BarData=
  bar:evenement1
  bar:espace1
  bar:evenement2
  bar:espace2
  bar:evenement3
  bar:espace3
  bar:evenement4
  bar:espace4
  bar:evenement4bis
  bar:espace4bis
  bar:evenement4ter
  bar:espace4ter
  bar:evenement5
  bar:espace5
  bar:evenement6
  bar:espace6
  bar:evenement7
  bar:espace7
  bar:evenement8
  bar:espace8
  bar:evenement9
  bar:espace9
  bar:evenement0b
  bar:espace0b
  bar:evenement0c
  bar:espace0c
  bar:evenement0d
  bar:espace0d
  bar:evenement0e
  bar:espace0e
  bar:evenement0f
  bar:espace0f
#  barset:evenement
  bar:ages0
  bar:ages

Define $center = anchor:from align:center
Define $left   = anchor:from align:left  shift:( 4,-4)
Define $right  = anchor:till align:right shift:(-4,-4)
Define $left2  = anchor:from align:left  shift:( 4, 3)
Define $right2 = anchor:till align:right shift:(-4, 3)

PlotData=

  bar:evenement1   color:noir width:20 $left
  from:-6500  till:-5500 color:orange textcolor:noir text:"[[Orrorin tugenensis| ]]Orrorin tugenensis*" $left
  from:-4500  till:-3500 color:rougeclair
                at:-4000 textcolor:noir text:"[[Australopithecus anamensis| ]]Australopithecus anamensis*" $center
  from:-3000  till:-2000 color:rougeclair2 textcolor:noir text:"[[Australopithecus aethiopicus| ]]Australopithecus aethiopicus" $left

  bar:evenement2   color:noir width:20 $center
  from:-7100  till:-6800 color:orangesom textcolor:noir text:"[[Sahelanthropus tchadensis| ]]Sahelanthropus tchadensis*" $left
  from:-4100  till:-2900 color:rougeclair
                at:-3500 textcolor:noir text:"[[Australopithecus afarensis| ]]Australopithecus afarensis"
  from:-2400  till:-1200 color:rougeclair2
                at:-1800 textcolor:noir text:"[[Australopithecus boisei| ]]Australopithecus boisei"

  bar:evenement3   color:noir width:20
  from:-6300  till:-5300 color:rouge
                at:-5800 textcolor:noir text:"[[Ardipithecus kadabba| ]]Ardipithecus kadabba*"
  from:-4900  till:-3900 color:rouge
                at:-4400 textcolor:noir text:"[[Ardipithecus ramidus| ]]Ardipithecus~  ramidus*" shift:(0,2)
  from:-3700  till:-2800 color:rougeclair
                at:-3250 textcolor:noir text:"[[Australopithecus bahrelghazali| ]]Australopithecus ~bahrelghazali*" shift:(0,2)
  from:-2200  till:-1000 color:rougeclair2
                at:-1600 textcolor:noir text:"[[Australopithecus robustus| ]]Australopithecus robustus"

  bar:evenement4   color:noir width:20 $right
  from:-3600  till:-3200 color:rougemoy textcolor:noir text:"[[Kenyanthropus platyops| ]]Kenyanthropus platyops*"
  from:-2950  till:-1950 color:rougeclair
                at:-2450 textcolor:noir text:"[[Australopithecus garhi| ]]Australopithecus~garhi*" $center shift:(0,2)

  bar:evenement4bis color:noir width:20 $right
  from:-3000  till:-2000 color:rougeclair textcolor:noir text:"[[Australopithecus africanus| ]]Australopithecus~africanus*" shift:(0,2)

  bar:evenement4ter color:noir width:20 $right
  from:-2900  till:-1700 color:bleuclair
                at:-2300 textcolor:noir text:"[[Homo rudolfensis| ]]Homo rudolfensis" $center

  bar:evenement5   color:noir width:20 $left
  from:-2400  till:-1700 color:bleuclair textcolor:noir text:"[[Homo habilis| ]]Homo habilis"

  bar:espace5 width:12 at:-2000 mark:(line, bleu)

  bar:evenement6   color:noir width:20 $left
  from:-2000  till:-1000 color:bleuclair
                at:-1500 textcolor:noir text:"[[Homo ergaster| ]]Homo ergaster " $center

  bar:espace6 width:12 at:-1750 mark:(line, bleu)
  bar:espace6 width:12 at:-1700 mark:(line, bleu)

  bar:evenement7   color:noir width:20
  from:-1700  till:-1400 color:bleuclair textcolor:noir text:"[[Homo georgicus| ]]Homo  ~georgicus*" $left2
  from:-100   till:-12    color:bleuclair textcolor:noir text:"[[Homo floresiensis| ]]Homo     ~floresiensis*" $right2
                       at:-1750 mark:(line, bleu)

  bar:espace7 width:12 at:-1750 mark:(line, bleu)
  bar:espace7 width:12 at:-100 mark:(line, bleu)

  bar:evenement8   color:noir width:20 $left
  from:-1750  till:-100 color:bleuclair
                at:-925 textcolor:noir text:"[[Homo erectus| ]]Homo erectus" $center

  bar:espace8 width:12 at:-900 mark:(line, bleu)
  bar:espace8 width:12 at:-700 mark:(line, bleu)
  bar:espace8 width:12 at:-100 mark:(line, bleu)

  bar:evenement9   color:noir width:20 $left
  from:-900  till:-780 color:bleuclair textcolor:noir text:"[[Homo antecessor| ]]Homo antecessor*" $right
  from:-100   till:-27 color:bleuclair textcolor:noir text:"[[Homo soloensis| ]]Homo  ~soloensis" $right2
                at:-700  mark:(line, bleu)

  bar:espace9  width:12 at:-700 mark:(line, bleu)

  bar:evenement0b   color:noir width:20 $left
  from:-700   till:-300 color:bleuclair textcolor:noir text:"[[Homo rhodesiensis| ]]Homo rhodesiensis" $right

  bar:espace0b width:12 at:-600 mark:(line, bleu)

  bar:evenement0c   color:noir width:20 $left
  from:-230   till:-28 color:bleuclair textcolor:noir text:"[[Homo neanderthalensis| ]]Homo neanderthalensis" $right

                        at:-600 mark:(line, bleu)
  bar:espace0c width:12 at:-600 mark:(line, bleu)
  bar:espace0c width:12 at:-230 mark:(line, bleu)

  bar:evenement0d   color:noir width:20 $left
  from:-600   till:-150 color:bleuclair textcolor:noir text:"[[Homo heidelbergensis| ]]Homo heidelbergensis(1)" $right

  bar:espace0d width:12 at:-200 mark:(line, bleu)

  bar:evenement0e   color:noir width:20 $left
  from:-200   till:-95   color:bleuclair textcolor:noir text:"[[Homo helmei| ]]Homo helmei(2)" $right

  bar:espace0e width:12 at:-200 mark:(line, bleu)

  bar:evenement0f   color:noir width:20 $left
  from:-200  till:0 color:bleuclair textcolor:noir text:"[[Homo sapiens| ]]Homo sapiens" $right

  bar:ages0
  from:-2600 till:-10 width:10 color:paleo textcolor:blanc
               at:-1600 text:"[[Paleolithique|Paléolithique]]"

  bar:ages fontsize:9
  from:-7100 till:-5332   color:miocene
               at:-6500 text:"[[Miocène]]"
  from:-5332 till:-1806   color:pliocene
               at:-3800 text:"[[Pliocène]]"
  from:-1806 till:-11     color:pleisto
               at:-1300 text:"[[Pléistocène]]"
  from:-11   till:0    color:holocene
               at:-295  text:"[[Holocène|Holo.]]"
               at:-5332 mark:(line, noir)
               at:-1806 mark:(line, noir)
               at:-11 mark:(line, noir)
               at:0 mark:(line, noir)
| Template:AntiqMoyÂgeSarde | top next |
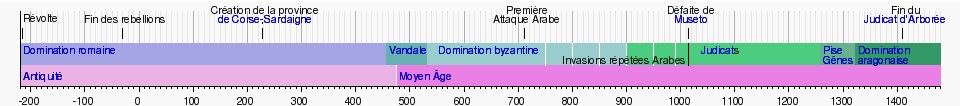
First version by Yugiz on Tuesday, May 2, 2006, last update on Sunday, July 16, 2006
DateFormat = yyyy
ImageSize  = width:960 height:auto barincrement:15
PlotArea   = left:20 right:20 bottom:20 top:10
Colors     =
  id:blanc             value:rgb(1,1,1)
  id:noir              value:black
  id:canvas            value:gray(0.98)
  id:grilleMajor       value:gray(0.7)
  id:grilleMinor       value:gray(0.9)

  id:bleu              value:rgb(0.35,0.65,0.80)
  id:gris              value:rgb(0.75,0.75,0.75)

  id:cyan              value:rgb(0.5,0.80,0.80)
  id:cyanfonce         value:rgb(0.4,0.7,0.7)

  id:rougefonce        value:rgb(0.7,0.3,0.4)
  id:rouge             value:rgb(0.8,0.3,0.60)
  id:rougemoy          value:rgb(0.9,0.4,0.8)
  id:rougeclair        value:rgb(0.92,0.5,0.9)
  id:rougeclair2        value:rgb(0.92,0.7,0.9)

  id:orange            value:rgb(1,0.7,0.3)
  id:orangeclair       value:rgb(1,0.8,0.4)
  id:orange2            value:rgb(0.8,0.5,0.2)
  id:orangeclair2       value:rgb(0.8,0.6,0.3)

  id:vertfonce         value:rgb(0.20,0.60,0.40)
  id:vert              value:rgb(0.30,0.80,0.50)
  id:vertmoy           value:rgb(0.40,0.70,0.55)
  id:vertclair         value:rgb(0.60,0.80,0.80)
  id:bleuclair         value:rgb(0.65,0.65,0.90)


Period     = from:-220 till:1479
TimeAxis   = orientation:horizontal format:yyyy
AlignBars  = justify
ScaleMinor = unit:year increment:10 start:-220 gridcolor:grilleMinor
ScaleMajor = unit:year increment:100 start:-200 gridcolor:grilleMajor
BackgroundColors = canvas:canvas bars:canvas
BarData=
 bar:vide
 bar:evenement
   bar:espace3
 bar:domination
   bar:espace2
 bar:age


Define $center = anchor:from align:center shift:( 4,30)
Define $center2 = anchor:from align:center shift:( 4,19)
Define $center3 = anchor:from align:center shift:( 4,10)
Define $left   = anchor:from align:left  shift:( 3,-10)
Define $left1   = anchor:from align:left  shift:( 1,11)
Define $right  = anchor:till align:right shift:(-4,-4)
Define $left2  = anchor:from align:left  shift:( 4, 5)
Define $right2 = anchor:till align:right shift:(-4, 13)
Define $left3  = anchor:from align:left  shift:( 3, 0)
Define $left4  = anchor:from align:left  shift:( 3, -5)

PlotData=
# Âge
 bar:age width:20
   from:-220 till:476 color:rougeclair2 text:"[[Antiquité]]" $left4
   at:476 mark:(line, blanc)

   from:476 till:1479 color:rougeclair text:"[[Moyen Âge]]" $left4

# domination
 bar:domination width:22
   from:-220 till:456 color:bleuclair text:"[[Domination romaine]]" $left3

   from:456 till:533 color:cyanfonce text:"[[Vandale]]" $left3

   from:533 till:900 color:vertclair text:"   [[Byzance|Domination byzantine]]" $left3

   at:750 mark:(line, blanc) text:"     Invasions répétées Arabes" $left
   at:800 mark:(line, blanc)
   at:850 mark:(line, blanc)
   at:900 mark:(line, blanc)
   at:950 mark:(line, blanc)
   at:990 mark:(line, blanc)
   at:1015 mark:(line, black)

   from:900 till:1258 color:vert text:"                         [[Judicat]]s" $left3

   from:1258 till:1323 color:vertmoy text:"[[Pise]]" $left3
   from:1258 till:1323 color:vertmoy text:"[[Gênes]]" $left

   from:1323 till:1479 color:vertfonce text:"[[Royaume d'Aragon|Domination]]" $left3
   from:1323 till:1479 color:vertfonce text:"[[Royaume d'Aragon|aragonaise]]" $left


# evenement
 bar:evenement  width:10
   at:-215 mark:(line, black) text:"Révolte" $left1

   at:-31 mark:(line, black) text:"Fin des rebellions" $center3

   at:227 mark:(line, black) text:"Création de la province" $center2
   at:227 mark:(line, black) text:"[[Corse-Sardaigne|de Corse-Sardaigne]]" $center3

   at:711 mark:(line, black) text:"Première" $center2
   at:711 mark:(line, black) text:"Attaque Arabe" $center3

   at:1015 mark:(line, black) text:"Défaite de" $center2
   at:1015 mark:(line, black) text:"[[Museto]]" $center3

   at:1409 mark:(line, black) text:"Fin du" $center2
   at:1409 mark:(line, black) text:"[[Judicat d'Arborée]]" $center3

# vide
 bar:vide  width:1
   at:227 mark:(line, black)

# espacements
 bar:espace2 width:10
 bar:espace3 width:10
| Template:Tableau Histoire Hominidés 3 | top next |

First version by Elapied on Tuesday, May 9, 2006, last update on Saturday, July 1, 2006
DateFormat = yyyy
ImageSize  = width:650 height:auto barincrement:16
PlotArea   = left:20 right:20 bottom:20 top:10
Colors     =
  id:blanc             value:rgb(1,1,1)
  id:noir              value:black
  id:canvas            value:gray(0.98)
  id:fond1             value:rgb(1,0.985,0.85)
  id:fond2             value:rgb(1,0.985,0.9)
  id:holocene          value:rgb(1,0.984,0.941)
  id:pleisto           value:rgb(1,0.968,0.690)
  id:pliocene          value:rgb(1,1,0.6)
  id:miocene           value:rgb(1,1,0)
  id:paleo             value:rgb(0.651,0.875,0.616)
  id:gris              value:gray(0.80)
  id:exbleu            value:rgb(0.3,0.3,0.7)
  id:bleu              value:rgb(0.45,0.45,0.80)
  id:bleuclair         value:rgb(0.65,0.65,0.90)
  id:rouge             value:rgb(0.8,0.30,0.30)
  id:rougemoy          value:rgb(0.88,0.45,0.45)
  id:rougeclair        value:rgb(0.92,0.64,0.64)
  id:rougeclair2       value:rgb(0.95,0.84,0.84)
  id:orange            value:rgb(1,0.7,0.3)
  id:orangesom         value:rgb(0.9,0.45,0.25)
  id:or                value:rgb(1,0.9,0)
  id:grilleMajor       value:gray(0.7)
  id:grilleMinor       value:gray(0.9)

Period     = from:-7100 till:0
TimeAxis   = orientation:horizontal format:yyyy
AlignBars  = justify
ScaleMinor = unit:year increment:100 start:-6900 gridcolor:grilleMinor
ScaleMajor = unit:year increment:500 start:-7000 gridcolor:grilleMajor
BackgroundColors = canvas:fond1 bars:fond2
BarData=
  bar:evenement1
  bar:espace1
  bar:evenement2
  bar:espace2
  bar:evenement3
  bar:espace3
  bar:evenement4
  bar:espace4
  bar:evenement4bis
  bar:espace4bis
  bar:evenement4ter
  bar:espace4ter
  bar:evenement5
  bar:espace5
  bar:evenement6
  bar:espace6
  bar:evenement7
  bar:espace7
  bar:evenement8
  bar:espace8
  bar:evenement9
  bar:espace9
  bar:evenement0b
  bar:espace0b
  bar:evenement0c
  bar:espace0c
  bar:evenement0d
  bar:espace0d
  bar:evenement0e
  bar:espace0e
  bar:evenement0f
  bar:espace0f
#  barset:evenement
  bar:ages0
  bar:ages

Define $center = anchor:from align:center
Define $left   = anchor:from align:left  shift:( 4,-4)
Define $right  = anchor:till align:right shift:(-4,-4)
Define $left2  = anchor:from align:left  shift:( 4, 3)
Define $right2 = anchor:till align:right shift:(-4, 3)

PlotData=

  bar:evenement1   color:noir width:20 $left
  from:-6500  till:-5500 color:orange textcolor:noir text:"[[Orrorin tugenensis| ]]Orrorin tugenensis*" $left
  from:-4500  till:-3500 color:rougeclair
                at:-4000 textcolor:noir text:"[[Australopithecus anamensis| ]]Australopithecus anamensis*" $center
  from:-3000  till:-2000 color:rougeclair2 textcolor:noir text:"[[Australopithecus aethiopicus| ]]Australopithecus aethiopicus" $left

  bar:evenement2   color:noir width:20 $center
  from:-7100  till:-6800 color:orangesom textcolor:noir text:"[[Sahelanthropus tchadensis| ]]Sahelanthropus tchadensis*" $left
  from:-4100  till:-2900 color:rougeclair
                at:-3500 textcolor:noir text:"[[Australopithecus afarensis| ]]Australopithecus afarensis"
  from:-2400  till:-1200 color:rougeclair2
                at:-1800 textcolor:noir text:"[[Australopithecus boisei| ]]Australopithecus boisei"

  bar:evenement3   color:noir width:20
  from:-6300  till:-5300 color:rouge
                at:-5800 textcolor:noir text:"[[Ardipithecus kadabba| ]]Ardipithecus kadabba*"
  from:-4900  till:-3900 color:rouge
                at:-4400 textcolor:noir text:"[[Ardipithecus ramidus| ]]Ardipithecus~  ramidus*" shift:(0,2)
  from:-3700  till:-2800 color:rougeclair
                at:-3250 textcolor:noir text:"[[Australopithecus bahrelghazali| ]]Australopithecus ~bahrelghazali*" shift:(0,2)
  from:-2200  till:-1000 color:rougeclair2
                at:-1600 textcolor:noir text:"[[Australopithecus robustus| ]]Australopithecus robustus"

  bar:evenement4   color:noir width:20 $right
  from:-3600  till:-3200 color:rougemoy textcolor:noir text:"[[Kenyanthropus platyops| ]]Kenyanthropus platyops*"
  from:-2950  till:-1950 color:rougeclair
                at:-2450 textcolor:noir text:"[[Australopithecus garhi| ]]Australopithecus~garhi*" $center shift:(0,2)

  bar:evenement4bis color:noir width:20 $right
  from:-3000  till:-2000 color:rougeclair textcolor:noir text:"[[Australopithecus africanus| ]]Australopithecus~africanus*" shift:(0,2)

  bar:evenement4ter color:noir width:20 $right
  from:-2900  till:-1700 color:bleuclair
                at:-2300 textcolor:noir text:"[[Homo rudolfensis| ]]Homo rudolfensis" $center

  bar:evenement5   color:noir width:20 $left
  from:-2400  till:-1700 color:bleuclair textcolor:noir text:"[[Homo habilis| ]]Homo habilis"

  bar:espace5 width:12 at:-2000 mark:(line, bleu)

  bar:evenement6   color:noir width:20 $left
  from:-2000  till:-1000 color:bleuclair
                at:-1500 textcolor:noir text:"[[Homo ergaster| ]]Homo ergaster " $center

  bar:espace6 width:12 at:-1750 mark:(line, bleu)
  bar:espace6 width:12 at:-1700 mark:(line, bleu)

  bar:evenement7   color:noir width:20
  from:-1700  till:-1400 color:bleuclair textcolor:noir text:"[[Homo georgicus| ]]Homo  ~georgicus*" $left2
  from:-100   till:-12    color:bleuclair textcolor:noir text:"[[Homo floresiensis| ]]Homo     ~floresiensis*" $right2
                       at:-1750 mark:(line, bleu)

  bar:espace7 width:12 at:-1750 mark:(line, bleu)
  bar:espace7 width:12 at:-100 mark:(line, bleu)

  bar:evenement8   color:noir width:20 $left
  from:-1750  till:-100 color:bleuclair
                at:-925 textcolor:noir text:"[[Homo erectus| ]]Homo erectus" $center

  bar:espace8 width:12 at:-900 mark:(line, bleu)
  bar:espace8 width:12 at:-700 mark:(line, bleu)
  bar:espace8 width:12 at:-100 mark:(line, bleu)

  bar:evenement9   color:noir width:20 $left
  from:-900  till:-780 color:bleuclair textcolor:noir text:"[[Homo antecessor| ]]Homo antecessor*" $right
  from:-100   till:-27 color:bleuclair textcolor:noir text:"[[Homo soloensis| ]]Homo  ~soloensis" $right2
                at:-700  mark:(line, bleu)

  bar:espace9  width:12 at:-700 mark:(line, bleu)

  bar:evenement0b   color:noir width:20 $left
  from:-700   till:-300 color:bleuclair textcolor:noir text:"[[Homo rhodesiensis| ]]Homo rhodesiensis" $right

  bar:espace0b width:12 at:-600 mark:(line, bleu)

  bar:evenement0c   color:noir width:20 $left
  from:-230   till:-28 color:bleuclair textcolor:noir text:"[[Homo neanderthalensis| ]]Homo neanderthalensis" $right

                        at:-600 mark:(line, bleu)
  bar:espace0c width:12 at:-600 mark:(line, bleu)
  bar:espace0c width:12 at:-230 mark:(line, bleu)

  bar:evenement0d   color:noir width:20 $left
  from:-600   till:-150 color:bleuclair textcolor:noir text:"[[Homo heidelbergensis| ]]Homo heidelbergensis(1)" $right

  bar:espace0d width:12 at:-200 mark:(line, bleu)

  bar:evenement0e   color:noir width:20 $left
  from:-200   till:-95   color:bleuclair textcolor:noir text:"[[Homo helmei| ]]Homo helmei(2)" $right

  bar:espace0e width:12 at:-200 mark:(line, bleu)

  bar:evenement0f   color:noir width:20 $left
  from:-200  till:0 color:bleuclair textcolor:noir text:"[[Homo sapiens| ]]Homo sapiens" $right

  bar:ages0
  from:-2600 till:-10 width:10 color:paleo textcolor:blanc
               at:-1600 text:"[[Paleolithique|Paléolithique]]"

  bar:ages fontsize:9
  from:-7100 till:-5332   color:miocene
               at:-6500 text:"[[Miocène]]"
  from:-5332 till:-1806   color:pliocene
               at:-3800 text:"[[Pliocène]]"
  from:-1806 till:-11     color:pleisto
               at:-1300 text:"[[Pléistocène]]"
  from:-11   till:0    color:holocene
               at:-295  text:"[[Holocène|Holo.]]"
               at:-5332 mark:(line, noir)
               at:-1806 mark:(line, noir)
               at:-11 mark:(line, noir)
               at:0 mark:(line, noir)
| Nepenthes rajah | top next |

First version by Weft on Saturday, May 13, 2006, last update on Tuesday, May 16, 2006
ImageSize  = width:710 height:1600
PlotArea   = left:40 right:10 top:10 bottom:10
DateFormat = yyyy
TimeAxis   = orientation:vertical order:reverse format:yyyy
Period     = from:1845 till:2015
AlignBars  = early
ScaleMajor = unit:year increment:10 start:1850
ScaleMinor = unit:year increment:1 start:1845

Colors =
  id:gray value:gray(0.9)
  id:lightsteelblue value:rgb(0.56, 0.93, 0.56)

Define $dx = 20 # shift text to right side of bar

PlotData =
  bar:event width:20 color:gray shift:($dx,-4)

  from:start till:end color:lightsteelblue

  mark:(line,white)
  at:1851 text:"1851: Hugh Low découvre le Nepenthes rajah"
  at:1859 text:"1859: Joseph Dalton Hooker décrit et nomme la nouvelle espèce"
  at:1862 text:"1862: Spencer St. John trouve un rat noyé dans une urne de N. rajah"
  at:1873 text:"1873: Les publications de Hooker placent N. rajah dans les Eunepenthes"
  at:1878 text:"1878: F. W. Burbidge collecte N. rajah pour la Veitch Nurseries"
  at:1881 text:"1881: N. rajah apparaît dans ''The Gardeners' Chronicle''"
  at:1882 text:"1882: Des spécimens sont exposés à l'exposition annuelle de la Société royale d'horticulture"
  at:1883 text:"1883: N. rajah apparaît dans le journal botanique ''Gartenflora''"
  at:1892 text:"1892: Haviland collecte des spécimens pour le musée de Sarawak"
  at:1895 text:"1895: G. M. L. Beck place N. rajah dans les Apruinosae"
  at:1897 text:"1897: N. rajah apparaît dans le journal de la Société royale d'horticulture"
  at:1904 text:"1905: N. rajah apparaît dans le ''Curtis's Botanical Magazine''"
  at:1905 text:"1905: Les derniers N. rajah de la Veitch Nurseries meurrent"
  at:1906 text:"1906: N. rajah est perdu en culture, la dernière plante cultivée mourrant"
  at:1908 text:"1908: John Muirhead Macfarlane révise le genre une fois de plus"
  at:1910 text:"1910: N. × kinabaluensis est collecté pour la 1ère fois par L. Gibbs"
  at:1914 text:"1914: Macfarlane suggère que ce soit N. rajah × N. villosa"
  at:1915 text:"1915: Clemens collecte des spécimens pour le Jardin Botanique de Buitenzorg"
  at:1921 text:"1921: N. rajah apparaît dans le journal botanique ''Bibl. Enum. Born.''"
  at:1927 text:"1927: N. rajah apparaît dans le journal botanique ''Tropical Nature''"
  at:1928 text:"1928: B. H. Danser place N. rajah parmi le clade des Regiae"
  at:1929 text:"1929: H. M. Pendlebury makes the first collection of Culex rajah"
  at:1931 text:"1931: F. W. Edwards incorrectly identifies it as C. shebbearei"
  at:1936 text:"1936: H. Harms includes N. rajah in the Eunepenthes once more"
  at:1974 text:"1974: S. Kurata collects the holotype of N. × kinabaluensis (1984)"
  at:1976 text:"1976: N. rajah appears on the cover of ''Nepenthes of Mount Kinabalu''"
  at:1977 text:"1976: N. × kinabaluensis is described by Kurata"
  at:1981 text:"1981: N. rajah is placed on CITES Appendix I"
  at:1983 text:"1983: T. C. Gibson publishes the first cultivation guide for N. rajah"
  at:1984 text:"1984: Kurata describes N. rajah × N. villosa as N. × kinabaluensis"
  at:1986 text:"1986: A. Slack illustrates N. burbidgeae × N. rajah as N. rajah"
  at:1987 text:"1988: A. Phillipps and A. Lamb find a rat caught by N. rajah"
  at:1988 text:"1988: J. H. Adam collects the holotype of N. kinabaluensis (1996)"
  at:1989 text:"1988: Adam and A. Mahdi collect the holotype of N. × alisaputrana
  at:1990 text:"1989: M. Tsukamoto describes Culex rajah and Toxorhynchites rajah
  at:1991 text:"1992: G. Cheers illustrates N. × kinabaluensis as N. rajah"
  at:1992 text:"1992: Nepenthes × alisaputrana is described by Adam and Wilcock"
  at:1995 text:"1996: Malaysia releases a postage stamp depicting N. rajah"
  at:1996 text:"1996: Adam and Wilcock describe Nepenthes kinabaluensis"
  at:1997 text:"1997: N. rajah appears on the cover of  ''Nepenthes of Borneo''
  at:1998 text:"1997: N. rajah is listed on Schedule I, Part II of the WCE"
  at:2001 text:"2001: N. × kinabaluensis appears on the cover of Clarke's guide
  at:2002 text:"2002: Biochemical analysis is conducted on N. rajah et al.
  at:2004 text:"2004: N. rajah est placé sur la liste rouge de l'IUCN en tant qu'espèce menacée"

TextData =
  tabs:(25-left)
  pos:(100,710)
  fontsize:6
  text:" "
| Template:Grand Schisme d'Occident | top next |

Initial version by Verdy p on Thursday, May 25, 2006
ImageSize = width:800 height:256
PlotArea = width:768 height:150 left:16 bottom:96
Legend = position:bottom columns:3

Colors =
  id:horsschisme value:rgb(1,   1,   0.4) legend:pape_en_Avignon_puis_Rome_(hors_schisme)
  id:rome        value:rgb(0.5, 1,   0.5) legend:pape_à_Rome
  id:pise        value:rgb(0.9, 0.9, 0.9) legend:antipape_à_Pise
  id:avignon     value:rgb(0,   1,   1  ) legend:antipape_en_Avignon
  id:aragon      value:rgb(1,   0.5, 0.5) legend:antipape_en_Aragon_(non_reconnu)
  id:rodez       value:rgb(1,   0.3, 0.3) legend:antipape_à_Rodez_(non_reconnu)
  id:savoie      value:rgb(1,   1,   0.6) legend:antipape_en_Savoie
  id:black       value:black

TimeAxis = orientation:horizontal
AlignBars = justify

Period = from:1370 till:1460
ScaleMajor = unit:year increment:10 start:1370
ScaleMinor = unit:year increment:1  start:1370

BarData =
  bar:title text:
  bar:Rome text:
  bar:Pise text:
  bar:Avignon text:
  bar:Rodez text:

PlotData =
  bar:title from:start till:end text:"Papes et antipapes durant les Schismes d’Occident" align:center width:15 color:white fontsize:L

  align:center textcolor:black fontsize:S mark:(line,black) width:25 shift:(0,-5)

  bar:Rome color:horsschisme
  from:1370.12 till:1378.3 text:"[[Grégoire XI]]"

  bar:Rome color:rome
  from:1378.3 till:1389.8 text:[[Urbain VI]]
  from:1389.8 till:1404.8 text:[[Boniface IX]]
  from:1404.8 till:1406.9 text:"[[Innocent VII|Innocent]]~[[Innocent VII|VII]]" shift:(0, 1)
  from:1406.9 till:1415.5 text:"[[Grégoire XII]]" shift:(2, -5)

  bar:Pise color:pise
  from:1409.5 till:1410.3 text:"[[Alexandre V (antipape)|Alexandre]]~[[Alexandre V (antipape)|V]]" shift:(-20, 1)
  from:1410.3 till:1415.5 text:"[[Jean XXIII (antipape)|Jean]]~[[Jean XXIII (antipape)|XXIII]]" shift:(0, 1)

  bar:Avignon color:avignon
  from:1378.7 till:1394.7 text:[[Clément VII (antipape)|Clément VII]]
  from:1394.7 till:1417.6 text:[[Benoît XIII (antipape)|Benoît XIII]]

  bar:Rome color:horsschisme
  from:1417.7 till:1431.0 text:"[[Martin V]]"
  from:1431.0 till:1447.0 text:"[[Eugène IV]]"
  from:1447.0 till:1459.0 text:"[[Nicolas V]]"

  bar:Avignon color:aragon
  from:1417.6 till:1423.5 text:"[[Benoît XIII (antipape)|Benoît]]~[[Benoît XIII (antipape)|XIII]]" shift:(0, 1)
  from:1423.5 till:1429.7 text:"[[Clément VIII (antipape)|Clément]]~[[Clément VIII (antipape)|VIII]]" shift:(0, 1)

  bar:Rodez color:rodez
  from:1423.5 till:1433.0 text:"[[Benoît XIV (antipape)|Benoît]]~[[Benoît XIV (antipape)|XIV]]" shift:(0, 1)
  from:1433.0 till:1460.0 text:"[[Antipapes imaginaires]]"

  bar:Pise color:savoie
  from:1440.0 till:1449.0 text:"[[Félix V|Félix V]]
| Template:Chronologie de la robotique | top next |

Initial version by Romram on Friday, May 26, 2006
DateFormat = yyyy
ImageSize = width:800 height:auto barincrement:50
PlotArea = left:20 right:20 bottom:20 top:10
Colors =
  id:noir              value:black
  id:fond_periode      value:rgb(0.76,0.76,0.96)
  id:fond_titre        value:rgb(0.50,0.62,0.75)
  id:gris              value:gray(0.80)
  id:canvas            value:rgb(0.97,0.97,0.97)
  id:grilleMajor       value:rgb(0.80,0.80,0.80)
  id:grilleMinor       value:rgb(0.86,0.86,0.86)

Period     = from:1900 till:2020
TimeAxis   = orientation:horizontal format:yyyy
ScaleMinor = unit:year increment:10 start:1910 gridcolor:grilleMinor
ScaleMajor = unit:year increment:50 start:1900 gridcolor:grilleMajor

BackgroundColors = canvas:canvas bars:canvas
BarData=
  bar:epoque
  barset:evenemment


PlotData=
  bar:epoque shift:(0,0) width:30
  from:start till:end color:gris # Arrière plan

  from:start till:1900  text:" " color:gris
  from:1900  till:2020  text:"Histoire de la robotique du XXe siècle à nos jours" color:fond_titre fontsize:M align:center
  from:2020  till:end   text:" " color:gris

  barset:evenemment color:fond_periode shift:(2,0) width:17
  from:1920  till:1920  text:"[[1920]]~[[R. U. R. (Rossum's Universal Robots)|Apparition du terme “robot”]]" color:noir anchor:from
  #Recommencer l'indentation en haut
  barset:break
  from:1973  till:1973  text:"[[1973]]~[[Wabot-1|premier robot humanoïde à marche bipède (Wabot-1)]]" color:noir anchor:from
  from:1996  till:1996  text:"[[1996]]~[[Mars Pathfinder|Lancement de la mission Mars Pathfinder et de son robot Sojourner]]" color:noir anchor:from
  from:1999  till:1999  text:"[[1999]]~[[Aibo|Sortie officielle de Aibo]]" anchor:from  color:noir
  from:2000  till:2006  text:"[[2000-2006]]~[[Asimo|Développement d'Asimo]]" anchor:from  color:fond_periode
  from:2003  till:2006  text:"[[2000-2006]]~[[Qrio|Développement d'Asimo]]" anchor:from  color:fond_periode
| Template:Chronologie des auteurs du romantisme | top next |

Initial version by Wspeed on Friday, May 26, 2006
# définition de la taille de la frise
ImageSize  = width:1600 height:1200 # taille totale largeur, hauteur
PlotArea   = width:1560 height:1160 left:20 bottom:40 # taille réelle de la frise
Legend     = orientation:horizontal left:500 top:20
DateFormat = yyyy # format de la date
Period     = from:1780 till:1900 # période
TimeAxis   = orientation:horizontal # orientation (« vertical » ou « horizontal »)
ScaleMajor = unit:year increment:5 start:1780 # incrément temporel

Colors=
  id:chefs  value:lavender legend:Chefs_d'États
  id:auteurs  value:drabgreen     legend:Auteurs
  id:musiciens  value:lightorange  legend:Musiciens
  id:peintres  value:dullyellow  legend:Peintres
  id:noms  value:black
  id:oeuvres  value:gray(0.3)
PlotData=
# définition de la première barre, 45 pixels de large
  bar:chefs color:chefs width:16 mark:(line,white) align:center fontsize:S

# informations temporelles (cf. explications sur les commandes)
 from:start till:1792 text:Louis XVI
 from:1802 till:1815 text:Napoléon
 from:1815 till:1824 text:Louis XVIII
 from:1825 till:1830 text:Charles X
 from:1830 till:1848 text:Louis Philippe
 from:1848 till:1871 text:Napoléon Bonaparte => Napoléon III
 from:1871 till:1873 text:Thiers
 from:1873 till:1879 text:Mac-Mahon
 from:1879 till:1887 text:Grévy
 from:1887 till:1894 text:Carnot
 from:1894 till:1895 shift:(0,15) text:Casimir-Perier
 from:1895 till:1899 text:Faure
 from:1899 till:end shift:(15,0) text:Loubet

  bar:1 color:auteurs width:16 mark:(line,white) align:center fontsize:XS textcolor:noms
 from:1802 till:1885 text:Victor Hugo
 at:1830 shift:(-20,-7) text:"Hernani" mark:(line,tan2) textcolor:oeuvres
 at:1831 shift:(50,-7) text:"Notre Dame de Paris" mark:(line,tan2) textcolor:oeuvres
 at:1868 shift:(0,-7) text:"Les misérables" mark:(line,tan2) textcolor:oeuvres
 from:start till:1801 shift:(-20,0) text:Novalis
 at:1800 shift:(-40,-8) text:"Hymnes à la nuit" mark:(line,tan2) textcolor:oeuvres
 at:1801 shift:(-65,0) text:"Heinrich von Ofterdingen" mark:(line,tan2) textcolor:oeuvres
 at:1798 shift:(-120,-8) text:"Die Lehrlinge zu Sais" mark:(line,tan2) textcolor:oeuvres


  bar:2 color:auteurs width:16 mark:(line,white) align:center fontsize:XS textcolor:noms
 from:start till:1848 text:François-René de Chateaubriand
 at:1801 shift:(-10,0) text:"Atala" mark:(line,tan2) textcolor:oeuvres
 at:1802 shift:(-55,-8) text:"Génie du christianisme" mark:(line,tan2) textcolor:oeuvres
 at:1848 shift:(-65,-8) text:"Mémoires d'outre-tombe" mark:(line,tan2) textcolor:oeuvres

  bar:3 color:auteurs width:16 mark:(line,white) align:center fontsize:XS textcolor:noms
 from:start till:1805 text:Friedrich von Schiller
 at:1804 shift:(-45,-8) text:"Guillaume Tell" mark:(line,tan2) textcolor:oeuvres
 at:1787 shift:(-25,0) text:"Don Carlos" mark:(line,tan2) textcolor:oeuvres
 at:1785 shift:(-22,-8) text:"Ode an die Freude" mark:(line,tan2) textcolor:oeuvres
 from:1807 till:1841 text:Aloysius Bertrand
 at:1842 shift:(-55,-8) text:"Gaspard de la nuit" mark:(line,tan2) textcolor:oeuvres
 from:1844 till:1896 text:Paul Verlaine
 at:1884 shift:(-55,-8) text:"Les Poètes maudits" mark:(line,tan2) textcolor:oeuvres
 at:1895 shift:(-45,-8) text:"Confessions" mark:(line,tan2) textcolor:oeuvres
 at:1866 shift:(-45,-8) text:"Poèmes saturniens" mark:(line,tan2) textcolor:oeuvres

  bar:4 color:auteurs width:16 mark:(line,white) align:center fontsize:XS textcolor:noms
 from:start till:1832 text:Johann Wolfgang von Goethe
 at:1808 shift:(-20,-8) text:"Faust" mark:(line,tan2) textcolor:oeuvres
 at:start shift:(75,0) text:"Die Leiden des jungen Werther" mark:(line,tan2) textcolor:oeuvres
 at:1796 shift:(-75,-8) text:"Les Années d'apprentissage de Wilhelm Meister" mark:(line,tan2) textcolor:oeuvres

  bar:5 color:auteurs width:16 mark:(line,white) align:center fontsize:XS textcolor:noms
 from:1810 till:1857 text:Alfred de Musset
 at:1833 shift:(-20,-8) text:"Rolla" mark:(line,tan2) textcolor:oeuvres
 at:1834 shift:(40,-8) text:"Lorenzaccio" mark:(line,tan2) textcolor:oeuvres
 at:1836 shift:(100,0) text:"Confession d'un enfant du siècle" mark:(line,tan2) textcolor:oeuvres

 from:start till:1809 color:musiciens text:Joseph Haydn
 at:1795 shift:(0,-8) text:"Symphonie n° 103 en mi bémol majeur, dite roulement de timbale" mark:(line,tan2) textcolor:oeuvres

  bar:6 color:auteurs width:16 mark:(line,white) align:center fontsize:XS textcolor:noms
 from:start till:1817 text:Madame de Staël
 at:1810 shift:(50,0) text:"De l Allemagne" mark:(line,tan2) textcolor:oeuvres
 at:1788 shift:(60,-8) text:"Lettres sur les ouvrages et le caractère de Jean-Jacques Rousseau" mark:(line,tan2) textcolor:oeuvres
 at:1802 shift:(40,0) text:"Delphine" mark:(line,tan2) textcolor:oeuvres
 from:1818 till:1848 text: Emily Brontë
 at:1847 shift:(-40,-8) text:"Hurlevent" mark:(line,tan2) textcolor:oeuvres

  bar:7 color:auteurs width:16 mark:(line,white) align:center fontsize:XS textcolor:noms
 from:1808 till:1855 text:Gérard de Nerval
 at:1854 shift:(-60,0) text:"Les Filles de feu + Sylvie" mark:(line,tan2) textcolor:oeuvres
 at:1855 shift:(-20,-8) text:"Aurélia" mark:(line,tan2) textcolor:oeuvres
  bar:8 color:auteurs width:16 mark:(line,white) align:center fontsize:XS textcolor:noms
 from:1811 till:1872 text:Théophile Gautier
 at:1835 shift:(-60,-8) text:"Mademoiselle de Maupin" mark:(line,tan2) textcolor:oeuvres
 at:1852 shift:(-50,-8) text:"Caprices et Zigzags" mark:(line,tan2) textcolor:oeuvres
 at:1863 shift:(-55,-8) text:"Le Capitaine Fracasse" mark:(line,tan2) textcolor:oeuvres

  bar:9 color:auteurs width:16 mark:(line,white) align:center fontsize:XS textcolor:noms
 from:1788 till:1824 text:Lord Byron
 at:1812 shift:(-45,-8) text:"Childe Harold" mark:(line,tan2) textcolor:oeuvres
 at:1814 shift:(-35,0) text:"Le Corsaire" mark:(line,tan2) textcolor:oeuvres
 at:1819 shift:(-30,-8) text:"Mazeppa" mark:(line,tan2) textcolor:oeuvres
 from:1824 till:1895 text:Alexandre Dumas fils
 at:1848 shift:(-45,-8) text:"La Dame aux camélias" mark:(line,tan2) textcolor:oeuvres
 at:1847 shift:(-120,0) text:"Aventures de quatre femmes et d un perroquet" mark:(line,tan2) textcolor:oeuvres
 at:1866 shift:(-100,-8) text:"L'affaire Clémanceau, Mémoire de l'accusé" mark:(line,tan2) textcolor:oeuvres

  bar:10 color:auteurs width:16 mark:(line,white) align:center fontsize:XS textcolor:noms
 from:1785 till:1863 text:Jacob Grimm
 at:1812 shift:(-60,-8) text:"Kinder- und Hausmärchen" mark:(line,tan2) textcolor:oeuvres
 at:1818 shift:(-40,-8) text:"Deutsche Sagen" mark:(line,tan2) textcolor:oeuvres
 at:1836 shift:(-40,-8) text:"Der Rosengarten" mark:(line,tan2) textcolor:oeuvres
  bar:11 color:auteurs width:16 mark:(line,white) align:center fontsize:XS textcolor:noms
 from:1786 till:1859 text:Wilhelm Grimm
 at:1812 shift:(-60,-8) text:"Kinder- und Hausmärchen" mark:(line,tan2) textcolor:oeuvres
 at:1818 shift:(-40,-8) text:"Deutsche Sagen" mark:(line,tan2) textcolor:oeuvres
 at:1836 shift:(-40,-8) text:"Der Rosengarten" mark:(line,tan2) textcolor:oeuvres

  bar:12 color:auteurs width:16 mark:(line,white) align:center fontsize:XS textcolor:noms
 from:1781 till:1838 text:Chamisso
 at:1814 shift:(-40,-8) text:"Peter Schlemihl" mark:(line,tan2) textcolor:oeuvres
 at:1836 shift:(-40,-8) text:"Gesammelte Werke" mark:(line,tan2) textcolor:oeuvres
 at:1830 shift:(-50,0) text:"Frauenliebe und leben" mark:(line,tan2) textcolor:oeuvres

  bar:13 color:auteurs width:16 mark:(line,white) align:center fontsize:XS textcolor:noms
 from:start till:1822 text:E.T.A Hoffmann
 at:1814 shift:(-90,-8) text:"Fantaisies à la manière de Callot" mark:(line,tan2) textcolor:oeuvres
 at:1817 shift:(-40,0) text:"Contes nocturnes" mark:(line,tan2) textcolor:oeuvres
 at:1821 shift:(-45,-8) text:"Princesse Brambilla" mark:(line,tan2) textcolor:oeuvres
 from:1822 till:1861 text:Henri Murger
 at:1854 shift:(-50,0) text:"Ballades et fantaisies" mark:(line,tan2) textcolor:oeuvres
 at:1864 shift:(-45,0) text:"Les Nuits d'hiver" mark:(line,tan2) textcolor:oeuvres
 at:1858 shift:(-70,-8) text:"Scènes de la vie de bohème" mark:(line,tan2) textcolor:oeuvres

  bar:14 color:auteurs width:16 mark:(line,white) align:center fontsize:XS textcolor:noms
 from:1795 till:1821 text:John Keats
 at:1820 shift:(-40,-8) text:"Hyperion" mark:(line,tan2) textcolor:oeuvres
 from:1821 till:1867 text:Charles Baudelaire
 at:1857 shift:(-50,-8) text:"Fleurs du mal" mark:(line,tan2) textcolor:oeuvres
 at:1845 shift:(-70,-8) text:"Le salon de 1845" mark:(line,tan2) textcolor:oeuvres
 at:1860 shift:(-70,0) text:"Les Paradis artificiels" mark:(line,tan2) textcolor:oeuvres

  bar:15 color:auteurs width:16 mark:(line,white) align:center fontsize:XS textcolor:noms
 from:1790 till:1869 text:Lamartine
 at:1820 shift:(-70,-8) text:"Méditations poétiques" mark:(line,tan2) textcolor:oeuvres
 at:1823 shift:(-80,0) text:"Nouvelles méditations poétiques" mark:(line,tan2) textcolor:oeuvres
 at:1836 shift:(-30,-8) text:"Jocelyn" mark:(line,tan2) textcolor:oeuvres

  bar:16 color:auteurs width:16 mark:(line,white) align:center fontsize:XS textcolor:noms
 from:start till:1832 text:Walter Scott
 at:1796 shift:(-50,-8) text:"Götz von Berlichingen" mark:(line,tan2) textcolor:oeuvres
 at:1820 shift:(-40,-8) text:"Ivanhoé" mark:(line,tan2) textcolor:oeuvres
 at:1829 shift:(-50,-8) text:"Anne of Geierstein" mark:(line,tan2) textcolor:oeuvres

  bar:17 color:auteurs width:16 mark:(line,white) align:center fontsize:XS textcolor:noms
 from:1797 till:1851 text:Wollstonecraft Shelley
 at:1818 shift:(-40,-8) text:"Frankenstein" mark:(line,tan2) textcolor:oeuvres
 at:1826 shift:(-40,-8) text:"The Last Man" mark:(line,tan2) textcolor:oeuvres

  bar:18 color:auteurs width:16 mark:(line,white) align:center fontsize:XS textcolor:noms
 from:1792 till:1822 text:Bysshe Shelley
 at:1820 shift:(-50,-8) text:"Prométhé délivré" mark:(line,tan2) textcolor:oeuvres
 from:1823 till:1892 text:Ernest Renan
 at:1858 shift:(-70,-8) text:"De l'origine du language" mark:(line,tan2) textcolor:oeuvres
 at:1878 shift:(-30,-8) text:"Caliban" mark:(line,tan2) textcolor:oeuvres
 at:1892 shift:(-40,-8) text:"Feuilles détachées" mark:(line,tan2) textcolor:oeuvres

  bar:19 color:auteurs width:16 mark:(line,white) align:center fontsize:XS textcolor:noms
 from:1780 till:1844 text:Charles Nodier
 at:1821 shift:(-30,0) text:"Smarra" mark:(line,tan2) textcolor:oeuvres
 at:1822 shift:(-10,-8) text:"Trilby" mark:(line,tan2) textcolor:oeuvres
 at:1844 shift:(-40,-8) text:"Franciscus Columna" mark:(line,tan2) textcolor:oeuvres

  bar:20 color:auteurs width:16 mark:(line,white) align:center fontsize:XS textcolor:noms
 from:1785 till:1859 text:Thomas de Quincey
 at:1821 shift:(-70,-8) text:"Confession d'un mangeur dopium" mark:(line,tan2) textcolor:oeuvres
 at:1832 shift:(-40,-8) text:"The Masque" mark:(line,tan2) textcolor:oeuvres
 at:1853 shift:(-50,-8) text:"Autobiographical Sketches" mark:(line,tan2) textcolor:oeuvres

  bar:21 color:auteurs width:16 mark:(line,white) align:center fontsize:XS textcolor:noms
 from:1797 till:1863 text:Alfred de Vigny
 at:1822 shift:(-30,-8) text:"Moïse" mark:(line,tan2) textcolor:oeuvres
 at:1835 shift:(-40,-8) text:"Chatterton" mark:(line,tan2) textcolor:oeuvres
 at:1864 shift:(-50,-8) text:"Les Destinées" mark:(line,tan2) textcolor:oeuvres

  bar:22 color:auteurs width:16 mark:(line,white) align:center fontsize:XS textcolor:noms
 from:1783 till:1842 text:Henri Stendhal
 at:1823 shift:(-70,-8) text:"Racine et Shakespeare" mark:(line,tan2) textcolor:oeuvres
 at:1830 shift:(-50,-8) text:"le Rouge et le Noir" mark:(line,tan2) textcolor:oeuvres
 at:1839 shift:(-70,0) text:"La chartreuse de Parme" mark:(line,tan2) textcolor:oeuvres

  bar:23 color:auteurs width:16 mark:(line,white) align:center fontsize:XS textcolor:noms
 from:1788 till:1857 text:Eichendorff
 at:1824 shift:(-70,-8) text:"Scènes de la vie d'un propre à rien" mark:(line,tan2) textcolor:oeuvres

  bar:24 color:auteurs width:16 mark:(line,white) align:center fontsize:XS textcolor:noms
 from:1799 till:1850 text:Balzac
 at:1831 shift:(-60,-8) text:"La peau de Chagrin" mark:(line,tan2) textcolor:oeuvres
 at:1835 shift:(-30,-8) text:"le Père Goriot" mark:(line,tan2) textcolor:oeuvres

  bar:25 color:auteurs width:16 mark:(line,white) align:center fontsize:XS textcolor:noms
 from:1809 till:1849 text:Edgar Allan Poe
 at:1839 shift:(-70,-8) text:"Histoires extraordinaires" mark:(line,tan2) textcolor:oeuvres
 at:1845 shift:(-30,-8) text:"Corbeau" mark:(line,tan2) textcolor:oeuvres
 at:1831 shift:(-60,-8) text:"Poèmes" mark:(line,tan2) textcolor:oeuvres


  bar:26 color:auteurs width:16 mark:(line,white) align:center fontsize:XS textcolor:noms
 from:1803 till:1870 text:Prosper Mérimée
 at:1845 shift:(-40,-8) text:"Carmen" mark:(line,tan2) textcolor:oeuvres
 at:1833 shift:(-40,-8) text:"Mosaïque" mark:(line,tan2) textcolor:oeuvres
 at:1840 shift:(-40,-8) text:"Colomba" mark:(line,tan2) textcolor:oeuvres

  bar:27 color:auteurs width:16 mark:(line,white) align:center fontsize:XS textcolor:noms
 from:1804 till:1876 text:George Sand
 at:1846 shift:(-50,-8) text:"Mare au diable" mark:(line,tan2) textcolor:oeuvres
 at:1833 shift:(-30,-8) text:"Lélia" mark:(line,tan2) textcolor:oeuvres
 at:1841 shift:(-50,-8) text:"Horace" mark:(line,tan2) textcolor:oeuvres

  bar:28 color:auteurs width:16 mark:(line,white) align:center fontsize:XS textcolor:noms
 from:start till:1846 text:Sénancour
 at:1804 shift:(-40,-8) text:"Obermann" mark:(line,tan2) textcolor:oeuvres

  bar:29 color:auteurs width:16 mark:(line,white) align:center fontsize:XS textcolor:noms
 from:start till:1821 text:Joseph de Maistre
 at:1819 shift:(-40,-8) text:"Du Pape" mark:(line,tan2) textcolor:oeuvres
 at:1796 shift:(-100,-8) text:"Considérations sur la révolution française" mark:(line,tan2) textcolor:oeuvres

  bar:30 color:auteurs width:16 mark:(line,white) align:center fontsize:XS textcolor:noms
 from:start till:1830 text:Benjamin Constant de Rebecque
 at:1816 shift:(-40,-8) text:"Adolphe" mark:(line,tan2) textcolor:oeuvres
 at:1807 shift:(-40,-8) text:"Le Cahier rouge" mark:(line,tan2) textcolor:oeuvres
 at:1851 shift:(-40,-8) text:"Cécile" mark:(line,tan2) textcolor:oeuvres

  bar:31 color:auteurs width:16 mark:(line,white) align:center fontsize:XS textcolor:noms
 from:1798 till:1874 text:Jules Michelet
 at:1833 shift:(-70,-8) text:"Histoire de France (le Moyen Age)" mark:(line,tan2) textcolor:oeuvres

  bar:32 color:auteurs width:16 mark:(line,white) align:center fontsize:XS textcolor:noms
 from:1804 till:1869 text:Charles-Augustin Sainte-Beuve
 at:1835 shift:(-40,-8) text:"Volupté" mark:(line,tan2) textcolor:oeuvres
 at:1839 shift:(-30,-8) text:"Christel" mark:(line,tan2) textcolor:oeuvres
 at:1880 shift:(-40,-8) text:"La pendule" mark:(line,tan2) textcolor:oeuvres

  bar:33 color:auteurs width:16 mark:(line,white) align:center fontsize:XS textcolor:noms
 from:1786 till:1859 text:Marceline Desbordes-Valmore
 at:1819 shift:(-40,-8) text:"élégies et romances" mark:(line,tan2) textcolor:oeuvres
 at:1833 shift:(-40,-8) text:"Les Pleurs" mark:(line,tan2) textcolor:oeuvres
 at:1843 shift:(-50,-8) text:"Bouquet et prières" mark:(line,tan2) textcolor:oeuvres

  bar:34 color:auteurs width:16 mark:(line,white) align:center fontsize:XS textcolor:noms
 from:1795 till:1856 text:Jacques Nicolas Augustin Thierry
 at:1850 shift:(-60,-8) text:"Essai sur le tiers état" mark:(line,tan2) textcolor:oeuvres

  bar:35 color:auteurs width:16 mark:(line,white) align:center fontsize:XS textcolor:noms
 from:1810 till:1839 text:Maurice de Guérin
 at:1830 shift:(-40,-8) text:"Centaure" mark:(line,tan2) textcolor:oeuvres

  bar:36 color:auteurs width:16 mark:(line,white) align:center fontsize:XS textcolor:noms
 from:1804 till:1857 text:Eugène Sue
 at:1843 shift:(-50,-8) text:"Les mystère de Paris" mark:(line,tan2) textcolor:oeuvres
 at:1845 shift:(-40,0) text:"Le Juif errant" mark:(line,tan2) textcolor:oeuvres

  bar:37 color:auteurs width:16 mark:(line,white) align:center fontsize:XS textcolor:noms
 from:1818 till:1894 text:Leconte de Lisle
 at:1852 shift:(-50,-8) text:"Poèmes antiques" mark:(line,tan2) textcolor:oeuvres
 at:1862 shift:(-50,-8) text:"Poésies barbares" mark:(line,tan2) textcolor:oeuvres
 at:1888 shift:(-50,-8) text:"L'Apollonide" mark:(line,tan2) textcolor:oeuvres

  bar:38 color:auteurs width:16 mark:(line,white) align:center fontsize:XS textcolor:noms
 from:1808 till:1889 text:Barbey d'Aurevilly
 at:1851 shift:(-50,-8) text:"Une vieille maîtresse" mark:(line,tan2) textcolor:oeuvres
 at:1864 shift:(-50,-8) text:"Chevalier Destouches" mark:(line,tan2) textcolor:oeuvres
 at:1874 shift:(-50,-8) text:"Les diaboliques" mark:(line,tan2) textcolor:oeuvres

  bar:39 color:auteurs width:16 mark:(line,white) align:center fontsize:XS textcolor:noms
 from:1828 till:1893 text:Hippolyte Taine
 at:1853 shift:(-60,-8) text:"La Fontaine et ses fables" mark:(line,tan2) textcolor:oeuvres
 at:1865 shift:(-50,-8) text:"Philosophie de l'art" mark:(line,tan2) textcolor:oeuvres
 at:1870 shift:(-40,0) text:"De l'intelligence" mark:(line,tan2) textcolor:oeuvres
 from:start till:1827 color:musiciens text:Ludwig van Beethoven
 at:1805 shift:(-40,-8) text:"Fidelio" mark:(line,tan2) textcolor:oeuvres
 at:1822 shift:(-50,-8) text:"Missa Solemnis" mark:(line,tan2) textcolor:oeuvres
 at:1808 shift:(50,0) text:"Symphonie pastorale" mark:(line,tan2) textcolor:oeuvres

  bar:40 color:auteurs width:16 mark:(line,white) align:center fontsize:XS textcolor:noms
 from:1805 till:1871 text:Jean Eugène Robert-Houdin
 at:1857 shift:(-100,-8) text:"Confidences d'un prestidigitateur" mark:(line,tan2) textcolor:oeuvres
 at:1868 shift:(-100,0) text:"Secrets de la prestidigitation et de la magie" mark:(line,tan2) textcolor:oeuvres

  bar:41 color:musiciens width:16 mark:(line,white) align:center fontsize:XS textcolor:noms
 from:1810 till:1849 text:Frédéric Chopin
 at:1831 shift:(-50,-8) text:"Révolutionnaire" mark:(line,tan2) textcolor:oeuvres
 at:1838 shift:(-30,-8) text:"Préludes" mark:(line,tan2) textcolor:oeuvres
 at:1846 shift:(-40,-8) text:"Barcarolle" mark:(line,tan2) textcolor:oeuvres

  bar:42 color:musiciens width:16 mark:(line,white) align:center fontsize:XS textcolor:noms
 from:1810 till:1856 text:Robert Schumann
 at:1838 shift:(-40,-8) text:"Kreisleriana" mark:(line,tan2) textcolor:oeuvres
 at:1853 shift:(-50,-8) text:"Gesänge der Fruhe" mark:(line,tan2) textcolor:oeuvres
 at:1851 shift:(-50,0) text:"Marchenbilder" mark:(line,tan2) textcolor:oeuvres

  bar:43 color:musiciens width:16 mark:(line,white) align:center fontsize:XS textcolor:noms
 from:1811 till:1886 text:Franz Liszt
 at:1853 shift:(-50,-8) text:"Sonate en si" mark:(line,tan2) textcolor:oeuvres
 at:1857 shift:(-40,0) text:"Faust Symphonie" mark:(line,tan2) textcolor:oeuvres
 at:1870 shift:(-30,0) text:"Mazeppa" mark:(line,tan2) textcolor:oeuvres

  bar:44 color:musiciens width:16 mark:(line,white) align:center fontsize:XS textcolor:noms
 from:1813 till:end text:Giuseppe Verdi
 at:1844 shift:(-40,-8) text:"Hernani" mark:(line,tan2) textcolor:oeuvres
 at:1851 shift:(-40,-8) text:"Rigoletto" mark:(line,tan2) textcolor:oeuvres
 at:1853 shift:(-35,0) text:"La Traviata" mark:(line,tan2) textcolor:oeuvres

  bar:45 color:musiciens width:16 mark:(line,white) align:center fontsize:XS textcolor:noms
 from:1813 till:1883 text:Richard Wagner
 at:1845 shift:(-40,0) text:"Tannhäuser" mark:(line,tan2) textcolor:oeuvres
 at:1848 shift:(-40,-8) text:"Lohengrin" mark:(line,tan2) textcolor:oeuvres
 at:1856 shift:(-40,-8) text:"La Walkyrie" mark:(line,tan2) textcolor:oeuvres

  bar:46 color:peintres width:16 mark:(line,white) align:center fontsize:XS textcolor:noms
 from:start till:1828 text:Francisco Goya
 at:1799 shift:(-50,-8) text:"Los Caprichos" mark:(line,tan2) textcolor:oeuvres
 at:1814 shift:(-50,-8) text:"Dos de Mayo" mark:(line,tan2) textcolor:oeuvres
 at:1823 shift:(-50,0) text:"Saturne dévorant un de ses enfants" mark:(line,tan2) textcolor:oeuvres

  bar:47 color:musiciens width:16 mark:(line,white) align:center fontsize:XS textcolor:noms
 from:1797 till:1828 text:Franz Schubert
 at:1817 shift:(-50,-8) text:"La Jeune fille et la mort" mark:(line,tan2) textcolor:oeuvres
 at:1819 shift:(-25,0) text:"La Truite" mark:(line,tan2) textcolor:oeuvres
 at:1827 shift:(-40,-8) text:"Winterreise" mark:(line,tan2) textcolor:oeuvres

  bar:48 color:peintres width:16 mark:(line,white) align:center fontsize:XS textcolor:noms
 from:1791 till:1824 text:Théodore Géricault
 at:1819 shift:(-60,-8) text:"Le Radeau de la Méduse" mark:(line,tan2) textcolor:oeuvres
 at:1821 shift:(-50,0) text:"Le derby d'Epsom" mark:(line,tan2) textcolor:oeuvres
 at:1822 shift:(-20,-8) text:"L'Aliéné" mark:(line,tan2) textcolor:oeuvres

  bar:49 color:musiciens width:16 mark:(line,white) align:center fontsize:XS textcolor:noms
 from:1786 till:1826 text:Carl Maria von Weber
 at:1821 shift:(-50,-8) text:"Freischütz" mark:(line,tan2) textcolor:oeuvres

  bar:50 color:peintres width:16 mark:(line,white) align:center fontsize:XS textcolor:noms
 from:1798 till:1863 text:Eugène Delacroix
 at:1824 shift:(-50,0) text:"Massacre de Scio" mark:(line,tan2) textcolor:oeuvres
 at:1830 shift:(-50,-8) text:"Liberté guidant le peuple" mark:(line,tan2) textcolor:oeuvres
 at:1834 shift:(50,-8) text:"Femmes d'Alger" mark:(line,tan2) textcolor:oeuvres

  bar:51 color:musiciens width:16 mark:(line,white) align:center fontsize:XS textcolor:noms
 from:1809 till:1847 text:Felix Mendelssohn-Bartholdy
 at:1843 shift:(-50,-8) text:"Songe d'une nuit d'été" mark:(line,tan2) textcolor:oeuvres
 at:1839 shift:(-20,0) text:"Ruy Blas" mark:(line,tan2) textcolor:oeuvres
 at:1836 shift:(-20,0) text:"Paulus" mark:(line,tan2) textcolor:oeuvres

  bar:52 color:musiciens width:16 mark:(line,white) align:center fontsize:XS textcolor:noms
 from:1803 till:1869 text:Hector Berlioz
 at:1830 shift:(-50,-8) text:"Symphonie fantastique" mark:(line,tan2) textcolor:oeuvres
 at:1837 shift:(-30,-8) text:"Requiem" mark:(line,tan2) textcolor:oeuvres
 at:1846 shift:(-50,-8) text:"Malédiction de Faust" mark:(line,tan2) textcolor:oeuvres

  bar:53 color:peintres width:16 mark:(line,white) align:center fontsize:XS textcolor:noms
 from:start till:1851 text:Joseph Mallord William Turner
 at:1796 shift:(-50,0) text:"Pêcheurs en mer" mark:(line,tan2) textcolor:oeuvres
 at:1815 shift:(-50,-8) text:"La Traversée du ruisseau" mark:(line,tan2) textcolor:oeuvres
 at:1835 shift:(-50,-8) text:"Musique à Petworth" mark:(line,tan2) textcolor:oeuvres

  bar:54 color:peintres width:16 mark:(line,white) align:center fontsize:XS textcolor:noms
 from:1789 till:1862 text:Wilhelm von Schadow
 at:1818 shift:(-90,0) text:"Portrait d'une jeune fille romaine" mark:(line,tan2) textcolor:oeuvres
 at:1818 shift:(-90,-8) text:"La Sainte Famille sous le portique" mark:(line,tan2) textcolor:oeuvres

  bar:55 color:peintres width:16 mark:(line,white) align:center fontsize:XS textcolor:noms
 from:1815 till:end text:Adolph von Menzel
 at:1875 shift:(-40,-8) text:"La Forge" mark:(line,tan2) textcolor:oeuvres
 at:1843 shift:(-120,-8) text:"Illustrationen zu den Werken Friedrichs des Grossen" mark:(line,tan2) textcolor:oeuvres
| Template:Concepteurs de la tour Eiffel | top next |
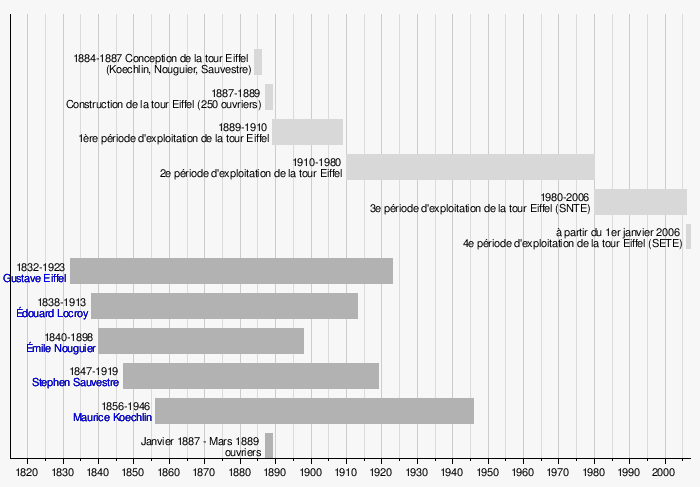
Initial version by Kuxu on Wednesday, June 7, 2006
DateFormat = yyyy
ImageSize  = width:700 height:auto barincrement:37
PlotArea   = left:10 right:10 bottom:30 top:15

Colors     =
  id:canvas      value:rgb(0.97,0.97,0.97)
  id:grid1       value:rgb(0.80,0.80,0.80)
  id:grid2       value:rgb(0.86,0.86,0.86)
  id:gris1       value:gray(0.85)
  id:gris2       value:gray(0.70)
  id:noir        value:black

Period     = from:1815 till:2007
TimeAxis   = orientation:horizontal format:yyyy
ScaleMajor = unit:year  increment:10 start:1820 gridcolor:grid1
ScaleMinor = unit:year  increment:5  start:1825 gridcolor:grid2
AlignBars  = justify

BackgroundColors = canvas:canvas bars:canvas

BarData=
  bar:Timeperiod
  barset:gris1

PlotData=
  width:25 fontsize:M textcolor:noir align:center

  # Les bâtiments
  width:25 fontsize:S textcolor:black anchor:from align:left color:gris1
  barset:gris1
  align:right
  from:1884 till:1886 text:"1884-1887 Conception de la tour Eiffel ~(Koechlin, Nouguier, Sauvestre)"
  from:1887 till:1889 text:"1887-1889 ~Construction de la tour Eiffel (250 ouvriers)"
  from:1889 till:1909 text:"1889-1910 ~1ère période d'exploitation de la tour Eiffel"
  from:1910 till:1980 text:"1910-1980 ~2e période d'exploitation de la tour Eiffel"
  from:1980 till:2006 text:"1980-2006 ~3e période d'exploitation de la tour Eiffel (SNTE)"
  from:2006 till:2007 text:"à partir du 1er janvier 2006 ~4e période d'exploitation de la tour Eiffel (SETE)"

  from:1832 till:1923 color:gris2 text:"1832-1923 ~[[Gustave Eiffel]]"
  from:1838 till:1913 color:gris2 text:"1838-1913 ~[[Édouard Locroy]]"
  from:1840 till:1898 color:gris2 text:"1840-1898 ~[[Émile Nouguier]]"
  from:1847 till:1919 color:gris2 text:"1847-1919 ~[[Stephen Sauvestre]]"
  from:1856 till:1946 color:gris2 text:"1856-1946 ~[[Maurice Koechlin]]"
  from:1887 till:1889 color:gris2 text:"Janvier 1887 - Mars 1889 ~ouvriers"
| Template:Leader du classement mondial de la FIFA | top next |

Initial version by Clio64 on Tuesday, June 13, 2006
ImageSize = width:140 height:800
PlotArea  = left:40 right:0 bottom:10 top:10
DateFormat = dd/mm/yyyy
Period     = from:01/01/1993 till:01/06/2006
ScaleMajor = unit:year increment:1 start:1993

TimeAxis = orientation:vertical format:yyyy

Colors =
  id:Brasil  value:yellow
  id:Germany     value:black
  id:France         value:blue
  id:Italy     value:green

PlotData=
  bar:Leaders width:25 mark:(line,white) align:left fontsize:S

  from:01/08/1993 till:01/09/1993 shift:(20,-8) text:"[[équipe d'Allemagne de football|Allemagne]]" color:Germany
   from:01/09/1993 till:01/11/1993 shift:(20,-6) text:"[[équipe du Brésil de football|Brésil]]" color:Brasil
  from:01/11/1993 till:01/12/1993 shift:(20,-3) text:"[[équipe d'Italie de football|Italie]]" color:Italy
  from:01/12/1993 till:01/04/1994 shift:(20,-3) text:"[[équipe d'Allemagne de football|Allemagne]]" color:Germany
  from:01/04/1994 till:01/06/1994 shift:(20,-5) text:"[[équipe du Brésil de football|Brésil]]" color:Brasil
  from:01/06/1994 till:01/07/1994 shift:(20,-2) text:"[[équipe d'Allemagne de football|Allemagne]]" color:Germany
  from:01/07/1994 till:01/05/2001 shift:(20,0) text:"[[équipe du Brésil de football|Brésil]]" color:Brasil
  from:01/05/2001 till:01/06/2002 shift:(20,0) text:"[[équipe de France de football|France]]" color:France
  from:01/06/2002 till:end shift:(20,0) text:"[[équipe du Brésil de football|Brésil]]" color:Brasil
| Crypt of Civilization | top next |

Initial version by IP 84.5 on Wednesday, June 14, 2006
DateFormat = yyyy
TimeAxis = orientation:horizontal format:yyyy
Period = from:-4241 till:8113
ScaleMajor = unit:year increment:6177 start:-4241
ImageSize = width:300 height:50
PlotArea = left:20 bottom:20 top:0 right:20
| Zapponeta | top next |
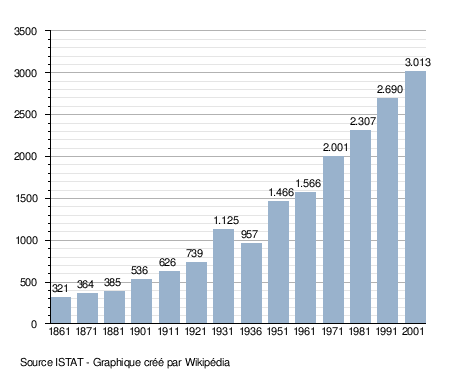
Initial version by Valérie75 on Saturday, June 17, 2006
Colors=
  id:lightgrey value:gray(0.9)
  id:darkgrey  value:gray(0.7)
  id:sfondo value:rgb(1,1,1)
  id:barra value:rgb(0.6,0.7,0.8)

ImageSize  = width:455 height:373
PlotArea   = left:50 bottom:50 top:30 right:30
DateFormat = x.y
Period     = from:0 till:3500
TimeAxis   = orientation:vertical
AlignBars  = justify
ScaleMajor = gridcolor:darkgrey increment:500 start:0
ScaleMinor = gridcolor:lightgrey increment:100 start:0
BackgroundColors = canvas:sfondo

BarData=
  bar:1861 text:1861
  bar:1871 text:1871
  bar:1881 text:1881
  bar:1901 text:1901
  bar:1911 text:1911
  bar:1921 text:1921
  bar:1931 text:1931
  bar:1936 text:1936
  bar:1951 text:1951
  bar:1961 text:1961
  bar:1971 text:1971
  bar:1981 text:1981
  bar:1991 text:1991
  bar:2001 text:2001

PlotData=
  color:barra width:20 align:left

  bar:1861 from:0 till: 321
  bar:1871 from:0 till: 364
  bar:1881 from:0 till: 385
  bar:1901 from:0 till: 536
  bar:1911 from:0 till: 626
  bar:1921 from:0 till: 739
  bar:1931 from:0 till: 1125
  bar:1936 from:0 till: 957
  bar:1951 from:0 till: 1466
  bar:1961 from:0 till: 1566
  bar:1971 from:0 till: 2001
  bar:1981 from:0 till: 2307
  bar:1991 from:0 till: 2690
  bar:2001 from:0 till: 3013

PlotData=

  bar:1861 at: 321 fontsize:S text: 321 shift:(-8,5)
  bar:1871 at: 364 fontsize:S text: 364 shift:(-10,5)
  bar:1881 at: 385 fontsize:S text: 385 shift:(-10,5)
  bar:1901 at: 536 fontsize:S text: 536 shift:(-10,5)
  bar:1911 at: 626 fontsize:S text: 626 shift:(-10,5)
  bar:1921 at: 739 fontsize:S text: 739 shift:(-10,5)
  bar:1931 at: 1125 fontsize:S text: 1.125 shift:(-10,5)
  bar:1936 at: 957 fontsize:S text: 957 shift:(-10,5)
  bar:1951 at: 1466 fontsize:S text: 1.466 shift:(-10,5)
  bar:1961 at: 1566 fontsize:S text: 1.566 shift:(-10,5)
  bar:1971 at: 2001 fontsize:S text: 2.001 shift:(-10,5)
  bar:1981 at: 2307 fontsize:S text: 2.307 shift:(-10,5)
  bar:1991 at: 2690 fontsize:S text: 2.690 shift:(-10,5)
  bar:2001 at: 3013 fontsize:S text: 3.013 shift:(-10,5)

TextData=
  fontsize:S pos:(20,20)
  text:Source ISTAT - Graphique créé par Wikipédia
| Volturino | top next |

Initial version by Valérie75 on Saturday, June 17, 2006
Colors=
  id:lightgrey value:gray(0.9)
  id:darkgrey  value:gray(0.7)
  id:sfondo value:rgb(1,1,1)
  id:barra value:rgb(0.6,0.7,0.8)

ImageSize  = width:455 height:373
PlotArea   = left:50 bottom:50 top:30 right:30
DateFormat = x.y
Period     = from:0 till:4500
TimeAxis   = orientation:vertical
AlignBars  = justify
ScaleMajor = gridcolor:darkgrey increment:500 start:0
ScaleMinor = gridcolor:lightgrey increment:100 start:0
BackgroundColors = canvas:sfondo

BarData=
  bar:1861 text:1861
  bar:1871 text:1871
  bar:1881 text:1881
  bar:1901 text:1901
  bar:1911 text:1911
  bar:1921 text:1921
  bar:1931 text:1931
  bar:1936 text:1936
  bar:1951 text:1951
  bar:1961 text:1961
  bar:1971 text:1971
  bar:1981 text:1981
  bar:1991 text:1991
  bar:2001 text:2001

PlotData=
  color:barra width:20 align:left

  bar:1861 from:0 till: 3073
  bar:1871 from:0 till: 3068
  bar:1881 from:0 till: 3364
  bar:1901 from:0 till: 3324
  bar:1911 from:0 till: 3503
  bar:1921 from:0 till: 3300
  bar:1931 from:0 till: 3777
  bar:1936 from:0 till: 4030
  bar:1951 from:0 till: 3813
  bar:1961 from:0 till: 3364
  bar:1971 from:0 till: 2875
  bar:1981 from:0 till: 2798
  bar:1991 from:0 till: 2224
  bar:2001 from:0 till: 1992

PlotData=

  bar:1861 at: 3073 fontsize:S text: 3.073 shift:(-8,5)
  bar:1871 at: 3068 fontsize:S text: 3.068 shift:(-10,5)
  bar:1881 at: 3364 fontsize:S text: 3.364 shift:(-10,5)
  bar:1901 at: 3324 fontsize:S text: 3.324 shift:(-10,5)
  bar:1911 at: 3503 fontsize:S text: 3.503 shift:(-10,5)
  bar:1921 at: 3300 fontsize:S text: 3.300 shift:(-10,5)
  bar:1931 at: 3777 fontsize:S text: 3.777 shift:(-10,5)
  bar:1936 at: 4030 fontsize:S text: 4.030 shift:(-10,5)
  bar:1951 at: 3813 fontsize:S text: 3.813 shift:(-10,5)
  bar:1961 at: 3364 fontsize:S text: 3.364 shift:(-10,5)
  bar:1971 at: 2875 fontsize:S text: 2.875 shift:(-10,5)
  bar:1981 at: 2798 fontsize:S text: 2.798 shift:(-10,5)
  bar:1991 at: 2224 fontsize:S text: 2.224 shift:(-10,5)
  bar:2001 at: 1992 fontsize:S text: 1.992 shift:(-10,5)

TextData=
  fontsize:S pos:(20,20)
  text:Source ISTAT - Graphique créé par Wikipédia
| Volturara Appula | top next |

Initial version by Valérie75 on Saturday, June 17, 2006
Colors=
  id:lightgrey value:gray(0.9)
  id:darkgrey  value:gray(0.7)
  id:sfondo value:rgb(1,1,1)
  id:barra value:rgb(0.6,0.7,0.8)

ImageSize  = width:455 height:373
PlotArea   = left:50 bottom:50 top:30 right:30
DateFormat = x.y
Period     = from:0 till:3000
TimeAxis   = orientation:vertical
AlignBars  = justify
ScaleMajor = gridcolor:darkgrey increment:500 start:0
ScaleMinor = gridcolor:lightgrey increment:100 start:0
BackgroundColors = canvas:sfondo

BarData=
  bar:1861 text:1861
  bar:1871 text:1871
  bar:1881 text:1881
  bar:1901 text:1901
  bar:1911 text:1911
  bar:1921 text:1921
  bar:1931 text:1931
  bar:1936 text:1936
  bar:1951 text:1951
  bar:1961 text:1961
  bar:1971 text:1971
  bar:1981 text:1981
  bar:1991 text:1991
  bar:2001 text:2001

PlotData=
  color:barra width:20 align:left

  bar:1861 from:0 till: 2791
  bar:1871 from:0 till: 2350
  bar:1881 from:0 till: 2500
  bar:1901 from:0 till: 2649
  bar:1911 from:0 till: 2469
  bar:1921 from:0 till: 2382
  bar:1931 from:0 till: 2118
  bar:1936 from:0 till: 2229
  bar:1951 from:0 till: 2016
  bar:1961 from:0 till: 1671
  bar:1971 from:0 till: 1312
  bar:1981 from:0 till: 1098
  bar:1991 from:0 till: 744
  bar:2001 from:0 till: 595

PlotData=

  bar:1861 at: 2791 fontsize:S text: 2.791 shift:(-8,5)
  bar:1871 at: 2350 fontsize:S text: 2.350 shift:(-10,5)
  bar:1881 at: 2500 fontsize:S text: 2.500 shift:(-10,5)
  bar:1901 at: 2649 fontsize:S text: 2.649 shift:(-10,5)
  bar:1911 at: 2469 fontsize:S text: 2.469 shift:(-10,5)
  bar:1921 at: 2382 fontsize:S text: 2.382 shift:(-10,5)
  bar:1931 at: 2118 fontsize:S text: 2.118 shift:(-10,5)
  bar:1936 at: 2229 fontsize:S text: 2.229 shift:(-10,5)
  bar:1951 at: 2016 fontsize:S text: 2.016 shift:(-10,5)
  bar:1961 at: 1671 fontsize:S text: 1.671 shift:(-10,5)
  bar:1971 at: 1312 fontsize:S text: 1.312 shift:(-10,5)
  bar:1981 at: 1098 fontsize:S text: 1.098 shift:(-10,5)
  bar:1991 at: 744 fontsize:S text: 744 shift:(-10,5)
  bar:2001 at: 595 fontsize:S text: 595 shift:(-10,5)

TextData=
  fontsize:S pos:(20,20)
  text:Source ISTAT - Graphique créé par Wikipédia
| Vico del Gargano | top next |

Initial version by Valérie75 on Saturday, June 17, 2006
Colors=
  id:lightgrey value:gray(0.9)
  id:darkgrey  value:gray(0.7)
  id:sfondo value:rgb(1,1,1)
  id:barra value:rgb(0.6,0.7,0.8)

ImageSize  = width:455 height:373
PlotArea   = left:50 bottom:50 top:30 right:30
DateFormat = x.y
Period     = from:0 till:15000
TimeAxis   = orientation:vertical
AlignBars  = justify
ScaleMajor = gridcolor:darkgrey increment:5000 start:0
ScaleMinor = gridcolor:lightgrey increment:1000 start:0
BackgroundColors = canvas:sfondo

BarData=
  bar:1861 text:1861
  bar:1871 text:1871
  bar:1881 text:1881
  bar:1901 text:1901
  bar:1911 text:1911
  bar:1921 text:1921
  bar:1931 text:1931
  bar:1936 text:1936
  bar:1951 text:1951
  bar:1961 text:1961
  bar:1971 text:1971
  bar:1981 text:1981
  bar:1991 text:1991
  bar:2001 text:2001

PlotData=
  color:barra width:20 align:left

  bar:1861 from:0 till: 8273
  bar:1871 from:0 till: 7830
  bar:1881 from:0 till: 8392
  bar:1901 from:0 till: 9242
  bar:1911 from:0 till: 9217
  bar:1921 from:0 till: 9198
  bar:1931 from:0 till: 10065
  bar:1936 from:0 till: 8809
  bar:1951 from:0 till: 9426
  bar:1961 from:0 till: 9243
  bar:1971 from:0 till: 8589
  bar:1981 from:0 till: 8657
  bar:1991 from:0 till: 8323
  bar:2001 from:0 till: 8107

PlotData=

  bar:1861 at: 8273 fontsize:S text: 8.273 shift:(-8,5)
  bar:1871 at: 7830 fontsize:S text: 7.830 shift:(-10,5)
  bar:1881 at: 8392 fontsize:S text: 8.392 shift:(-10,5)
  bar:1901 at: 9242 fontsize:S text: 9.242 shift:(-10,5)
  bar:1911 at: 9217 fontsize:S text: 9.217 shift:(-10,5)
  bar:1921 at: 9198 fontsize:S text: 9.198 shift:(-10,5)
  bar:1931 at: 10065 fontsize:S text: 10.065 shift:(-10,5)
  bar:1936 at: 8809 fontsize:S text: 8.809 shift:(-10,5)
  bar:1951 at: 9426 fontsize:S text: 9.426 shift:(-10,5)
  bar:1961 at: 9243 fontsize:S text: 9.243 shift:(-10,5)
  bar:1971 at: 8589 fontsize:S text: 8.589 shift:(-10,5)
  bar:1981 at: 8657 fontsize:S text: 8.657 shift:(-10,5)
  bar:1991 at: 8323 fontsize:S text: 8.323 shift:(-10,5)
  bar:2001 at: 8107 fontsize:S text: 8.107 shift:(-10,5)

TextData=
  fontsize:S pos:(20,20)
  text:Source ISTAT - Graphique créé par Wikipédia
| Trinitapoli | top next |

Initial version by Valérie75 on Saturday, June 17, 2006
Colors=
  id:lightgrey value:gray(0.9)
  id:darkgrey  value:gray(0.7)
  id:sfondo value:rgb(1,1,1)
  id:barra value:rgb(0.6,0.7,0.8)

ImageSize  = width:455 height:373
PlotArea   = left:50 bottom:50 top:30 right:30
DateFormat = x.y
Period     = from:0 till:15000
TimeAxis   = orientation:vertical
AlignBars  = justify
ScaleMajor = gridcolor:darkgrey increment:5000 start:0
ScaleMinor = gridcolor:lightgrey increment:1000 start:0
BackgroundColors = canvas:sfondo

BarData=
  bar:1861 text:1861
  bar:1871 text:1871
  bar:1881 text:1881
  bar:1901 text:1901
  bar:1911 text:1911
  bar:1921 text:1921
  bar:1931 text:1931
  bar:1936 text:1936
  bar:1951 text:1951
  bar:1961 text:1961
  bar:1971 text:1971
  bar:1981 text:1981
  bar:1991 text:1991
  bar:2001 text:2001

PlotData=
  color:barra width:20 align:left

  bar:1861 from:0 till: 6290
  bar:1871 from:0 till: 6614
  bar:1881 from:0 till: 8076
  bar:1901 from:0 till: 10343
  bar:1911 from:0 till: 11615
  bar:1921 from:0 till: 11106
  bar:1931 from:0 till: 12722
  bar:1936 from:0 till: 12424
  bar:1951 from:0 till: 14701
  bar:1961 from:0 till: 14226
  bar:1971 from:0 till: 13019
  bar:1981 from:0 till: 13296
  bar:1991 from:0 till: 13604
  bar:2001 from:0 till: 14448

PlotData=

  bar:1861 at: 6290 fontsize:S text: 6.290 shift:(-8,5)
  bar:1871 at: 6614 fontsize:S text: 6.614 shift:(-10,5)
  bar:1881 at: 8076 fontsize:S text: 8.076 shift:(-10,5)
  bar:1901 at: 10343 fontsize:S text: 10.343 shift:(-10,5)
  bar:1911 at: 11615 fontsize:S text: 11.615 shift:(-10,5)
  bar:1921 at: 11106 fontsize:S text: 11.106 shift:(-10,5)
  bar:1931 at: 12722 fontsize:S text: 12.722 shift:(-10,5)
  bar:1936 at: 12424 fontsize:S text: 12.424 shift:(-10,5)
  bar:1951 at: 14701 fontsize:S text: 14.701 shift:(-10,5)
  bar:1961 at: 14226 fontsize:S text: 14.226 shift:(-10,5)
  bar:1971 at: 13019 fontsize:S text: 13.019 shift:(-10,5)
  bar:1981 at: 13296 fontsize:S text: 13.296 shift:(-10,5)
  bar:1991 at: 13604 fontsize:S text: 13.604 shift:(-10,5)
  bar:2001 at: 14448 fontsize:S text: 14.448 shift:(-10,5)

TextData=
  fontsize:S pos:(20,20)
  text:Source ISTAT - Graphique créé par Wikipédia
| Torremaggiore | top next |

Initial version by Valérie75 on Saturday, June 17, 2006
Colors=
  id:lightgrey value:gray(0.9)
  id:darkgrey  value:gray(0.7)
  id:sfondo value:rgb(1,1,1)
  id:barra value:rgb(0.6,0.7,0.8)

ImageSize  = width:455 height:373
PlotArea   = left:50 bottom:50 top:30 right:30
DateFormat = x.y
Period     = from:0 till:20000
TimeAxis   = orientation:vertical
AlignBars  = justify
ScaleMajor = gridcolor:darkgrey increment:5000 start:0
ScaleMinor = gridcolor:lightgrey increment:1000 start:0
BackgroundColors = canvas:sfondo

BarData=
  bar:1861 text:1861
  bar:1871 text:1871
  bar:1881 text:1881
  bar:1901 text:1901
  bar:1911 text:1911
  bar:1921 text:1921
  bar:1931 text:1931
  bar:1936 text:1936
  bar:1951 text:1951
  bar:1961 text:1961
  bar:1971 text:1971
  bar:1981 text:1981
  bar:1991 text:1991
  bar:2001 text:2001

PlotData=
  color:barra width:20 align:left

  bar:1861 from:0 till: 6707
  bar:1871 from:0 till: 7164
  bar:1881 from:0 till: 8311
  bar:1901 from:0 till: 11124
  bar:1911 from:0 till: 12518
  bar:1921 from:0 till: 12589
  bar:1931 from:0 till: 14506
  bar:1936 from:0 till: 15198
  bar:1951 from:0 till: 18270
  bar:1961 from:0 till: 17318
  bar:1971 from:0 till: 16316
  bar:1981 from:0 till: 17074
  bar:1991 from:0 till: 17405
  bar:2001 from:0 till: 17021

PlotData=

  bar:1861 at: 6707 fontsize:S text: 6.707 shift:(-8,5)
  bar:1871 at: 7164 fontsize:S text: 7.164 shift:(-10,5)
  bar:1881 at: 8311 fontsize:S text: 8.311 shift:(-10,5)
  bar:1901 at: 11124 fontsize:S text: 11.124 shift:(-10,5)
  bar:1911 at: 12518 fontsize:S text: 12.518 shift:(-10,5)
  bar:1921 at: 12589 fontsize:S text: 12.589 shift:(-10,5)
  bar:1931 at: 14506 fontsize:S text: 14.506 shift:(-10,5)
  bar:1936 at: 15198 fontsize:S text: 15.198 shift:(-10,5)
  bar:1951 at: 18270 fontsize:S text: 18.270 shift:(-10,5)
  bar:1961 at: 17318 fontsize:S text: 17.318 shift:(-10,5)
  bar:1971 at: 16316 fontsize:S text: 16.316 shift:(-10,5)
  bar:1981 at: 17074 fontsize:S text: 17.074 shift:(-10,5)
  bar:1991 at: 17405 fontsize:S text: 17.405 shift:(-10,5)
  bar:2001 at: 17021 fontsize:S text: 17.021 shift:(-10,5)

TextData=
  fontsize:S pos:(20,20)
  text:Source ISTAT - Graphique créé par Wikipédia
| Template:Démographie/Aulnay-sous-Bois | top next |

Initial version by Suaudeau on Wednesday, June 28, 2006
Colors=
  id:lightgrey value:gray(0.9)
  id:darkgrey  value:gray(0.7)
  id:sfondo value:rgb(1,1,1)
  id:barra value:rgb(0.6,0.7,0.8)

ImageSize  = width:250 height:350
PlotArea   = left:50 bottom:50 top:30 right:30
DateFormat = x.y
Period     = from:0 till:85000
TimeAxis   = orientation:vertical
AlignBars  = justify
ScaleMajor = gridcolor:darkgrey increment:10000 start:0
ScaleMinor = gridcolor:lightgrey increment:5000 start:0
BackgroundColors = canvas:sfondo

BarData=
  bar:1962 text:1962
  bar:1968 text:1968
  bar:1975 text:1975
  bar:1982 text:1982
  bar:1990 text:1990
  bar:1999 text:1999

PlotData=
  color:barra width:20 align:left
  bar:1962 from:0 till: 47507
  bar:1968 from:0 till: 61521
  bar:1975 from:0 till: 78137
  bar:1982 from:0 till: 75996
  bar:1990 from:0 till: 82314
  bar:1999 from:0 till: 80021

PlotData=
  bar:1962 at: 47507 fontsize:XS text: 47.507 shift:(-8,5)
  bar:1968 at: 61521 fontsize:XS text: 61.521 shift:(-10,5)
  bar:1975 at: 78137 fontsize:XS text: 78.137 shift:(-10,5)
  bar:1982 at: 75996 fontsize:XS text: 75.996 shift:(-10,5)
  bar:1990 at: 82314 fontsize:XS text: 82.314 shift:(-10,5)
  bar:1999 at: 80021 fontsize:XS text: 80.021 shift:(-10,5)
| Template:Infobox Hadéen | top next |
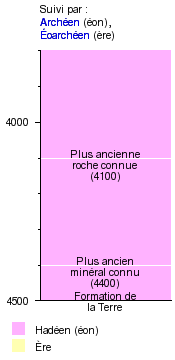
Initial version by Jd on Sunday, July 2, 2006
ImageSize  = width:175 height:355
PlotArea   = left:40 right:5 bottom:60 top:45
AlignBars  = justify

DateFormat  = yyyy
Period      = from:3800 till:4500
TimeAxis    = orientation:vertical order:reverse
ScaleMajor  = unit:year increment:500 start:4000
ScaleMinor  = unit:year increment:100 start:3800

Colors =
  id:eon    value:rgb(1,0.7,1)  legend:Hadéen_(éon)
  id:era    value:rgb(1,1,0.7)  legend:Ère
  id:black  value:black

Legend = left:15 top:40

BarData =
  bar:eon
  bar:era

PlotData=
  width:130 align:center textcolor:black mark:(line,black)

  bar:eon color:eon

  from:3800  till:end  mark:none  shift:(0,-100)
  at:4500  mark:none  text:Formation de~la Terre
  at:4400  mark:(line,white)  textcolor:black  text:Plus ancien~minéral connu~(4400)
  at:4100  mark:(line,white)  textcolor:black  text:Plus ancienne~roche connue~(4100)

  bar:era color:era

TextData =
  tabs:(25-left)

  pos:(40,360)
  text:"Suivi par :"
  text:[[Archéen]] (éon),
  text:[[Éoarchéen]] (ère)
| Template:Infobox Archéen | top next |

Initial version by Jd on Sunday, July 2, 2006
ImageSize  = width:175 height:360
PlotArea   = left:40 right:5 bottom:100 top:45
AlignBars  = justify

DateFormat = yyyy
Period      = from:2500 till:3800
TimeAxis    = orientation:vertical order:reverse
ScaleMajor  = unit:year increment:500 start:2500
ScaleMinor  = unit:year increment:100 start:2500

Colors =
  id:eon    value:rgb(1,0.7,1)  legend:Archéen_(éon)
  id:era    value:rgb(1,1,0.7)  legend:Archéen_(ère)
  id:black  value:black

Legend = left:15 top:40

BarData =
  bar:eon
  bar:era

PlotData=
  width:100 align:center textcolor:black mark:(line,black)

  bar:eon color:eon

  from:2500  till:3800 # text:[[Archéen]]~(2500–3800)

  bar:era color:era

  from:2500   till:2800  text:[[Néoarchéen]]~(2500–2800)
  from:2800   till:3200  text:[[Mésoarchéen]]~(2800–3200)
  from:3200   till:3600  text:[[Paléoarchéen]]~(3200–3600)
  from:3600   till:3800  text:[[Éoarchéen]]~(3600–3800)

TextData =
  tabs:(25-left)

  pos:(40,90)
  text:"Précédé par :"
  text:[[Hadéen]] (éon)

  pos:(40,360)
  text:"Suivie par :"
  text:[[Protérozoïque]] (éon),
  text:[[Paléoprotérozoïque]] (ère)
| Template:Infobox Éoarchéen | top next |
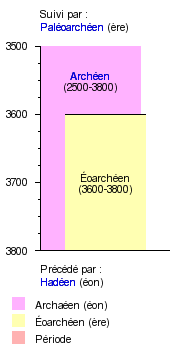
First version by Jd on Sunday, July 2, 2006, last update on Monday, July 3, 2006
ImageSize  = width:175 height:355
PlotArea   = left:40 right:5 bottom:105 top:45
AlignBars  = justify

DateFormat  = yyyy
Period      = from:3500 till:3800
TimeAxis    = orientation:vertical order:reverse
ScaleMajor  = unit:year increment:100 start:3500
ScaleMinor  = unit:year increment:25 start:3500

Colors =
  id:eon     value:rgb(1,0.7,1)    legend:Archaéen_(éon)
  id:era     value:rgb(1,1,0.7)    legend:Éoarchéen_(ère)
  id:period  value:rgb(1,0.7,0.7)  legend:Période
  id:black   value:black

Legend = left:15 top:60

BarData =
  bar:eon
  bar:era
  bar:period

PlotData=
  width:80 align:center textcolor:black mark:(line,black)

  bar:eon color:eon

  from:start  till:end  width:100  mark:none
  at:3550  mark:none  text:[[Archéen]]~(2500-3800)

  bar:era color:era

  from:3600  till:3800  text:Éoarchéen~(3600-3800)

  bar:period color:period

TextData =
  tabs:(25-left)

  pos:(40,95)
  text:"Précédé par :"
  text:[[Hadéen]] (éon)

  pos:(40,350)
  text:"Suivi par :"
  text:[[Paléoarchéen]] (ère)
| Template:Infobox Paléoarchéen | top next |

Initial version by Jd on Sunday, July 2, 2006
ImageSize  = width:175 height:355
PlotArea   = left:40 right:5 bottom:105 top:45
AlignBars  = justify

DateFormat  = yyyy
Period      = from:3100 till:3625
TimeAxis    = orientation:vertical order:reverse
ScaleMajor  = unit:year increment:100 start:3100
ScaleMinor  = unit:year increment:25 start:3100

Colors =
  id:eon     value:rgb(1,0.7,1)    legend:Archéen_(éon)
  id:era     value:rgb(1,1,0.7)    legend:Paléoarchéen_(ère)
  id:period  value:rgb(1,0.7,0.7)  legend:Période
  id:black   value:black

Legend = left:15 top:60

BarData =
  bar:eon
  bar:era
  bar:period

PlotData=
  width:80 align:center textcolor:black mark:(line,black)

  bar:eon color:eon

  from:start  till:end  width:100  mark:none
  at:3150  mark:none  text:[[Archéen]]~(2500-3800)

  bar:era color:era

  from:3200  till:3600  text:Paléoarchéen~(3200-3600)

  bar:period color:period

TextData =
  tabs:(25-left)

  pos:(40,95)
  text:"Précédé par :"
  text:[[Éoarchéen]] (ère)

  pos:(40,350)
  text:"Suivi par :"
  text:[[Mésoarchéen]] (ère)
| Template:Infobox Mésoarchéen | top next |

Initial version by Jd on Sunday, July 2, 2006
ImageSize  = width:175 height:355
PlotArea   = left:40 right:5 bottom:105 top:45
AlignBars  = justify

DateFormat  = yyyy
Period      = from:2700 till:3250
TimeAxis    = orientation:vertical order:reverse
ScaleMajor  = unit:year increment:100 start:2700
ScaleMinor  = unit:year increment:25 start:2700

Colors =
  id:eon     value:rgb(1,0.7,1)    legend:Archéen_(éon)
  id:era     value:rgb(1,1,0.7)    legend:Mésoarchéen_(ère)
  id:period  value:rgb(1,0.7,0.7)  legend:Période
  id:black   value:black

Legend = left:15 top:60

BarData =
  bar:eon
  bar:era
  bar:period

PlotData=
  width:80 align:center textcolor:black mark:(line,black)

  bar:eon color:eon

  from:start  till:end  width:100  mark:none
  at:2750  mark:none  text:[[Archaean]]~(2500-3800)

  bar:era color:era

  from:2800  till:3200  text:Mesoarchean~(2800-3200)

  bar:period color:period

TextData =
  tabs:(25-left)

  pos:(40,95)
  text:"Précédé par :"
  text:[[Paléoarchéen]] (ère)

  pos:(40,350)
  text:"Suivi par :"
  text:[[Néoarchéen]] (ère)
| Template:Infobox Néoarchéen | top next |
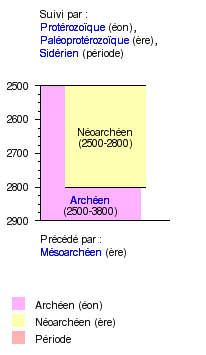
First version by Jd on Sunday, July 2, 2006, last update on Monday, July 3, 2006
ImageSize  = width:175 height:355
PlotArea   = left:40 right:5 bottom:135 top:85
AlignBars  = justify

DateFormat  = yyyy
Period      = from:2500 till:2900
TimeAxis    = orientation:vertical order:reverse
ScaleMajor  = unit:year increment:100 start:2500
ScaleMinor  = unit:year increment:25 start:2500

Colors =
  id:eon     value:rgb(1,0.7,1)    legend:Archéen_(éon)
  id:era     value:rgb(1,1,0.7)    legend:Néoarchéen_(ère)
  id:period  value:rgb(1,0.7,0.7)  legend:Période
  id:black   value:black

Legend = left:15 top:60

BarData =
  bar:eon
  bar:era
  bar:period

PlotData=
  width:80 align:center textcolor:black mark:(line,black)

  bar:eon color:eon

  from:start  till:end  width:100
  at:2850  mark:none  text:[[Archéen]]~(2500-3800)

  bar:era color:era

  from:2500  till:2800  text:Néoarchéen~(2500-2800)

  bar:period color:period

TextData =
  tabs:(25-left)

  pos:(40,125)
  text:"Précédé par :"
  text:[[Mésoarchéen]] (ère)

  pos:(40,350)
  text:"Suivi par :"
  text:[[Protérozoïque]] (éon),
  text:[[Paléoprotérozoïque]] (ère),
  text:[[Sidérien]] (période)
| Template:Infobox Précambrien | top next |

Initial version by Jd on Sunday, July 2, 2006
ImageSize  = width:175 height:255
PlotArea   = left:40 right:5 bottom:45 top:5
AlignBars  = early

DateFormat  = yyyy
Period      = from:0 till:4500
TimeAxis    = orientation:vertical order:reverse
ScaleMajor  = unit:year increment:500 start:0
ScaleMinor  = unit:year increment:100 start:0

Colors =
  id:epoch  value:rgb(0.7,0.7,1)
  id:period value:rgb(1,0.7,0.7)
  id:age    value:rgb(0.7,1,0.7)
  id:era    value:rgb(1,1,0.7)
  id:eon    value:rgb(1,0.7,1)  legend:Éon_du_Précambrien
  id:black  value:black

Legend = left:15 top:25

PlotData=
  width:120 align:center textcolor:black mark:(line,black)

  bar:eon color:eon

  from:542   till:2500   text:"[[Protérozoïque]]~(542-2500)"
  from:2500  till:3800   text:"[[Archéen]]~(2500-3800)"
  from:3800  till:end    text:"[[Hadéen]]~(3800-ca 4500)"

  at:100  mark:none  text:"[[Phanérozoïque]]~(depuis 542)"
| Template:Infobox Protérozoïque | top next |

Initial version by Jd on Monday, July 3, 2006
ImageSize  = width:175 height:355
PlotArea   = left:40 right:5 bottom:100 top:60
AlignBars  = justify

DateFormat  = yyyy
Period      = from:542 till:2500
TimeAxis    = orientation:vertical order:reverse
ScaleMajor  = unit:year increment:500 start:1000
ScaleMinor  = unit:year increment:100 start:600

Colors =
  id:eon    value:rgb(1,0.7,1)  legend:Protérozoïque_(éon)
  id:era    value:rgb(1,1,0.7)  legend:Ère_du_Protérozoïque
  id:black  value:black

Legend = left:15 top:40

BarData =
  bar:eon
  bar:era

PlotData=
  width:100 align:center textcolor:black mark:(line,black)

  bar:eon color:eon

  from:542  till:2500 # text:[[Protérozoïque]]~(542-2500)

  bar:era color:era

  from:542  till:1000  text:[[Néoprotérozoïque]]~(542-1000)
  from:1000  till:1600  text:[[Mésoprotérozoïque]]~(1000-1600)
  from:1600  till:2500  text:[[Paléoprotérozoïque]]~(1600-2500)

TextData =
  tabs:(25-left)

  pos:(40,90)
  text:"Précédé par :"
  text:[[Archéen]] (éon)
  text:[[Néoarchéen]] (ère)

  pos:(40,350)
  text:"Suivi par:"
  text:[[Phanérozoïque]] (éon)
  text:[[Paléozoïque]] (ère)
| Template:Infobox Sidérien | top next |
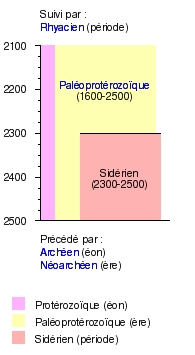
Initial version by Jd on Monday, July 3, 2006
ImageSize  = width:175 height:355
PlotArea   = left:40 right:5 bottom:135 top:45
AlignBars  = justify

DateFormat  = yyyy
Period      = from:2100 till:2500
TimeAxis    = orientation:vertical order:reverse
ScaleMajor  = unit:year increment:100 start:2300
ScaleMinor  = unit:year increment:25 start:2300

Colors =
  id:eon     value:rgb(1,0.7,1)    legend:Protérozoïque_(éon)
  id:era     value:rgb(1,1,0.7)    legend:Paléoprotérozoïque_(ère)
  id:period  value:rgb(1,0.7,0.7)  legend:Sidérien_(période)
  id:black   value:black

Legend = left:15 top:60

BarData =
  bar:eon
  bar:era
  bar:period

PlotData=
  width:80 align:center textcolor:black mark:(line,black)

  bar:eon color:eon

  from:2100  till:end  width:100  mark:none

  bar:era color:era

  from:2100  till:end  width:100  mark:none
  at:2200  mark:none  text:[[Paléoprotérozoïque]]~(1600-2500)

  bar:period color:period

  from:2300  till:2500  text:Sidérien~(2300-2500)

TextData =
  tabs:(25-left)

  pos:(40,125)
  text:"Précédé par :"
  text:[[Archéen]] (éon)
  text:[[Néoarchéen]] (ère)

  pos:(40,350)
  text:"Suivi par :"
  text:[[Rhyacien]] (période)
| Template:Infobox Paléoprotérozoïque | top next |
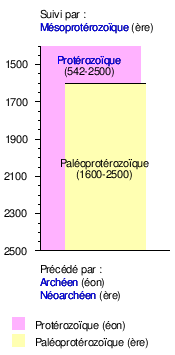
Initial version by Jd on Monday, July 3, 2006
ImageSize  = width:175 height:355
PlotArea   = left:40 right:5 bottom:105 top:45
AlignBars  = justify

DateFormat  = yyyy
Period      = from:1400 till:2500
TimeAxis    = orientation:vertical order:reverse
ScaleMajor  = unit:year increment:200 start:1500
ScaleMinor  = unit:year increment:50 start:1500

Colors =
  id:eon     value:rgb(1,0.7,1)    legend:Protérozoïque_(éon)
  id:era     value:rgb(1,1,0.7)    legend:Paléoprotérozoïque_(ère)
  id:black   value:black

Legend = left:15 top:40

BarData =
  bar:eon
  bar:era
  bar:period

PlotData=
  width:80 align:center textcolor:black mark:(line,black)

  bar:eon color:eon

  from:start  till:end  width:100  mark:none
  at:1500  mark:none  text:[[Protérozoïque]]~(542-2500)

  bar:era color:era

  from:1600  till:2500  text:Paléoprotérozoïque~(1600-2500)

TextData =
  tabs:(25-left)

  pos:(40,95)
  text:"Précédé par :"
  text:[[Archéen]] (éon)
  text:[[Néoarchéen]] (ère)

  pos:(40,350)
  text:"Suivi par :"
  text:[[Mésoprotérozoïque]] (ère)
| Template:Infobox Rhyacien | top next |

Initial version by Jd on Saturday, July 15, 2006
ImageSize  = width:175 height:355
PlotArea   = left:40 right:5 bottom:135 top:45
AlignBars  = justify

DateFormat  = yyyy
Period      = from:1850 till:2400
TimeAxis    = orientation:vertical order:reverse
ScaleMajor  = unit:year increment:100 start:2100
ScaleMinor  = unit:year increment:25 start:2100

Colors =
  id:eon     value:rgb(1,0.7,1)    legend:Protérozoïque_(éon)
  id:era     value:rgb(1,1,0.7)    legend:Paléoprotérozoïque_(ère)
  id:period  value:rgb(1,0.7,0.7)  legend:Rhyacien_(période)
  id:black   value:black

Legend = left:15 top:60

BarData =
  bar:eon
  bar:era
  bar:period

PlotData=
  width:80 align:center textcolor:black mark:(line,black)

  bar:eon color:eon

  from:1850  till:end  width:100  mark:none

  bar:era color:era

  from:1850  till:end  width:100  mark:none
  at:1950  mark:none  text:[[Paléoprotérozoïque]]~(1600-2500)

  bar:period color:period

  from:2050  till:2300  text:Rhyacien~(2050-2300)

TextData =
  tabs:(25-left)

  pos:(40,125)
  text:"Précédé par :"
  text:[[Sidérien]] (période)

  pos:(40,350)
  text:"Suivi par :"
  text:[[Orosirien]] (période)
| Template:Infobox Orosirien | top next |

Initial version by Jd on Saturday, July 15, 2006
ImageSize  = width:175 height:355
PlotArea   = left:40 right:5 bottom:135 top:45
AlignBars  = justify

DateFormat  = yyyy
Period      = from:1600 till:2150
TimeAxis    = orientation:vertical order:reverse
ScaleMajor  = unit:year increment:100 start:1600
ScaleMinor  = unit:year increment:25 start:1600

Colors =
  id:eon     value:rgb(1,0.7,1)    legend:Protérozoïque_(éon)
  id:era     value:rgb(1,1,0.7)    legend:Paléoprotérozoïque_(ère)
  id:period  value:rgb(1,0.7,0.7)  legend:Orosirien_(période)
  id:black   value:black

Legend = left:15 top:60

BarData =
  bar:eon
  bar:era
  bar:period

PlotData=
  width:80 align:center textcolor:black mark:(line,black)

  bar:eon color:eon

  from:1600  till:end  width:100  mark:none

  bar:era color:era

  from:1600  till:end  width:100  mark:(line,black)
  at:1700  mark:none  text:[[Paléoprotérozoïque]]~(1600-2500)

  bar:period color:period

  from:1800  till:2050  text:Orosirien~(1800-2050)

TextData =
  tabs:(25-left)

  pos:(40,125)
  text:"Précédé par :"
  text:[[Rhyacien]] (période)

  pos:(40,350)
  text:"Suivi par :"
  text:[[Stathérien]] (période)
| Template:Infobox Stathérien | top next |

Initial version by Jd on Saturday, July 15, 2006
ImageSize  = width:175 height:355
PlotArea   = left:40 right:5 bottom:135 top:55
AlignBars  = justify

DateFormat  = yyyy
Period      = from:1600 till:2000
TimeAxis    = orientation:vertical order:reverse
ScaleMajor  = unit:year increment:100 start:1600
ScaleMinor  = unit:year increment:25 start:1600

Colors =
  id:eon     value:rgb(1,0.7,1)    legend:Protérozoïque_(éon)
  id:era     value:rgb(1,1,0.7)    legend:Paléoprotérozoïque_(ère)
  id:period  value:rgb(1,0.7,0.7)  legend:Stathérien_(période)
  id:black   value:black

Legend = left:15 top:60

BarData =
  bar:eon
  bar:era
  bar:period

PlotData=
  width:80 align:center textcolor:black mark:none

  bar:eon color:eon

  from:1600  till:end  width:100  mark:none

  bar:era color:era

  from:1600  till:end  width:100  mark:(line,black)
  at:1900  mark:none  text:[[Paléoprotérozoïque]]~(1600-2500)

  bar:period color:period  mark:(line,black)

  from:1600  till:1800  text:Stathérien~(1600-1800)

TextData =
  tabs:(25-left)

  pos:(40,125)
  text:"Précédé par :"
  text:[[Orosirien]] (période)

  pos:(40,350)
  text:"Suivi par :"
  text:[[Mésoprotérozoïque]] (ère),
  text:[[Orosirien]] (période)
| Template:DominationAragonaiseSarde | top next |

Initial version by Yugiz on Monday, July 24, 2006
DateFormat = yyyy
ImageSize  = width:960 height:auto barincrement:15
PlotArea   = left:20 right:20 bottom:20 top:10
Colors     =
  id:blanc             value:rgb(1,1,1)
  id:noir              value:black
  id:canvas            value:gray(0.98)
  id:grilleMajor       value:gray(0.7)
  id:grilleMinor       value:gray(0.9)

  id:bleu              value:rgb(0.35,0.65,0.80)
  id:gris              value:rgb(0.75,0.75,0.75)

  id:cyan              value:rgb(0.5,0.80,0.80)
  id:cyanfonce         value:rgb(0.4,0.7,0.7)

  id:rougefonce        value:rgb(0.7,0.3,0.4)
  id:rouge             value:rgb(0.8,0.3,0.60)
  id:rougemoy          value:rgb(0.9,0.4,0.8)
  id:rougeclair        value:rgb(0.92,0.5,0.9)
  id:rougeclair2        value:rgb(0.92,0.7,0.9)

  id:orange            value:rgb(1,0.7,0.3)
  id:orangeclair       value:rgb(1,0.8,0.4)
  id:orange2            value:rgb(0.8,0.5,0.2)
  id:orangeclair2       value:rgb(0.8,0.6,0.3)

  id:vertfonce         value:rgb(0.20,0.60,0.40)
  id:vert              value:rgb(0.30,0.80,0.50)
  id:vertmoy           value:rgb(0.40,0.70,0.55)
  id:vertclair         value:rgb(0.60,0.80,0.80)
  id:bleuclair         value:rgb(0.65,0.65,0.90)


Period     = from:1297 till:1506
TimeAxis   = orientation:horizontal format:yyyy
AlignBars  = justify
ScaleMinor = unit:year increment:5 start:1300 gridcolor:grilleMinor
ScaleMajor = unit:year increment:50 start:1300 gridcolor:grilleMajor
BackgroundColors = canvas:canvas bars:canvas
BarData=
 bar:vide
 bar:evenement
   bar:espace3
 bar:domination
   bar:espace2
 bar:roi


Define $center = anchor:from align:center shift:( 0,10)
Define $center1 = anchor:from align:center shift:( 0,15)
Define $center2 = anchor:from align:center shift:( 0,5)
Define $center3 = anchor:from align:center shift:( 0,-20)
Define $center4 = anchor:from align:center shift:( 0,-30)
Define $left   = anchor:from align:left  shift:( 3,-10)
Define $left1   = anchor:from align:left  shift:( 1,11)
Define $right  = anchor:till align:right shift:(-4,-4)
Define $left2  = anchor:from align:left  shift:( 4, 5)
Define $right2 = anchor:till align:right shift:(-4, 13)
Define $left3  = anchor:from align:left  shift:( 3, 0)
Define $left4  = anchor:from align:left  shift:( 3, -10)
Define $left5  = anchor:from align:left  shift:( 3, -5)

PlotData=
# Roi
 bar:roi width:20
   from:1297 till:1327 color:vertfonce text:"Jacques le Juste" $left5
   at:1302 mark:(line, blanc)

   from:1327 till:1336 color:vert text:"Alphonse" $left3
   from:1327 till:1336 color:vert text:"le Bénin" $left4
   at:1329 mark:(line, blanc)

   from:1336 till:1387 color:vertmoy text:"          Pierre le Cérémonieux" $left5

   from:1387 till:1396 color:vertclair text:"Jean Ier" $left3


   from:1396 till:1410 color:bleuclair text:"   Martin Ier" $left4

   from:1412 till:1416 color:vert

   from:1416 till:1458 color:vertmoy text:"     Alphonse II le Magnanime" $left5
   from:1458 till:1479 color:vert text:"   Jean II d'Aragon" $left5
   from:1479 till:1506 color:vertfonce text:"Ferdinand II le Catholique" $left5

   at:1354 mark:(line, blanc)

   at:1383 mark:(line, blanc)

   at:1388 mark:(line, blanc)

   at:1409 mark:(line, blanc)

   at:1479 mark:(line, blanc)

# evenement
 bar:evenement  width:10
   at:1302 mark:(line, black) text:"[[Paix de Caltabellotta|Paix de]]" $center3
   at:1302 mark:(line, black) text:"[[Paix de Caltabellotta|Caltabellotta]]" $center4

   at:1324 mark:(line, black) text:"Prise du Château" $center1
   at:1324 mark:(line, black) text:"de Cagliari" $center2

   at:1329  text:"Rébellions" $center3
   at:1329  text:"de Sassari" $center4

   at:1354 mark:(line, black) text:"Prise d'Alghero" $center3

   at:1383 mark:(line, black) text:"Meurtre de" $center1
   at:1383 mark:(line, black) text:"Hugues III" $center2

   at:1388 mark:(line, black) text:"Pax" $center3
   at:1388 mark:(line, black) text:"Sardiniae" $center4

   at:1409 mark:(line, black) text:"Bataille de Sanluri" $center3

   at:1479 mark:(line, black) text:"Création de la couronne d’Espagne" $center3

# vide
 bar:vide  width:1


# espacements
 bar:espace2 width:10
 bar:espace3 width:10
| Template:Temps géologiques 2 | top next |

Initial version by Elapied ? on Monday, July 31, 2006
ImageSize  = width:800 height:100
PlotArea   = left:65 right:15 bottom:20 top:5
AlignBars  = justify
Colors =
  id:fond1     value:rgb(1,0.985,0.85)
  id:fond2     value:rgb(1,0.985,0.9)
  id:periode   value:rgb(1,0.9,0.5) # light orange
  id:neogene   value:rgb(1,0.855,0)
  id:paleogene value:rgb(0.992,0.604,0.278)
  id:cretace   value:rgb(0.773,0.898,0.322)
  id:jura      value:rgb(0.886,0.957,0.878)
  id:trias     value:rgb(0.420,0.04,0.490)
  id:permien   value:rgb(0.941,0.251,0.157)
  id:carbo     value:rgb(0.404,0.671,0.627)
  id:devonien  value:rgb(0.796,0.549,0.216)
  id:silurien  value:rgb(0.702,0.949,0.816)
  id:ordo      value:rgb(0,0.573,0.439)
  id:cambrien  value:rgb(0.251,0.522,0.129)
  id:era    value:rgb(1,1,0.8)   # light yellow
  id:ceno   value:rgb(0.980,0.992,0.08)
  id:meso   value:rgb(0.404,0.776,0.792)
  id:paleo  value:rgb(0.600,0.753,0.553)
  id:phanero value:rgb(0.664,0.852,0.898)
  id:protero value:rgb(0.984,0.605,0.582)
  id:archeen   value:rgb(0.941,0.018,0.500)
  id:hadeen value:rgb(0.816,0.254,0.254)
  id:black  value:black
  id:white  value:white

Period      = from:-4567.17 till:0
TimeAxis    = orientation:horizontal
ScaleMajor  = unit:year increment:500 start:-4500
ScaleMinor  = unit:year increment:100 start:-4400
BackgroundColors = canvas:fond1 bars:fond2
PlotData=
 align:center textcolor:black fontsize:8 mark:(line,black) width:25 shift:(0,-5)
 bar:éon color:phanero
  from:0     till:-542     text:[[Phanérozoïque]]
  from:-542   till:-2500   color:protero text:[[Protérozoïque|P R O T É R O Z O Ï Q U E]]
  from:-2500  till:-3800   color:archeen text:[[Archéen|A R C H É E N]]
  from:-3800  till:-4567.17 color:hadeen text:[[Hadéen|H A D É E N]]
 bar:ère color:era
  from:0     till:-65.5   color:ceno text:C
  from:-65.5  till:-251    color:meso text:[[Mésozoïque|Méso~zoïq]] shift:(0,1.8)
  from:-251   till:-542    color: paleo text:[[Paléozoïque|Paléo-~zoïque]] shift:(0,1.8)
  from:-542   till:-1000   text:[[Néoprotérozoïque|Néoproté-~rozoïque]] shift:(0,1.8)
  from:-1000  till:-1600   text:[[Mésoprotérozoïque|Mésoproté-~rozoïque]] shift:(0,1.8)
  from:-1600  till:-2500   text:[[Paléoprotérozoïque|Paléoprotérozoïque]]
  from:-2500  till:-2800   text:[[Néoarchéen|Néo-~archéen]] shift:(0,1.5)
  from:-2800  till:-3200   text:[[Mésoarchéen|Méso-~archéen]] shift:(0,1.5)
  from:-3200  till:-3600   text:[[Paléoarchéen|Paléo-~archéen]] shift:(0,1.5)
  from:-3600  till:-3800   text:[[Éoarchéen|Éoar-~chéen]] shift:(0,1.5)
  from:-3800  till:-4567.17
 bar:période color:periode
  from:0     till:-23.03 color:neogene
  from:-23.03 till:-65.5  color:paleogene
  from:-65.5  till:-145.5 color:cretace
  from:-145.5 till:-199.6 color:jura
  from:-199.6 till:-251   color:trias
  from:-251   till:-299   color:permien
  from:-299   till:-359.2 color:carbo
  from:-359.2 till:-416   color:devonien
  from:-416   till:-443.7 color:silurien
  from:-443.7 till:-488.3 color:ordo
  from:-488.3 till:-542   color:cambrien
  from:-542   till:-630   text:Éd
  from:-630   till:-850   text:[[Cryogénien|Cryog~énien]] shift:(0,0.5)
  from:-850   till:-1000  text:[[Tonien|Ton-~ien]] shift:(0,0.5)
  from:-1000  till:-1200  text:[[Sténien|Sté-~nien]] shift:(0,0.5)
  from:-1200  till:-1400  text:[[Ectasien|Ecta-~sien]] shift:(0,0.5)
  from:-1400  till:-1600  text:[[Calymnien|Caly-~mnien]] shift:(0,0.5)
  from:-1600  till:-1800  text:[[Stathérien|Stath~érien]] shift:(0,0.5)
  from:-1800  till:-2050  text:[[Orosirien|Orosi-~rien]] shift:(0,0.5)
  from:-2050  till:-2300  text:[[Rhyacien|Rhya-~cien]] shift:(0,0.5)
  from:-2300  till:-2500  text:[[Sidérien|Sidé-~rien]] shift:(0,0.5)
  from:-2500  till:-2800
  from:-2800  till:-3200
  from:-3200  till:-3600
  from:-3600  till:-3800
  from:-3800  till:-4567.17
| Template:Temps géologiques 2 | top next |

Initial version by Elapied ? on Monday, July 31, 2006
ImageSize  = width:800 height:100
PlotArea   = left:65 right:15 bottom:20 top:5
AlignBars  = justify
Colors =
  id:fond1     value:rgb(1,0.985,0.85)
  id:fond2     value:rgb(1,0.985,0.9)
  id:epoque  value:rgb(0.7,0.7,1) # light blue
  id:periode value:rgb(1,0.9,0.5) # light orange
  id:neogene value:rgb(1,0.855,0)
  id:paleogene value:rgb(0.992,0.604,0.322)
  id:cretace value:rgb(0.773,0.898,0.322)
  id:jura   value:rgb(0.886,0.957,0.878)
  id:trias  value:rgb(0.420,0.04,0.490)
  id:permien value:rgb(0.941,0.251,0.157)
  id:carbo  value:rgb(0.404,0.671,0.627)
  id:devonien  value:rgb(0.796,0.549,0.216)
  id:silurien  value:rgb(0.702,0.949,0.816)
  id:ordo      value:rgb(0,0.573,0.439)
  id:cambrien  value:rgb(0.251,0.522,0.129)
  id:era    value:rgb(1,1,0.8)   # light yellow
  id:eon    value:rgb(1,0.7,1)   # light purple
  id:ceno   value:rgb(0.980,0.992,0.08)
  id:meso   value:rgb(0.404,0.776,0.792)
  id:paleo  value:rgb(0.600,0.753,0.553)
  id:phanero value:rgb(0.664,0.852,0.898)
  id:filler value:gray(0.8)      # background bar
  id:black  value:black
  id:white  value:white

Period      = from:-542 till:0
TimeAxis    = orientation:horizontal
ScaleMajor  = unit:year increment:100 start:-500
ScaleMinor  = unit:year increment:10  start:-540
BackgroundColors = canvas:fond1 bars:fond2
PlotData=
  align:center textcolor:black fontsize:8 mark:(line,black) width:25 shift:(0,-5)
 bar:éon color:phanero
  from:0     till:-542      text:"[[Phanérozoïque|P H A N É R O Z O Ï Q U E]]"
  bar:ère color:era
  from:0     till:-65.5     color:ceno text:[[Cénozoïque]]
  from:-65.5  till:-251      color:meso text:[[Mésozoïque]]
  from:-251   till:-542      color:paleo text:[[Paléozoïque]]
 bar:période color:periode fontsize:8
  from:0     till:-23.03    color:neogene text:[[Néogène|Néo-~gène]] shift:(0,1)
  from:-23.03 till:-65.5     color:paleogene text:[[Paléogène]]
  from:-65.5  till:-145.5    color:cretace text:[[Crétacé]]
  from:-145.5 till:-199.6    color:jura text:[[Jurassique]]
  from:-199.6 till:-251      color:trias textcolor:white shift:(-3,-5) text:[[Trias| ]]Trias
  from:-251   till:-299      color:permien text:[[Permien]]
  from:-299   till:-359.2    color:carbo text:[[Carbonifère]]
  from:-359.2 till:-416      color:devonien text:[[Dévonien]]
  from:-416   till:-443.7    color:silurien text:[[Silurien|Silu-~rien]] shift:(0,1)
  from:-443.7 till:-488.3    color:ordo text:[[Ordovicien]] shift:(2,-5)
  from:-488.3 till:-542      color:cambrien textcolor:white shift:(-3,-5) text:[[Cambrien| ]]Cambrien
| Template:Temps géologiques 2 | top next |

Initial version by Elapied ? on Monday, July 31, 2006
ImageSize = width:800 height:100
PlotArea  = left:65 right:15 bottom:20 top:5
AlignBars = justify
Colors =
  id:fond1     value:rgb(1,0.985,0.85)
  id:fond2     value:rgb(1,0.985,0.9)
  id:epoque  value:rgb(0.7,0.8,1) # light blue
  id:pleisto value:rgb(1,0.968,0.690)
  id:pliocene value:rgb(1,1,0.6)
  id:miocene value:rgb(1,1,0)
  id:oligo   value:rgb(0.992,0.816,0.565)
  id:eocene  value:rgb(0.945,0.820,0.239)
  id:paleocene value:rgb(0.922,0.753,0.427)
  id:systeme value:rgb(1,0.9,0.5) # light orange
  id:neogene value:rgb(1,0.855,0)
  id:paleogene value:rgb(0.992,0.604,0.322)
  id:era    value:rgb(1,1,0.8)   # light yellow
  id:ceno   value:rgb(0.980,0.992,0.08)
  id:black  value:black

Period     = from:-65.5 till:0
TimeAxis   = orientation:horizontal
ScaleMajor = unit:year increment:10 start:-60
ScaleMinor = unit:year increment:1  start:-65
BackgroundColors = canvas:fond1 bars:fond2
PlotData=
  align:center textcolor:black fontsize:8 mark:(line,black) width:25 shift:(0,-5)

 bar:ère     color:era
  from:0     till:-65.5   color:ceno text:"[[Cénozoïque|C É N O Z O Ï Q U E]]"

 bar:période color:neogene
  from:0     till:-23.03  text:[[Néogène]]
  from:-23.03 till:-65.5   color:paleogene text:[[Paléogène]]

 bar:époque color:epoque
  from:0     till:-0.1     # 0.1 au lieu de 0.01 pour trait qui traduit que le pleistocene ne va pas jusqu'à 0
  from:-0.01  till:-1.806  color:pleisto text:[[Pléistocène|Plé]] fontsize:7
  from:-1.806 till:-5.332  color:pliocene text:[[Pliocène|Plio-~cène]] shift:(0,1)
  from:-5.332 till:-23.03  color:miocene text:[[Miocène]]
  from:-23.03 till:-33.9   color:oligo text:[[Oligocène]]
  from:-33.9  till:-55.8   color:eocene text:[[Éocène]]
  from:-55.8  till:-65.5   color:paleocene text:[[Paléocène]]
| Generated on Saturday, August 12, 2006 from SQL dump files of Monday, July 31, 2006 | |
| Note: only timelines on article and template pages are shown. Timelines on discussion pages, user pages, etc are ignored. | Top |