
Graphical Timelines on Dutch WikipediaSo far 35860 timelines have been created on this Wikipedia. Last timeline added on Monday, July 31, 200635751 very basic, repetitive or bot created timelines not shown here. |
Monday, July 31, 2006index |
Feel feel to ask Erik Zachte, the author of EasyTimeline, for help or advice at his Wikipedia user page
See also Introduction to EasyTimeline / Syntax
| Albert Einstein | next |
First version by Londenp on Monday, January 17, 2005, last update on Sunday, July 2, 2006
ImageSize  = width:830 height:370
PlotArea   = width:780 height:340 left:10 bottom:25

Colors     =
  id:canvas value:rgb(0.97,0.97,0.97)
  id:grid1  value:rgb(0.86,0.86,0.86)
  id:grey   value:gray(0.8)
  id:ch1    value:rgb(0.6,0.6,1)
  id:ch2    value:rgb(0.6,0.6,0.5)

BackgroundColors = canvas:canvas bars:canvas

Period     = from:1875 till:1970
TimeAxis   = orientation:horizontal format:yyyy
ScaleMajor = unit:year increment:5 start:1880 gridcolor:grid1
DateFormat = yyyy
AlignBars  = justify

BarData =
# set presentation order of bars
# text:_ means show no text on axis (I'll make this default behaviour in next version of EasyTimeline)
  bar:ereignisse text:_
  bar:e1         text:_  # only used to provide extra space
  bar:1          text:_
  bar:2          text:_
  bar:3          text:_
  bar:4          text:_
  bar:5          text:_
  bar:6          text:_
  bar:7          text:_
  bar:8          text:_
  bar:9          text:_
  bar:10         text:_
  bar:11         text:_

PlotData=

# set defaults
  width:25 fontsize:S textcolor:black anchor:from align:left shift:(0,-25)

# draw the background bar and bar descriptions
  bar:ereignisse from:start till:end color:grey

# events
  bar:ereignisse from:1879 till:1901 color:black text:"Opgroeien en opleiding"
  bar:ereignisse from:1905 till:1916 color:ch1   text:"Periode van zijn belangrijkste werken"
  bar:ereignisse from:1932 till:1955 color:ch2   text:"In de VS. Zijn speurtocht naar een algemene veldtheorie"

# change defaults
  fontsize:S shift:(-2,18) align:left
  shift:(0,-8)  # shift all texts 11 pixels to left to center year figures on actual event time
                   # and 12 pixels down to put them below bar

# events, placed on consecutive (invisible) bars
  bar:1  at:1879 text:"1879 Albert Einstein wordt geboren in Ulm (DE)"
  bar:2  at:1888 text:"1888 Luitpoldgymnasium in München"
  bar:3  at:1895 text:"1895 Kantonsschool in Aarau (CH)"
  bar:4  at:1900 text:"1900 Afsluiting van studie wis- en natuurkunde aan de ETH in Zürich"
  bar:5  at:1901 text:"1901 Eerste werk in ''Annalen der Physik''"
  bar:6  at:1905 text:"1905 De speciale relativiteitstheorie" en vijf andere werken
  bar:7  at:1916 text:"1915 De algemene relativiteitstheorie"
  bar:8  at:1921 text:"1921 Nobelprijs voor het foto-elektrisch effect"
  bar:9  at:1939 text:"1939 Waarschuwing aan Roosevelt over Duitse atoombom"
  bar:10 at:1951 text:"1951 foto met uitgestoken tong"
  bar:11 at:1955 text:"1955 Einstein sterft"
| Grunge | top next |

First version by SanderSpek on Tuesday, August 24, 2004, last update on Monday, March 20, 2006
TimeAxis = orientation:horizontal format:yyyy
ImageSize = width:800 height:auto barincrement:26
PlotArea = left:18 right:18 top:10 bottom:25

Colors =
  id:canvas value:rgb(0.97,0.97,0.97)
  id:grid1  value:rgb(0.86,0.86,0.86)
  id:grid2  value:gray(0.8)
  id:gray   value:gray(0.8)
  id:bars   value:rgb(0.96,0.96,0.6)
  id:group  value:gray(0.5)

BackgroundColors = canvas:canvas

Period     = from:1978 till:2005
ScaleMajor = unit:year increment:5 start:1980 gridcolor:grid2
ScaleMinor = unit:year increment:1 start:1978 gridcolor:grid1

BarData=
  barset:Voorlopers # text:"Voorlopers"
  barset:Grunge     # text:"Grunge-bands"
  barset:Beinvloed  # text:"Bands beïnvloed door grunge"

PlotData=

# set defaults
  width:22 fontsize:L textcolor:black align:left anchor:from shift:(10,-6)

  barset:Voorlopers color:black textcolor:white

  from:start till:end  text:"Voorlopers" color:group textcolor:white
  from:1979  till:1989 text:"Hüsker Dü"
  from:1981  till:end text:"Sonic Youth"
  from:1983  till:end text:"Dinosaur Jr."
  from:1986  till:1993 text:"Pixies"
  barset:break
  barset:skip
  barset:skip
  barset:skip
  barset:skip
  from:2004 till:end  text:"P'"
  barset:Grunge color:bars textcolor:black

  from:start till:end  text:"Grunge-bands" color:group textcolor:white
  from:1983 till:1988 text:"Green River"
  from:1984 till:1997 text:"Soundgarden"
  from:1987 till:1994 text:"Nirvana"
  from:1987 till:2002 text:"Alice In Chains"
  from:1988 till:end text:"Mudhoney"
  from:1990 till:end text:"Pearl Jam"
  from:1992 till:2003 text:"Stone Temple Pilots"
  from:1995 till:1996 text:"Mad Season"

  barset:Beinvloed color:gray textcolor:black

  from:start till:end  text:"Bands beïnvloed door grunge" color:group textcolor:white
  from:1990 till:1998 text:"Presidents of the U.S.A."
  from:1992 till:end text:"Bush"
  from:1992 till:end text:"Silverchair"
  from:1994 till:2004 text:"Creed"
  from:1995 till:end text:"Foo Fighters"
  from:1998 till:end text:"Kane"
  from:2001 till:end text:"Audioslave"
  from:1995 till:end text:"Muse"
  from:1988 till:end text:"Radiohead"
| Nederland | top next |

First version by Michiel1972 on Tuesday, March 8, 2005, last update on Friday, March 31, 2006
ImageSize  = width:750 height:220
PlotArea   = left:0 right:40 top:30 bottom:30
TimeAxis   = orientation:horizontal
DateFormat = yyyy

Period     = from:1450 till:2015
AlignBars  = early
ScaleMajor = unit:year increment:50 start:1475

Colors =
    id:Habsburg value:rgb(1,0.7,0.7) # light red
    id:Lage_landen value:rgb(1,0.7,0.7) # light red
    id:Koninkrijk_Holland value:rgb(1,0.7,0.7) # light red
    id:Ver_Koninkrijk value:rgb(1,0.7,0.7) # light red
    id:Nederland value:rgb(1,0.7,0.7) # light red
    id:België value:rgb(1,0.7,0.7) # light red
    id:Luxemburg value:rgb(1,0.7,0.7) # light red

Define $dx=-3

PlotData =

  bar:Habsburg width:20 color:red shift:($dx,-20)
  from:1477 till:1555  color:yellow
  at:1475 text:" [[Habsburgse Nederlanden|Habsburgse Ned.]]" shift:($dx,-5)

  bar:Lage_landen width:20 color:red shift:($dx,-20)
  from:1579 till:1795  color:orange
  from:1795 till:1806  color:redorange
  at:1580 text:" [[Republiek der Zeven Verenigde Nederlanden]]" shift:($dx,-5)
  at:1795 text:" [[Bataafse Republiek]]" shift:($dx,-5)

  bar:Koninkrijk_Holland width:20 color:red shift:($dx,-20)
  from:1806 till:1810  color:red
  at:1806 text:" [[Koninkrijk Holland]]" shift:($dx,-5)

  bar:Ver_Koninkrijk width:20 color:red shift:($dx,-20)
  from:1813 till:1830  color:redorange
  at:1815 text:" [[Verenigd Koninkrijk der Nederlanden|Ver. Kon. der Nederlanden ]]" shift:($dx,-5)

  bar:Nederland width:20 color:red shift:($dx,-20)
  from:1830 till:2005  color:green
  at:1850 text:" [[Koninkrijk der Nederlanden]]" shift:($dx,-5)

  bar:België width:20 color:red shift:($dx,-20)
  from:1830 till:2005  color:drabgreen
  at:1840 text:" [[België]]" shift:($dx,-5)

  bar:Luxemburg width:20 color:red shift:($dx,-20)
  from:1890 till:2005  color:powderblue2
  at:1900 text:" [[Groothertogdom Luxemburg|Gr. Luxemburg]]" shift:($dx,-5)
| Ronde van Frankrijk 2002 | top next |

Initial version by Friesland 1 on Wednesday, July 13, 2005
ImageSize  = width:480 height:600
PlotArea   = left:25 right:0 bottom:20 top:10
DateFormat = yyyy
Period     = from:0 till:20
TimeAxis   = orientation:vertical order:reverse
ScaleMajor = gridcolor:white unit:year increment:1 start:0

Colors =
  id:alggeel    value:rgb(1,1,0.4)
  id:bergrood   value:rgb(1,0.5,0.5)
  id:puntgroen  value:rgb(0.7,1,0.5)
  id:lichtgrijs value:rgb(0.95,0.95,0.95)

PlotData=

  bar:Algemeen color:alggeel width:110 mark:(line,black) align:center fontsize:S shift:(0,2)
  # shift texts up or down manually to avoid overlap
  from:0  till:1  text:[[Lance Armstrong]]
  from:1  till:3  text:[[Rubens Bertogliati]]
  from:3  till:4  text:[[Erik Zabel]]
  from:4  till:10  text:[[Igor González de Galdeano|Igor Gonzalez~de Galdeano]]
  from:10  till:20 text:[[Lance Armstrong]]

  bar:Puntenklassement color:puntgroen
  # shift texts up or down manually to avoid overlap
  from:0  till:1  text:[[Lance Armstrong]]
  from:1  till:10  text:[[Erik Zabel]]
  from:10  till:11  text:[[Robbie McEwen]]
  from:11  till:12  text:[[Erik Zabel]]
  from:12  till:20 text:[[Robbie McEwen]]

  bar:Bergklassement color:bergrood
  # shift texts up or down manually to avoid overlap
  from:0  till:1  text:Nog geen~klassement
  from:1  till:2 text:[[Christophe Mengin]]
  from:2  till:3 text:[[Stéphane Berges]]
  from:3  till:11 text:[[Christophe Mengin]]
  from:11  till:12 text:[[Patrice Halgand]]
  from:12 till:20 text:[[Laurent Jalabert]]

  bar:Jongerenklassement color:lichtgrijs
  # shift texts up or down manually to avoid overlap
  from:0  till:1  text:[[David Millar]]
  from:1  till:4  text:[[Rubens Bertogliati]]
  from:4  till:9 text:[[Isidro Nozal]]
  from:9 till:11 text:[[David Millar]]
  from:11 till:20 text:[[Ivan Basso]]
| Volksrepubliek China | top next |

Initial version by 62.131.54.184 on Friday, March 4, 2005
ImageSize  = width:700 height:100
PlotArea   = left:40 right:30 top:30 bottom:30
TimeAxis   = orientation:horizontal
DateFormat = yyyy
Period     = from:1811 till:2000
AlignBars  = early
ScaleMajor = unit:year increment:20 start:1850
Colors =
  id:gray value:gray(0.7)

Define $dx=-3

PlotData =
  bar:events width:25 color:red shift:($dx,-20)

  from:1811 till:1911  color:yellow
  from:1911 till:1928  color:green
  from:1928 till:1949 color:white
  from:1949 till:2000 color:red

  at:1820 text:" Laatste eeuw [[Chinese keizerrijk]]" shift:($dx,-5)
  at: 1908 text:" [[Republiek China (1911-1928)|Rep. China]]" shift:($dx,-5)
  at: 1930 text:" [[Kwomintang China|Kwomintang]]" shift:($dx,-5)
  at: 1955 text:" [[Volksrepubliek China]]"  shift:($dx,-5)
| Slovenië | top next |

First version by Besednjak ? on Monday, April 24, 2006, last update on Thursday, July 6, 2006
ImageSize  = width:650 height:260
PlotArea   = width:550 height:230 left:50 bottom:20
AlignBars  = justify

DateFormat = yyyy
Period     = from:800 till:1600
TimeAxis   = orientation:vertical
ScaleMajor = unit:year increment:100 start:800

PlotData=
  bar:inwoners color:yelloworange width:20   mark:(line,white) align:left fontsize:S
  bar:1857 from:start till:869
  bar:1869 from:start till:890
  bar:1880 from:start till:932
  bar:1890 from:start till:973
  bar:1900 from:start till:1000
  bar:1910 from:start till:1042
  bar:1921 from:Start till:1029
  bar:1931 from:start till:1102
  bar:1948 from:start till:1135
  bar:1953 from:start till:1186
  bar:1961 from:start till:1255
  bar:1971 from:start till:1362
  bar:1981 from:start till:1492
  bar:1991 from:start till:1509
  bar:2002 from:start till:1549
  bar:2005 from:start till:1578
| Slovenië | top next |

First version by Besednjak ? on Monday, April 24, 2006, last update on Thursday, July 6, 2006
ImageSize  = width:350 height:180
PlotArea   = width:250 height:120 left:20 bottom:30
AlignBars  = justify

DateFormat = yyyy
Period     = from:0 till:1000
TimeAxis   = orientation:vertical
ScaleMajor = unit:year increment:100 start:0
Colors =
  id:canvas  value:orange
  id:RKK   value:kelleygreen     legend:rooms-Katholiek
  id:Nietc value:yellow          legend:niet-confessioneel
  id:Ov    value:orange          legend:overigen
PlotData=
  bar:Percentage color:canvas width:30   mark:(line,white) align:left fontsize:S
  color:RKK bar:1921 from:start till:966
  color:Ov bar:1921 from:966 till:1000
  color:RKK bar:1953 from:start till:828
  color:Nietc bar:1953 from:828 till:971
  color:Ov bar:1953 from:971 till:1000
  color:RKK bar:1991 from:start till:716
  color:Nietc bar:1991 from:716 till:950
  color:Ov bar:1991 from:950 till:1000
  color:RKK bar:2002 from:start till:578
  color:Nietc bar:2002 from:578 till:908
  color:Ov bar:2002 from:908 till:1000

Legend = columns:3 left:15 top:18 columnwidth:115
| Monarchie | top next |

First version by Känsterle on Friday, September 9, 2005, last update on Thursday, May 11, 2006
ImageSize  = width:850 height:650
PlotArea   = left:100 right:30 bottom:20 top:5
AlignBars  = late

Colors =
  id:geel  value:rgb(0.7,0.7,1) # light yellow
  id:rood value:rgb(1,0.7,0.7) # light red
  id:groen    value:rgb(0.7,1,0.7) # light green
  id:blauw    value:rgb(1,1,0.7)   # light blue
  id:paars    value:rgb(1,0.7,1)   # light purple
  id:zwart  value:black

Period      = from:1900 till:2000
TimeAxis    = orientation:horizontal
ScaleMajor  = unit:year increment:5 start:1900
ScaleMinor  = unit:year increment:1 start:1900

Define $markred = text:"*" textcolor:red shift:(0,3) fontsize:10

PlotData=
  align:center textcolor:black fontsize:8 mark:(line,black) width:25 shift:(0,-5)

  bar:Albanië color:geel

  from: 1939   till: 1943   text:[[Victor Emanuel III van Italië|Vic. Em. III]]
  from: 1928   till: 1939   text:[[Zog van Albanië|Zog]]
  from: 1914   till: 1914   text:[[Wilhelm zu Wied]]

  bar:België color:rood

  from: 1993   till: 2000   text:[[Albert II van België|Albert II]]
  from: 1951   till: 1993   text:[[Boudewijn van België|Boudewijn]]
  from: 1934   till: 1951   text:[[Leopold III van België|Leopold III]]
  from: 1909   till: 1934   text:[[Albert I van België|Albert I]]
  from: 1900   till: 1909   text:[[Leopold II van België|Leopold II]]

  bar:Bulgarije color:groen

  from: 1943   till: 1946   text:[[Simeon II van Bulgarije|Simeon II]]
  from: 1918   till: 1943   text:[[Boris III van Bulgarije|Boris III]]
  from: 1900   till: 1918   text:[[Ferdinand van Bulgarije|Ferdinand]]

  bar:Denemarken color:blauw

  from: 1972   till: 2000   text:[[Margaretha II van Denemarken|Margaretha II]]
  from: 1947   till: 1972   text:[[Frederik IX van Denemarken|Frederik IX]]
  from: 1912   till: 1947   text:[[Christiaan X van Denemarken|Christiaan X]]
  from: 1906   till: 1912   text:[[Frederik VIII van Denemarken|Fr. VIII]]
  from: 1900   till: 1906   text:[[Christiaan IX van Denemarken|C. IX]]

  bar:Duitsland color:paars

  from: 1900   till: 1918   text:[[Wilhelm II van het Duitse Rijk|Wilhelm II]]

  bar:Griekenland color:geel

  from: 1964   till: 1973   text:[[Konstantijn II van Griekenland|Konstantijn II]]
  from: 1947   till: 1964   text:[[Paul van Griekenland|Paul]]
  from: 1935   till: 1947   text:[[George II van Griekenland|George II]]
  from: 1922   till: 1924   text:[[George II van Griekenland|G. II]]
  from: 1920   till: 1922   text:
  from: 1917   till: 1920   text:[[Alexander van Griekenland|Alex.]]
  from: 1913   till: 1917   text:
  from: 1900   till: 1913   text:[[George I van Griekenland|George I]]

  bar:_   color:geel
  from: 1964   till: 1973   text:
  from: 1947   till: 1964   text:
  from: 1935   till: 1947   text:
  from: 1922   till: 1924   text:
  from: 1920   till: 1922   text:[[Konstantijn I van Griekenland|Kon. I]]
  from: 1917   till: 1920   text:
  from: 1913   till: 1917   text:[[Konstantijn I van Griekenland|Kon. I]]
  from: 1900   till: 1913   text:

  bar:Italië color:rood

  from: 1946   till: 1946   text:[[Umberto II van Italië|Umberto II]]
  from: 1900   till: 1946   text:[[Victor Emanuel III van Italië|Victor Emanuel III]]
  from: 1900   till: 1900   text:[[Umberto I van Italië|U. I]]

  bar:Joegoslavië color:groen
  from: 1934   till: 1945   text:[[Peter II van Joegoslavië|Peter II]]
  from: 1921   till: 1934   text:[[Alexander I van Joegoslavië|Alexander]]
  from: 1918   till: 1921   text:[[Peter I van Joegoslavië|Peter I]]

  bar:Kroatië color:blauw

  from: 1941   till: 1943   text:[[Tomislav II van Kroatië|Tomislav II]]

  bar:Liechtenstein color:paars

  from: 1989   till: 2000   text:[[Hans-Adam II van Liechtenstein|Hans-Adam II]]
  from: 1938   till: 1989   text:[[Frans Jozef II van Liechtenstein|Frans Jozef II]]
  from: 1929   till: 1938   text:[[Frans I van Liechtenstein|Frans I]]
  from: 1900   till: 1929   text:[[Johannes II van Liechtenstein|Johannes II]]

  bar:Litouwen color:geel

  from:1918    till: 1918   text:[[Mindaugas II van Litouwen|Mindaugas II]]

  bar:Luxemburg color:geel

  from: 2000   till: 2000   text:[[Hendrik van Luxemburg|Hendrik]]
  from: 1964   till: 2000   text:[[Jan van Luxemburg|Jan]]
  from: 1919   till: 1964   text:[[Charlotte van Luxemburg|Charlotte]]
  from: 1912   till: 1919   text:[[Maria Adelheid van Luxemburg|Maria A.]]
  from: 1905   till: 1912   text:[[Willem IV van Luxemburg|Wil. IV]]
  from: 1900   till: 1905   text:[[Adolf van Luxemburg|Adolf]]

  bar:Monaco color:rood

  from: 1949   till: 2000   text:[[Rainier III van Monaco|Rainier III]]
  from: 1922   till: 1949   text:[[Lodewijk II van Monaco|Lodewijk II]]
  from: 1900   till: 1922   text:[[Albert I van Monaco|Albert I]]

  bar:Montenegro color:groen

  from: 1900   till: 1918   text:[[Nicolaas I van Montenegro|Nicolaas]]

  bar:Nederland color:blauw

  from: 1980   till: 2000  text:[[Beatrix van Nederland|Beatrix]]
  from: 1948   till: 1980   text:[[Juliana van Nederland|Juliana]]
  from: 1900   till: 1948   text:[[Wilhelmina van Nederland|Wilhelmina]]

  bar:Noorwegen color:paars

  from: 1991   till: 2000  text:[[Harald V van Noorwegen|Harald V]]
  from: 1957   till: 1991   text:[[Olaf V van Noorwegen|Olaf V]]
  from: 1905   till: 1957   text:[[Haakon VII van Noorwegen|Haakon VII]]
  from: 1900   till: 1905   text:[[Oscar II van Zweden|Oscar II]]

  bar:Oostenrijk color:geel

  from: 1916   till: 1918  text:[[Karel I van Oostenrijk|Karel I]]
  from: 1900   till: 1916   text:[[Frans Jozef I van Oostenrijk|Frans Jozef I]]

  bar:Portugal color:rood

  from: 1908   till: 1910  text:[[Emanuel II van Portugal|Em. II]]
  from: 1900   till: 1908   text:[[Karel van Portugal|Karel]]

  bar:Roemenië color:groen

  from: 1940   till: 1947   text:[[Michael van Roemenië|Michael]]
  from: 1930   till: 1940   text:[[Carol II van Roemenië|Carol II]]
  from: 1927   till: 1930   text:[[Michael van Roemenië|Michael]]
  from: 1914   till: 1927   text:[[Ferdinand van Roemenië|Ferdinand]]
  from: 1900   till: 1914   text:[[Carol I van Roemenië|Carol I]]

  bar:Rusland color:blauw

  from: 1900   till: 1917  text:[[Nicolaas II van Rusland|Nicolaas II]]

  bar:Servië color:paars

  from: 1903   till: 1918  text:[[Peter I van Joegoslavië|Peter]]
  from: 1900   till: 1903   text:[[Alexander Obrenovic|Alex.]]

  bar:Spanje color:geel

  from: 1975   till: 2000  text:[[Juan Carlos van Spanje|Juan Carlos]]
  from: 1900   till: 1931   text:[[Alfons XIII van Spanje|Alfons XIII]]

  bar:VK color:rood

  from: 1952   till: 2000   text:[[Elizabeth II van het Verenigd Koninkrijk|Elizabeth II]]
  from: 1936   till: 1952   text:[[George VI van het Verenigd Koninkrijk|George VI]]
  from: 1936   till: 1936   text:[[Edward VIII van het Verenigd Koninkrijk|Ed. VIII]]
  from: 1910   till: 1936   text:[[George V van het Verenigd Koninkrijk|George V]]
  from: 1901   till: 1910   text:[[Edward VII van het Verenigd Koninkrijk|Ed. VII]]
  from: 1900   till: 1901   text:[[Victoria van het Verenigd Koninkrijk|Vic.]]

  bar:Zweden color:groen

  from: 1973   till: 2000   text:[[Karel XVI Gustaaf van Zweden|Karel XVI Gustaaf]]
  from: 1950   till: 1973   text:[[Gustaaf VI Adolf van Zweden|Gustaaf VI Adolf]]
  from: 1907   till: 1950   text:[[Gustaaf V van Zweden|Gustaaf V]]
  from: 1900   till: 1907   text:[[Oscar II van Zweden|Oscar II]]
| Britpop | top next |

First version by SanderSpek on Tuesday, August 24, 2004, last update on Monday, June 26, 2006
TimeAxis = orientation:horizontal format:yyyy
ImageSize = width:850 height:400
PlotArea = width:800 height:300 bottom:20 left:20

Colors =
  id:canvas value:rgb(0.97,0.97,0.97)
  id:grid1  value:rgb(0.86,0.86,0.86)
  id:grid2  value:gray(0.8)
  id:bars   value:rgb(0.96,0.96,0.6)

BackgroundColors = canvas:canvas

Period     = from:1978 till:2005
ScaleMajor = unit:year increment:1 start:1978 gridcolor:grid1

BarData=
  barset:Bands

LineData =
  at:1989 color:grid2 layer:back
  at:1994 color:grid2 layer:back

PlotData=

# set defaults
  width:25 fontsize:L textcolor:black align:left anchor:from shift:(10,-4) color:bars

  barset:Bands

  from:1978 till:2004 text:"Pulp"
  from:1985 till:1996 text:"The Stone Roses"
    at:1989 text:"1989: Debuutalbum The Stone Roses"
  from:1989 till:1999 text:"The Verve"
  from:1989 till:2004 text:"Blur"
  from:1989 till:2004 text:"Suede"
  from:1989 till:2004 text:"Radiohead"
  from:1990 till:2004 text:"Travis"
  from:1991 till:2004 text:"Manic Street Preachers"
  from:1993 till:2004 text:"Oasis"
  from:1993 till:2004 text:"Supergrass"
  at:1994 text:"1994: Hoogtepunt rivaliteit Blur en Oasis"
  from:1995 till:1999 text:"Kula Shaker"
| Ronde van Frankrijk 2003 | top next |

First version by Friesland 1 on Tuesday, July 12, 2005, last update on Friday, May 5, 2006
ImageSize  = width:600 height:600
PlotArea   = left:25 right:0 bottom:20 top:10
DateFormat = yyyy
Period     = from:0 till:20
TimeAxis   = orientation:vertical order:reverse
ScaleMajor = gridcolor:white unit:year increment:1 start:0

Colors =
  id:alggeel    value:rgb(1,1,0.4)
  id:bergrood   value:rgb(1,0.5,0.5)
  id:puntgroen  value:rgb(0.7,1,0.5)
  id:lichtgrijs value:rgb(0.95,0.95,0.95)
  id:lichtpaars value:rgb(0.85,0.9,1)

PlotData=

  bar:Algemeen color:alggeel width:110 mark:(line,black) align:center fontsize:S shift:(0,2)
  # shift texts up or down manually to avoid overlap
  from:0  till:3  text:[[Bradley McGee]]
  from:3  till:4  text:[[Jean-Patrick Nazon]]
  from:4  till:7  text:[[Victor Hugo Peña]]
  from:7  till:8  text:[[Richard Virenque]]
  from:8  till:20 text:[[Lance Armstrong]]

  bar:Puntenklassement color:puntgroen
  # shift texts up or down manually to avoid overlap
  from:0  till:1  text:[[Bradley McGee]]
  from:1  till:6  text:[[Robbie McEwen]]
  from:6  till:7  text:[[Alessandro Petacchi]]
  from:7  till:18  text:[[Baden Cooke]]
  from:18  till:19 text:[[Robbie McEwen]]
  from:19  till:20  text:[[Baden Cooke]]

  bar:Bergklassement color:bergrood
  # shift texts up or down manually to avoid overlap
  from:0  till:1  text:Nog geen~klassement
  from:1  till:5 text:[[Christophe Mengin]]
  from:5  till:6 text:[[Frédéric Finot]]
  from:6  till:7 text:[[Christophe Mengin]]
  from:7  till:20 text:[[Richard Virenque]]

  bar:Jongerenklassement color:lichtgrijs
  # shift texts up or down manually to avoid overlap
  from:0  till:1  text:[[Vladimir Karpets]]
  from:1  till:2  text:[[Andy Flickinger]]
  from:2  till:4  text:[[Baden Cooke]]
  from:4  till:7  text:[[Vladimir Karpets]]
  from:7  till:20 text:[[Denis Mensjov]]


  bar:Ploegenklassement color:lichtpaars
  # shift texts up or down manually to avoid overlap
  from:0  till:20  text:w.i.u
| Duitse Democratische Republiek | top next |

First version by SanderSpek on Tuesday, August 24, 2004, last update on Tuesday, November 30, 2004
ImageSize  = width:824 height:226
PlotArea   = width:560 height:178 left:186 bottom:20
DateFormat = yyyy
Period     = from:1946 till:1990
TimeAxis   = orientation:horizontal
ScaleMajor = gridcolor:black unit:year increment:5 start:1950

BarData=
 bar:rvm text:"Voorzitter raad van ministers"
 bar:sg text:"Secretaris-generaal van de SED"

Colors=
  id:lightyellow value:rgb(1,1,0.4)

PlotData=
  color:lightyellow width:75 mark:(line,red) align:center fontsize:L shift:(0,0)
  # shift texts up or down manually to avoid overlap
  bar:rvm
  from:1949 till:1964 fontsize:M text:Otto Grotewohl
  from:1964 till:1973 shift:(0,-15) fontsize:M text:Willy Stoph
  from:1973 till:1976 shift:(0,13) fontsize:M  text:Horst~Sindermann
  from:1976 till:1989 shift:(0,-15) fontsize:M text:Willy Stoph
  from:1989 till:1990 shift:(0,17) fontsize:M text:Hans~Modrow
  from:1990 till:1990 shift:(20,-12) fontsize:M text:Lothar~de Maizière

  bar:sg color:red mark:(line,yellow) textcolor:white
  from:1946 till:1950 align:left shift:(-25,0) fontsize:M text:Wilhelm~Pieck
  from:1950 till:1971 fontsize:M text:Walter Ulbricht
  from:1971 till:1989 fontsize:M text:Erich Honecker
  from:1989 till:1989 align:left textcolor:black fontsize:M text:Egon~Krenz
| Nicotine | top next |

First version by Pieter1 on Tuesday, December 27, 2005, last update on Wednesday, January 4, 2006
ImageSize  = width:600 height:700
PlotArea   = left:50 bottom:10 top:0 right:0

DateFormat = yyyy
Period     = from:1800 till:2010
TimeAxis   = orientation:vertical
ScaleMajor = unit:year increment:25 start:1800

# there is no automatic collision detection,
# so shift texts up or down manually to avoid overlap

Define $dx = 10 # shift text to right side of bar

PlotData=
  bar:Leaders color:red width:25 mark:(line,white) align:left fontsize:S

  from:2000  till:2000  shift:($dx,10)   text:2000_Synthese van_(R)-nicotine
  from:1981  till:1981  shift:($dx,10)   text:1981_De_eerste_synthese_van_(S)-nicotine.
  from:1950  till:1950  shift:($dx,10)   text:Jaren_1950_De_eerste_studies_naar_het_metabolisme_van_nicotine_in_het_lichaam~werden_uitgevoerd.
  from:1895  till:1895 shift:($dx,10)    text:1895_Adolf_Pinner_bepaalde_de_chemische_structuur_van_nicotine.
  from:1847  till:1847 shift:($dx,10)  text:1847_Schloesing_bepaalde_het_molecuulgewicht,_dat_162,23_gram/mol_bedraagt.
  from:1843  till:1843 shift:($dx,10)    text:1843_Melsens_bepaalde_de_chemische_formule_van_nicotine:C10H14N2.~Andere_bronnen_zeggen_dat_de_molecuulformule_werd_bepaald_door~Adolf_Pinner_en_door_Richard_Wolffenstein.
  from:1828  till:1828 shift:($dx,10)    text:1828_Nicotine_werd_geïsoleerd_en_gezuiverd_door_Poselt_en_Reimann_van~de_Universiteit_van_Heidelberg._Zij_gaven_de_stof_de_naam_''nicotine''~ter_ere_van_Jean_Nicot._
  from:1809  till:1809 shift:($dx,10)    text:1809_Vauquelin,_een_Franse_wetenschapper,_was_de_eerste_die_nicotine~als_afzonderlijke_stof_waarnam._Hij_zag_een_vluchtige_(snel_verdampende)_component_in_het_sap_van_tabaksbladeren.
| Rock | top next |

First version by SanderSpek on Wednesday, August 25, 2004, last update on Sunday, July 16, 2006
TimeAxis = orientation:horizontal format:yyyy
ImageSize = width:800 height:auto barincrement:26
PlotArea = left:18 right:18 top:10 bottom:25

Colors =
  id:canvas value:rgb(0.97,0.97,0.97)
  id:grid1  value:rgb(0.86,0.86,0.86)
  id:grid2  value:gray(0.8)
  id:gray   value:gray(0.8)
  id:bars   value:rgb(0.96,0.96,0.6)
  id:group  value:gray(0.5)

BarData=
  barset:Bands

BackgroundColors = canvas:canvas

Period     = from:1960 till:2006
ScaleMajor = unit:year increment:5 start:1960 gridcolor:grid2
ScaleMinor = unit:year increment:1 start:1960 gridcolor:grid1

PlotData=

# set defaults
  width:22 fontsize:M textcolor:black align:left anchor:from shift:(10,-6) color:bars

  barset:Bands

  from:1962 till:1969 text:"[[The Beatles]]"
  from:1962 till:1991 text:"[[Frank Zappa]]"
  from:1963 till:end text:"[[Rolling Stones]]"
  from:1964 till:1983 text:"[[The Who]]"
  barset:break
  barset:skip
  barset:skip
  barset:skip
  from:2005 till:end text:
  from:1964 till:1972 text:"[[The Velvet Underground]]"
  barset:break
  barset:skip
  barset:skip
  barset:skip
  barset:skip
  from:1973 till:1974 text:
  barset:break
  barset:skip
  barset:skip
  barset:skip
  barset:skip
  from:1993 till:1994 text:
  from:1965 till:end text:"[[Pink Floyd]]"
  from:1965 till:2003 text:"[[Grateful Dead]]"
  from:1966 till:end text:"[[Genesis (band)|Genesis]]"
  from:1966 till:1970 text:"[[Jimi Hendrix|The Jimi Hendrix Experience]]"
  from:1966 till:1969 text:"[[Cream]]"
  barset:break
  barset:break
  barset:skip
  barset:skip
  barset:skip
  barset:skip
  barset:skip
  barset:skip
  barset:skip
  barset:skip
  barset:skip
  from:1970 till:end text:"[[Eric Clapton]]"
  from:1966 till:end text:"[[Rod Stewart]]"
  from:1966 till:end text:"[[Canned Heat]]"
  from:1967 till:end text:"[[David Bowie]]"
  from:1967 till:1971 text:"[[The Doors]]"
  from:1968 till:end text:"[[Jethro Tull]]"
  from:1968 till:1980 text:"[[Led Zeppelin]]"
  from:1968 till:end text:"[[Deep Purple]]"
  from:1969 till:end text:"[[Aerosmith]]"
  from:1969 till:1974 text:"[[Nick Drake]]"
  from:1969 till:end text:"[[Alice Cooper]]"
  from:1969 till:end text:"[[Santana (band)|Santana]]"
  from:1969 till:end text:"[[Black Sabbath]]"
  from:1970 till:end text:"[[Queen (rockgroep)|Queen]]"
  from:1973 till:end text:"[[Bruce Springsteen]]"
  from:1973 till:end text: "[[AC/DC]]"
  from:1974 till:1996 text:"[[Ramones]]"
  from:1975 till:1978 text:"[[Sex Pistols]]"
  from:1976 till:end text:"[[Iron Maiden]]"
  from:1976 till:end text:"[[The Cure]]"
  from:1976 till:end text:"[[Van Halen]]"
  from:1977 till:end text:"[[Elvis Costello]]"
  from:1977 till:end text:"[[Dire Straits]]"
  from:1979 till:end text:"[[Marillion]]"
  from:1980 till:end text:"[[U2 (band)|U2]]"
  from:1981  till:end text:"[[Sonic Youth]]"
  from:1982 till:1987 text:"[[The Smiths]]"
  from:1983 till:end text:"[[Metallica]]"
  from:1983 till:end text:"[[Bon Jovi]]"
  from:1984 till:end text:"[[Red Hot Chili Peppers]]"
  from:1986  till:1993 text:"[[Pixies]]"
  barset:break
  barset:skip
  barset:skip
  barset:skip
  barset:skip
  barset:skip
  barset:skip
  barset:skip
  barset:skip
  barset:skip
  barset:skip
  barset:skip
  barset:skip
  barset:skip
  barset:skip
  barset:skip
  barset:skip
  barset:skip
  barset:skip
  barset:skip
  barset:skip
  barset:skip
  barset:skip
  barset:skip
  barset:skip
  barset:skip
  barset:skip
  barset:skip
  barset:skip
  barset:skip
  barset:skip
  barset:skip
  barset:skip
  barset:skip
  barset:skip
  barset:skip
  barset:skip
  barset:skip
  barset:skip
  barset:skip
  from:2004 till:end text:
  from:1987 till:1994 text:"[[Nirvana (band)|Nirvana]]"
  from:1987 till:1993 text:"[[Guns 'n' Roses]]"
  from:1988 till:end text:"[[Queensrÿche]]"
  from:1988 till:2000 text:"[[Smashing Pumpkins]]"
  from:1989 till:end text:"[[Green Day]]"
  from:1989 till:end text:"[[Dream Theater]]"
  from:1989 till:end text:"[[Blur]]"
  from:1989 till:end text:"[[Radiohead]]"
  from:1990 till:end text:"[[Pearl Jam]]"
  from:1992 till:end text:"[[Korn]]"
  from:1992 till:2000 text:"[[Rage Against the Machine]]"
  from:1993 till:end text:"[[Oasis]]"
  from:1994 till:1997 text:"[[Jeff Buckley]]"
  from:1995 till:end text:"[[Rammstein]]"
  from:1995 till:end text:"[[Muse]]"
  from:1996 till:end text:"[[Slipknot]]"
  from:1997 till:end text:"[[Limp Bizkit]]"
  from:1997 till:end text:"[[Coldplay]]"
  from:1998 till:end text:"[[System Of A Down]]"
  from:1998 till:end text:"[[Soulfly]]"
  from:2000 till:end text:"[[Linkin Park]]"
| Zuiderzeewerken | top next |

First version by Danielm on Thursday, March 17, 2005, last update on Saturday, March 19, 2005
#
# Tijdlijn Zuiderzeewerken
#
ImageSize  = width:750 height:120
PlotArea   = left:75 bottom:20 width:600 height:50
AlignBars  = early

DateFormat = yyyy
Period     = from:1890 till:1990
TimeAxis   = orientation:horizontal
ScaleMajor = unit:year increment:10 start:1890

Colors =
  id:grey  value:gray(0.7)

PlotData=
  bar:Leaders color:red width:25 mark:(line,grey) align:left fontsize:S shift:(0,-40)
  from:1890 till:1990
  shift:(-10,20) textcolor:blue
  at:1891 mark:(line,blue) text:1891 Publicatie plan Lely
  at:1918 mark:(line,blue) text:1918 Zuiderzeewet
  textcolor:black
  at:1942 mark:(line,white) text:1942 Noordoostpolder
  at:1968 mark:(line,white) text:1968 Zuidelijk Flevoland
  shift:(-10,32)
  at:1927 mark:(line,white) text:1927 Andijk
  at:1957 mark:(line,white) text:1957 Oostelijk Flevoland
  shift:(-10,44)
  at:1930 mark:(line,white) text:1930 Wieringermeer
  at:1975 mark:(line,white) text:1975 Dijk Enkhuizen-Lelystad
  shift:(-10,56)
  at:1932 mark:(line,white) text:1932 Afsluitdijk
| Lijst van premiers van Nederland | top next |

First version by Ellywa on Sunday, January 2, 2005, last update on Sunday, April 30, 2006
# All measures all in pixels

ImageSize  = width:800 height:1600
PlotArea   = left:50 right:0 bottom:10 top:10
AlignBars  = early

DateFormat = yyyy
Period     = from:1847 till:2006
TimeAxis   = orientation:vertical
ScaleMajor = unit:year increment:5 start:1850

Colors =
  id:grey  value:gray(0.7)

# there is no automatic collision detection,
# so shift texts up or down manually to avoid overlap

Define $dx = 25 # shift text to right side of bar

PlotData=
  bar:Leaders color:red width:25 mark:(line,grey) align:left fontsize:S shift:($dx,0)

   from:1847 till:1848  color:yellow  text:[[Gerrit Schimmelpenninck]]
   from:1848 till:1849  color:yellow  text:[[Jacob De Kempenaer]]
   from:1849 till:1853  color:magenta text:[[Johan Rudolf Thorbecke|Johan Thorbecke]] (1e periode)
   from:1853 till:1856  color:green   text:[[Floris Adriaan Van Hall]] (1e periode)
   from:1856 till:1858  color:yellow  text:[[Justinus Van der Brugghen]]
   from:1858 till:1860  color:yellow  text:[[Jan Jacob Rochussen]]
   from:1860 till:1861  color:green   text:[[Floris Adriaan Van Hall]] (2e periode)
   from:1861 till:1862  color:yellow  text:[[Jacob van Zuylen van Nijevelt]] / [[Schelto van Heemstra (1807-1864)|Schelto baron van Heemstra]]
   from:1862 till:1866  color:magenta text:[[Johan Rudolf Thorbecke|Johan Thorbecke]] (2e periode)
   from:1866 till:1866                text:[[Isaäc Dignus Fransen van de Putte]]
   from:1866 till:1868  color:orange  text:[[Julius van Zuylen van Nijevelt]]
   from:1868 till:1871  color:yellow  text:[[Pieter Philip van Bosse]]
   from:1871 till:1872  color:magenta text:[[Johan Rudolf Thorbecke|Johan Thorbecke]] (3e regeringsperiode)
   from:1872 till:1874  color:yellow  text:[[Gerrit de Vries Azn]].
   from:1874 till:1877  color:blue    text:[[Jan Heemskerk Azn]]. (1e regeringsperiode)
   from:1877 till:1879  color:yellow  text:[[Johannes Kappeyne van de Coppello]]
   from:1879 till:1883  color:yellow  text:[[Theo van Lynden van Sandenburg]]
   from:1883 till:1888  color:blue    text:[[Jan Heemskerk Azn]].(2e regeringsperiode)
   from:1888 till:1891  color:yellow  text:[[Aeneas Mackay]]
   from:1891 till:1894  color:yellow  text:[[Gijsbert van Tienhoven]]
   from:1894 till:1897  color:yellow  text:[[Joan Röell]]
   from:1897 till:1901  color:yellow  text:[[Nicolaas Pierson]]
   from:1901 till:1905  color:yellow  text:[[Abraham Kuyper]]
   from:1905 till:1908  color:yellow  text:[[Theo de Meester]]
   from:1908 till:1913  color:blue    text:[[Theo Heemskerk]]
   from:1913 till:1918  color:yellow  text:[[Pieter Cort van der Linden]]
   from:1918 till:1925  color:green   text:[[Charles Ruys de Beerenbrouck]] (1e en 2e)
   from:1925 till:1926  color:red     text:[[Hendrik Colijn]] (1e periode)
   from:1926 till:1929  color:pink    text:[[Dirk Jan de Geer]] (1e periode)
   from:1929 till:1933  color:green   text:[[Charles Ruys de Beerenbrouck]] (3e)
   from:1933 till:1939  color:red     text:[[Hendrik Colijn]] (2e periode)
   from:1939 till:1940  color:pink    text:[[Dirk Jan de Geer]] (2e periode)
   from:1940 till:1945  color:yellow  text:[[Pieter Gerbrandy]]
   from:1945 till:1946  color:yellow  text:[[Willem Schermerhorn]]
   from:1946 till:1948  color:green   text:[[Louis Beel]]
   from:1948 till:1958  color:yellow  text:[[Willem Drees]]
   from:1958 till:1959  color:green   text:[[Louis Beel]]
   from:1959 till:1963  color:yellow  text:[[Jan de Quay]]
   from:1963 till:1965  color:yellow  text:[[Victor Marijnen]]
   from:1965 till:1966  color:yellow  text:[[Jo Cals]]
   from:1966 till:1967  color:yellow  text:[[Jelle Zijlstra]]
   from:1967 till:1971  color:yellow  text:[[Piet de Jong]]
   from:1971 till:1973  color:yellow  text:[[Barend Biesheuvel]]
   from:1973 till:1977  color:yellow  text:[[Joop den Uyl]]
   from:1977 till:1982  color:yellow  text:[[Dries van Agt]]
   from:1982 till:1994  color:yellow  text:[[Ruud Lubbers]]
   from:1994 till:2002  color:yellow  text:[[Wim Kok]]
   from:2002 till:end   color:yellow  text:[[Jan Peter Balkenende]]
| Deltawerken | top next |

Initial version by ART on Wednesday, March 23, 2005
#
# Tijdlijn Deltawerken
#
ImageSize  = width:750 height:120
PlotArea   = left:25 bottom:20 width:600 height:50
AlignBars  = early

DateFormat = yyyy
Period     = from:1950 till:2000
TimeAxis   = orientation:horizontal
ScaleMajor = unit:year increment:5 start:1950

Colors =
  id:grey  value:gray(0.7)

PlotData=
  bar:Leaders color:red width:25 mark:(line,grey) align:left fontsize:S shift:(0,-40)
  from:1950 till:2000
  shift:(-10,20) textcolor:blue
  at:1953 mark:(line,blue) text:1953 Watersnoodramp
  textcolor:black
  at:1965 mark:(line,white) text:1965 Grevelingendam
  at:1983 mark:(line,white) text:1983 Markiezaatskade
  at:1997 mark:(line,white) text:1997 Maeslantkering
  shift:(-10,32)
  at:1958 mark:(line,white) text:1958 Stormvloedkering Hollandse IJssel
  at:1986 mark:(line,white) text:1986 Oosterscheldekering
  shift:(-10,44)
  at:1960 mark:(line,white) text:1960 Zandkreekdam
  at:1969 mark:(line,white) text:1969 Volkerakdam
  at:1987 mark:(line,white) text:1987 Oesterdam
  shift:(-10,56)
  at:1961 mark:(line,white) text:1961 Veerse Gatdam
  at:1971 mark:(line,white) text:1971 Haringvlietdam
  at:1987 mark:(line,white) text:1987 Philipsdam
  shift:(-10,68)
  at:1971 mark:(line,white) text:1971 Brouwersdam
| Koekelare | top next |

First version by Zonneschijn on Monday, June 5, 2006, last update on Monday, June 19, 2006
Colors=
  id:a value:gray(0.9)
  id:b value:gray(0.7)
  id:c value:rgb(1,1,1)
  id:d value:rgb(0.7,0.8,0.9)
  id:e value:rgb(0.6,0.7,0.8)

ImageSize  = width:750 height:373
PlotArea   = left:50 bottom:30 top:30 right:30
DateFormat = x.y
Period     = from:0 till:10000
TimeAxis   = orientation:vertical
AlignBars  = justify
ScaleMajor = gridcolor:b increment:1250 start:0
ScaleMinor = gridcolor:a increment:250 start:0
BackgroundColors = canvas:c

BarData=
  bar:1806 text:1806
  bar:1816 text:1816
  bar:1830 text:1830
  bar:1846 text:1846
  bar:1856 text:1856
  bar:1866 text:1866
  bar:1876 text:1876
  bar:1880 text:1880
  bar:1890 text:1890
  bar:1900 text:1900
  bar:1910 text:1910
  bar:1920 text:1920
  bar:1930 text:1930
  bar:1947 text:1947
  bar:1961 text:1961
  bar:1970 text:1970
  bar:1977 text:1977
  bar:1980 text:1980
  bar:1990 text:1990
  bar:2000 text:2000
  bar:2005 text:2005

PlotData=
  color:d width:20 align:left

  bar:1806 from:0 till: 2695
  bar:1816 from:0 till: 3075
  bar:1830 from:0 till: 3850
  bar:1846 from:0 till: 3935
  bar:1856 from:0 till: 3840
  bar:1866 from:0 till: 4412
  bar:1876 from:0 till: 4788
  bar:1880 from:0 till: 4863
  bar:1890 from:0 till: 5069
  bar:1900 from:0 till: 5480
  bar:1910 from:0 till: 6003
  bar:1920 from:0 till: 5898
  bar:1930 from:0 till: 5358
  bar:1947 from:0 till: 5982
  bar:1961 from:0 till: 6372
  bar:1970 from:0 till: 6449
  color:e width:20 align:left
  bar:1970 from:6449 till:7807
  bar:1977 from:0 till: 7475
  bar:1980 from:0 till: 7525
  bar:1990 from:0 till: 7696
  bar:2000 from:0 till: 8154
  bar:2005 from:0 till: 8254

PlotData=

  bar:1806 at: 2695 fontsize:s text: 2695 shift:(-10,5)
  bar:1816 at: 3075 fontsize:S text: 3075 shift:(-10,5)
  bar:1830 at: 3850 fontsize:S text: 3850 shift:(-10,5)
  bar:1846 at: 3935 fontsize:S text: 3935 shift:(-10,5)
  bar:1856 at: 3840 fontsize:S text: 3840 shift:(-10,5)
  bar:1866 at: 4412 fontsize:S text: 4412 shift:(-10,5)
  bar:1876 at: 4788 fontsize:S text: 4788 shift:(-10,5)
  bar:1880 at: 4863 fontsize:S text: 4863 shift:(-10,5)
  bar:1890 at: 5069 fontsize:S text: 5069 shift:(-10,5)
  bar:1900 at: 5480 fontsize:S text: 5480 shift:(-10,5)
  bar:1910 at: 6003 fontsize:S text: 6003 shift:(-10,5)
  bar:1920 at: 5898 fontsize:S text: 5898 shift:(-10,5)
  bar:1930 at: 5358 fontsize:S text: 5358 shift:(-10,5)
  bar:1947 at: 5982 fontsize:S text: 5982 shift:(-10,5)
  bar:1961 at: 6372 fontsize:S text: 6372 shift:(-10,5)
  bar:1970 at: 7807 fontsize:S text: 6449 shift:(-10,5)
  bar:1970 at: 8307 fontsize:S text: 7807 shift:(-10,5)
  bar:1977 at: 7475 fontsize:S text: 7475 shift:(-10,5)
  bar:1980 at: 7525 fontsize:S text: 7525 shift:(-10,5)
  bar:1990 at: 7696 fontsize:S text: 7696 shift:(-10,5)
  bar:2000 at: 8154 fontsize:S text: 8154 shift:(-10,5)
  bar:2005 at: 8254 fontsize:S text: 8254 shift:(-10,5)
| Gemeente Kaprijke | top next |

Initial version by Zonneschijn on Monday, July 31, 2006
Colors=
  id:a value:gray(0.9)
  id:b value:gray(0.7)
  id:c value:rgb(1,1,1)
  id:d value:rgb(0.6,0.7,0.8)

ImageSize  = width:350 height:373
PlotArea   = left:50 bottom:30 top:30 right:30
DateFormat = x.y
Period     = from:0 till:8000
TimeAxis   = orientation:vertical
AlignBars  = justify
ScaleMajor = gridcolor:b increment:1000 start:0
ScaleMinor = gridcolor:a increment:200 start:0
BackgroundColors = canvas:c

BarData=
  bar:1977 text:1977
  bar:1980 text:1980
  bar:1985 text:1985
  bar:1990 text:1990
  bar:1995 text:1995
  bar:2000 text:2000
  bar:2005 text:2005
  bar:2006 text:2006

PlotData=
  color:d width:20 align:left

  bar:1977 from:0 till: 6001
  bar:1980 from:0 till: 6071
  bar:1985 from:0 till: 6076
  bar:1990 from:0 till: 6116
  bar:1995 from:0 till: 6249
  bar:2000 from:0 till: 6175
  bar:2005 from:0 till: 6069
  bar:2006 from:0 till: 6128

PlotData=

  bar:1977 at: 6001 fontsize:s text: 6.001 shift:(-10,5)
  bar:1980 at: 6071 fontsize:s text: 6.071 shift:(-10,5)
  bar:1985 at: 6076 fontsize:s text: 6.076 shift:(-10,5)
  bar:1990 at: 6116 fontsize:s text: 6.116 shift:(-10,5)
  bar:1995 at: 6249 fontsize:S text: 6.249 shift:(-10,5)
  bar:2000 at: 6175 fontsize:S text: 6.175 shift:(-10,5)
  bar:2005 at: 6069 fontsize:S text: 6.069 shift:(-10,5)
  bar:2006 at: 6128 fontsize:S text: 6.128 shift:(-10,5)
| Zonhoven | top next |

First version by Zonneschijn on Thursday, April 20, 2006, last update on Tuesday, June 20, 2006
Colors=
  id:a value:gray(0.9)
  id:b value:gray(0.7)
  id:c value:rgb(1,1,1)
  id:d value:rgb(0.7,0.8,0.9)
  id:e value:rgb(0.6,0.7,0.8)

ImageSize  = width:750 height:373
PlotArea   = left:50 bottom:30 top:30 right:30
DateFormat = x.y
Period     = from:0 till:20000
TimeAxis   = orientation:vertical
AlignBars  = justify
ScaleMajor = gridcolor:b increment:2500 start:0
ScaleMinor = gridcolor:a increment:500 start:0
BackgroundColors = canvas:c

BarData=
  bar:1806 text:1806
  bar:1816 text:1816
  bar:1830 text:1830
  bar:1846 text:1846
  bar:1856 text:1856
  bar:1866 text:1866
  bar:1876 text:1876
  bar:1880 text:1880
  bar:1890 text:1890
  bar:1900 text:1900
  bar:1910 text:1910
  bar:1920 text:1920
  bar:1930 text:1930
  bar:1947 text:1947
  bar:1961 text:1961
  bar:1970 text:1970
  bar:1977 text:1977
  bar:1980 text:1980
  bar:1990 text:1990
  bar:2000 text:2000
  bar:2005 text:2005

PlotData=
  color:d width:20 align:left

  bar:1806 from:0 till: 2738
  bar:1816 from:0 till: 2600
  bar:1830 from:0 till: 2830
  bar:1846 from:0 till: 2759
  bar:1856 from:0 till: 2748
  bar:1866 from:0 till: 2582
  bar:1876 from:0 till: 2647
  bar:1880 from:0 till: 2716
  bar:1890 from:0 till: 2792
  bar:1900 from:0 till: 2918
  bar:1910 from:0 till: 3585
  bar:1920 from:0 till: 4177
  bar:1930 from:0 till: 5234
  bar:1947 from:0 till: 7484
  bar:1961 from:0 till: 11472
  bar:1970 from:0 till: 13484
  bar:1977 from:0 till: 14607

  color:e width:20 align:left
  bar:1977 from:14607 till:15127
  bar:1980 from:0 till: 15696
  bar:1990 from:0 till: 17249
  bar:2000 from:0 till: 18940
  bar:2005 from:0 till: 19693

PlotData=

  bar:1806 at: 2738 fontsize:s text: 2738 shift:(-10,5)
  bar:1816 at: 2600 fontsize:S text: 2600 shift:(-10,5)
  bar:1830 at: 2830 fontsize:S text: 2830 shift:(-10,5)
  bar:1846 at: 2759 fontsize:S text: 2759 shift:(-10,5)
  bar:1856 at: 2748 fontsize:S text: 2748 shift:(-10,5)
  bar:1866 at: 2582 fontsize:S text: 2582 shift:(-10,5)
  bar:1876 at: 2647 fontsize:S text: 2647 shift:(-10,5)
  bar:1880 at: 2716 fontsize:S text: 2716 shift:(-10,5)
  bar:1890 at: 2792 fontsize:S text: 2792 shift:(-10,5)
  bar:1900 at: 2918 fontsize:S text: 2918 shift:(-10,5)
  bar:1910 at: 3585 fontsize:S text: 3585 shift:(-10,5)
  bar:1920 at: 4177 fontsize:S text: 4177 shift:(-10,5)
  bar:1930 at: 5234 fontsize:S text: 5234 shift:(-10,5)
  bar:1947 at: 7484 fontsize:S text: 7484 shift:(-10,5)
  bar:1961 at: 11472 fontsize:S text: 11.472 shift:(-10,5)
  bar:1970 at: 13484 fontsize:S text: 13.484 shift:(-10,5)
  bar:1977 at: 15127 fontsize:S text: 14.607 shift:(-10,5)
  bar:1977 at: 16127 fontsize:S text: 15.127 shift:(-10,5)
  bar:1980 at: 15696 fontsize:S text: 15.696 shift:(-10,5)
  bar:1990 at: 17249 fontsize:S text: 17.249 shift:(-10,5)
  bar:2000 at: 18940 fontsize:S text: 18.940 shift:(-10,5)
  bar:2005 at: 19693 fontsize:S text: 19.693 shift:(-10,5)
| H5N1 | top next |

Initial version by Jigsjdg on Tuesday, March 7, 2006
TimeAxis = orientation:horizontal format:yyyy
ImageSize = width:850 height:320
PlotArea = width:800 height:270 bottom:20 left:20

Colors =
  id:canvas value:rgb(0.97,0.97,0.97)
  id:grid1  value:rgb(0.86,0.86,0.86)
  id:grid2  value:gray(0.8)
  id:bar2   value:rgb(1, 0.3, 0.3)
  id:bar3   value:rgb(1, 0.6, 0.3)
  id:bars   value:rgb(0.96,0.96,0.6)

BackgroundColors = canvas:canvas

Period     = from:1880 till:2006
ScaleMajor = unit:year increment:5 start:1880 gridcolor:grid1

BarData=
  barset:Virussen

LineData =
  at:1889 color:grid2 layer:back
  at:1918 color:grid2 layer:back
  at:1957 color:grid2 layer:back
  at:1968 color:grid2 layer:back
  at:1996 color:grid2 layer:back

PlotData=

# set defaults
  width:25 fontsize:S textcolor:black align:left anchor:from shift:(10,-4) color:bars

  barset:Virussen
  from:1918 till:1919 color:bar2 text:"[[H1N1]] of [[Spaanse griep]] veroorzaakt een pandemie: 20 tot 40 miljoen doden."
  from:1920 till:1970 text:"[[H1N1]] Dominante streng in jaarlijkse griep"
  from:1889 till:1890 color:bar2 text:"[[H2N2]] veroorzaakt een pandemie"
  from:1890 till:1957 text:"H2N2 muteert talloze malen, voornamelijk bij vogels"
  from:1957 till:1958 color:bar2 text:"[[H2N2]] variant veroorzaakt de [[Aziatische griep]] pandemie"
  from:1958 till:1968 text:"Door antigene shift muteert H2N2 in H3N2"
  from:1968 till:1969 color:bar2 text:"[[Hong Kong griep]] pandemie ([[H3N2]])"
  from:1970 till:2006 text:"[[H3N2]] dominante streng in jaarlijkse griep"
  from:1996 till:2006 color:bar3 text:"[[H5N1]] rukt op"
| Borgerhout | top next |

First version by Zonneschijn on Tuesday, June 27, 2006, last update on Saturday, July 1, 2006
Colors=
  id:a value:gray(0.9)
  id:b value:gray(0.7)
  id:c value:rgb(1,1,1)
  id:d value:rgb(0.6,0.7,0.8)

ImageSize  = width:700 height:373
PlotArea   = left:50 bottom:30 top:30 right:30
DateFormat = x.y
Period     = from:0 till:60000
TimeAxis   = orientation:vertical
AlignBars  = justify
ScaleMajor = gridcolor:b increment:7500 start:0
ScaleMinor = gridcolor:a increment:1500 start:0
BackgroundColors = canvas:c

BarData=
  bar:1836 text:1836
  bar:1846 text:1846
  bar:1856 text:1856
  bar:1866 text:1866
  bar:1876 text:1876
  bar:1880 text:1880
  bar:1890 text:1890
  bar:1900 text:1900
  bar:1910 text:1910
  bar:1920 text:1920
  bar:1930 text:1930
  bar:1947 text:1947
  bar:1961 text:1961
  bar:1970 text:1970
  bar:1980 text:1980
  bar:1982 text:1982
  bar:2003 text:2003
  bar:2006 text:2006

PlotData=
  color:d width:20 align:left

  bar:1836 from:0 till: 4136
  bar:1846 from:0 till: 5347
  bar:1856 from:0 till: 7308
  bar:1866 from:0 till: 10884
  bar:1876 from:0 till: 18637
  bar:1880 from:0 till: 20268
  bar:1890 from:0 till: 28882
  bar:1900 from:0 till: 37693
  bar:1910 from:0 till: 49333
  bar:1920 from:0 till: 52860
  bar:1930 from:0 till: 56054
  bar:1947 from:0 till: 50877
  bar:1961 from:0 till: 51182
  bar:1970 from:0 till: 49002
  bar:1980 from:0 till: 44369
  bar:1982 from:0 till: 43302
  bar:2003 from:0 till: 40453
  bar:2006 from:0 till: 41614

PlotData=

  bar:1836 at: 4136 fontsize:S text: 4.136 shift:(-10,5)
  bar:1846 at: 5347 fontsize:S text: 5.347 shift:(-10,5)
  bar:1856 at: 7308 fontsize:S text: 7.308 shift:(-10,5)
  bar:1866 at: 10884 fontsize:S text: 10.884 shift:(-10,5)
  bar:1876 at: 18637 fontsize:S text: 18.637 shift:(-10,5)
  bar:1880 at: 20268 fontsize:S text: 20.268 shift:(-10,5)
  bar:1890 at: 28882 fontsize:S text: 28.882 shift:(-10,5)
  bar:1900 at: 37693 fontsize:S text: 37.693 shift:(-10,5)
  bar:1910 at: 49333 fontsize:S text: 49.333 shift:(-10,5)
  bar:1920 at: 52860 fontsize:S text: 52.860 shift:(-10,5)
  bar:1930 at: 56054 fontsize:S text: 56.054 shift:(-10,5)
  bar:1947 at: 50877 fontsize:S text: 50.877 shift:(-10,5)
  bar:1961 at: 51182 fontsize:S text: 51.182 shift:(-10,5)
  bar:1970 at: 49002 fontsize:S text: 49.002 shift:(-10,5)
  bar:1980 at: 44369 fontsize:S text: 44.369 shift:(-10,5)
  bar:1982 at: 43302 fontsize:S text: 43.302 shift:(-10,5)
  bar:2003 at: 40453 fontsize:S text: 40.453 shift:(-10,5)
  bar:2006 at: 41614 fontsize:S text: 41.614 shift:(-10,5)
| Christlich Demokratische Union Deutschlands (DDR) | top next |

Initial version by Nicklaarakkers on Thursday, December 29, 2005
ImageSize  = width:300 height:320
PlotArea   = width:250 height:300 left:50 bottom:10

DateFormat = yyyy
Period     = from:1945 till:1990
TimeAxis   = orientation:vertical
ScaleMajor = unit:year increment:5 start:1945

Define $dx = 25

PlotData=
  bar:Leaders color:blue width:25 mark:(line,white) align:left fontsize:S

  from:1945  till:1945 shift:($dx,0)   text:[[Andreas Hermes]]
  from:1946  till:1947 shift:($dx,0)   text:[[Jakob Kaiser]]
  from:1948  till:1957 shift:($dx,0)   text:[[Otto Nuschke]]
  from:1957  till:1966 shift:($dx,0)   text:[[August Bach]]
  from:1966  till:1989 shift:($dx,0)   text:[[Gerald Götting]]
  from:1989  till:1989 shift:($dx,0)   text:[[Wolfgang Heyl]]
  from:1990  till:1990 shift:($dx,0)   text:[[Lothar de Maizière]]
| Thebe (Egypte) | top next |

Initial version by 84.194.214.222 on Saturday, May 6, 2006
ImageSize  = width:600 height:465
PlotArea   = width:600 height:465 left:0 bottom:0
TimeAxis  = orientation:horizontal # dummy, required
Period    = from:0 till:600 # dummy, required
Define $s = fontsize:M
Colors =
  id:blue     value:blue
  id:green    value:green
  id:yellow   value:yellow
BackgroundColors = bars:blue
PlotData=
  bar:u18 from:start      till:523 color:yellow
          from:524        till:562 color:green
          from:563        till:600 color:blue
  bar:u17 from:start      till:511 color:yellow
          from:512        till:549 color:green
          from:550        till:600 color:blue
  bar:u16 from:start      till:485 color:yellow
          from:486        till:536 color:green
          from:537        till:600 color:blue
  bar:u15 from:start      till:472 color:yellow
          from:472        till:523 color:green
          from:524        till:587 color:blue
          from:588        till:600 color:green
  bar:u14 from:start      till:447 color:yellow
          from:447        till:511 color:green
          from:512        till:574 color:blue
          from:575        till:600 color:green
  bar:u13 from:start      till:434 color:yellow
          from:434        till:498 color:green
          from:499        till:549 color:blue
          from:550        till:600 color:green
  bar:u12 from:start      till:409 color:yellow
          from:410        till:491 color:green
          from:492        till:536 color:blue
          from:537        till:600 color:green
  bar:u11 from:start      till:383 color:yellow
          from:384        till:485 color:green
          from:486        till:523 color:blue
          from:524        till:600 color:green
  bar:u10 from:start      till:281 color:yellow
          from:282        till:485 color:green
          from:486        till:523 color:blue
          from:524        till:600 color:green
  bar:u9  from:start      till:255 color:yellow
          from:256        till:485 color:green
          from:486        till:523 color:blue
          from:524        till:600 color:green
  bar:u8  from:start      till:204 color:yellow
          from:205        till:472 color:green
          from:473        till:511 color:blue
          from:512        till:600 color:green
  bar:u7  from:start      till:191 color:yellow
          from:192        till:460 color:green
          from:461        till:498 color:blue
          from:499        till:600 color:green
  bar:u6  from:start      till:140 color:yellow
          from:141        till:447 color:green
          from:448        till:485 color:blue
          from:486        till:600 color:green
  bar:u5  from:start      till:140 color:yellow
          from:141        till:434 color:green
          from:435        till:472 color:blue
          from:473        till:600 color:green
  bar:u4  from:start      till:109 color:yellow
          from:110        till:409 color:green
          from:410        till:460 color:blue
          from:461        till:600 color:green
  bar:u3  from:start      till:89  color:yellow
          from:90         till:383 color:green
          from:384        till:434 color:blue
          from:435        till:600 color:green
  bar:u2  from:start      till:58  color:yellow
          from:59         till:358 color:green
          from:359        till:415 color:blue
          from:416        till:600 color:green
  bar:u1  from:start      till:25  color:yellow
          from:26         till:332 color:green
          from:333        till:396 color:blue
          from:397        till:600 color:green

TextData  =
  pos:(500,167)$s text:o [[Karnak|Karnakcomplex]]
  pos:(421,44)$s text:o [[Luxortempel]]
  pos:(178,289)$s text:o [[Vallei der Koningen]]
  pos:(217,267)$s text:o [[Deir el-Bahri]]
  pos:(319,256)$s text:o [[Dra Abu el-Naga]]
  pos:(242,205)$s text:o [[Ramesseum]]
  pos:(178,225)$s text:o [[Deir el-Medina]]
  pos:(127,211)$s text:o [[Vallei der Koninginnen]]
  pos:(230,167)$s text:o [[Kolossen van Memnon]]
  pos:(242,244)$s text:o [[el-Asasif]]
  pos:(179,151)$s text:o [[Medinet Haboe (tempel van Ramses III)|Medinet Haboe]]
  pos:(100,244)$s text:[[Schech Abd el-Korna]] o
  pos:(204,190)$s text:o [[Kurnet Murai]]
  pos:(383,233)$s text:o [[Qurna]]

TextData  =
  pos:(470,80) fontsize:XL text:[[Luxor]]
  pos:(460,60) fontsize:XL text:[[Oost-Thebe]]
  pos:(500,360) fontsize:XL text:[[Nijl]]->
  pos:(250,120) fontsize:XL text:[[West-Thebe]]
| Weimarrepubliek | top next |

First version by Känsterle on Thursday, September 22, 2005, last update on Sunday, February 19, 2006
ImageSize	= width:230 height:620
PlotArea	= left:39 right:10 bottom:80 top:20
Legend		= columns:2 left:40 top:60 columnwidth:90

DateFormat	= dd/mm/yyyy
Period		= from:13/02/1919 till:30/01/1933
TimeAxis	= orientation:vertical format:yyyy

ScaleMajor	= unit:year increment:1 start:01/01/1920

Colors=
 id:SPD	value:red	legend:SPD
 id:DVP value:yellow	legend:DVP
 id:Wahl value:green    legend:Rijksdagverkiezingen
 id:Z value:black	legend:Zentrum
 id:NA value:gray(0.5)	legend:Partijloos

LineData=
 tillpos:59
 #at:19/01/1919 color:Wahl #eigentl. Verkiezingen voor de Nationale Vergadering
 at:06/06/1920  color:Wahl
 at:04/05/1924  color:Wahl
 at:07/12/1924  color:Wahl
 at:20/05/1928  color:Wahl
 at:14/09/1930  color:Wahl
 at:31/07/1932  color:Wahl
 at:06/11/1932  color:Wahl
 #at:05/03/1933 color:Wahl

PlotData=
 bar:Reichskanzler color:SPD width:20 fontsize:M align:left shift:(20,-5) mark:(line,white)

 from:start till:20/06/1919 text:[[Philipp_Scheidemann]]~(minister-president)
 from:21/06/1919 till:26/03/1920 text:[[Gustav_Bauer]]
 from:27/03/1920 till:08/06/1920 text:[[Hermann_Müller|Hermann_Müller]]
 color:Z
 from:25/06/1920 till:04/05/1921 text:[[Konstantin_Fehrenbach]]
 from:10/05/1921 till:14/11/1922 text:Dr._[[Joseph_Wirth]]
 from:22/11/1922 till:12/08/1923 text:Dr._[[Wilhelm_Cuno]] color:NA
 from:13/08/1923 till:23/11/1923 text:Dr._[[Gustav_Stresemann]] color:DVP
 from:30/11/1923 till:15/01/1925 text:Dr._[[Wilhelm_Marx]]
 from:15/01/1925 till:16/05/1926 text:Dr._[[Hans_Luther]] color:NA
 from:16/05/1926 till:28/06/1928 text:Dr._[[Wilhelm_Marx]]
 from:28/06/1928 till:30/03/1930 text:[[Hermann_Müller|Hermann_Müller]] color:SPD
 from:30/03/1930 till:31/05/1932 text:Dr._[[Heinrich_Brüning|Heinrich Brüning]]
 color:NA
 from:01/06/1932 till:01/12/1932 text:[[Franz_von_Papen]] shift:(20,-8)
 from:02/12/1932 till:28/01/1933 text:[[Kurt_von_Schleicher]] shift:(20,-9)
 at:30/01/1933 text:[[Adolf_Hitler]] shift:(20,0)
| Rijnland-Palts | top next |

Initial version by Wdelaet on Saturday, March 25, 2006
ImageSize = width:220 height:300
PlotArea  = left:50 right:0 bottom:40 top:10
Legend    = columns:2 left:15 top:25 columnwidth:50

DateFormat = yyyy
Period     = from:1947 till:2006
TimeAxis   = orientation:vertical format:yyyy
ScaleMajor = unit:year increment:5 start:1947

Colors=
  id:CDU  value:gray(0.25) legend:CDU
  id:SPD  value:red    legend:SPD

PlotData=
  bar:Leaders width:25 mark:(line,white) align:left fontsize:S

  from:start till:1947 shift:(25,-5) color:CDU text:[[Wilhelm Boden]]~tot 13 juli 1947
  from:1947  till:1969 shift:(25,-5) color:CDU text:[[Peter Altmeier]]
  from:1969  till:1976 shift:(25,-5) color:CDU text:[[Helmut Kohl]]
  from:1976  till:1988 shift:(25,-5) color:CDU text:[[Bernhard Vogel]]
  from:1988  till:1991 shift:(25,-5) color:CDU text:[[Carl-Ludwig Wagner]]
  from:1991  till:1994 shift:(25,-5) color:SPD text:[[Rudolf Scharping]]
  from:1994  till:end  shift:(25,0) color:SPD text:[[Kurt Beck]]
| Sozialdemokratische Partei Deutschlands | top next |

First version by Wdelaet on Thursday, November 3, 2005, last update on Sunday, May 14, 2006
ImageSize	= width:250 height:550
PlotArea	= left:40 right:0 bottom:80 top:20
#Legend		= columns:3 left:40 top:60 columnwidth:50

DateFormat	= dd/mm/yyyy
Period		= from:11/05/1946 till:31/12/2006
TimeAxis	= orientation:vertical format:yyyy

ScaleMajor	= unit:year increment:5 start:1950

Colors=
 id:id1	value:black
 id:id2 value:blue
 id:id3 value:red

PlotData=
 bar:xxx color:id1 width:20 fontsize:S align:left shift:(20,-5) mark:(line,white)

 from:11/05/1946	till:20/08/1952 text:[[Kurt_Schumacher|Dr._Kurt_Schumacher]] color:id1
 from:27/09/1952	till:14/12/1963 text:[[Erich_Ollenhauer]] color:id2
 from:16/02/1964	till:14/06/1987 text:[[Willy_Brandt]] color:id1
 from:14/06/1987	till:29/05/1991	text:[[Hans-Jochen_Vogel|Dr._Hans-Jochen_Vogel]] color:id2
 from:29/05/1991 	till:03/05/1993	text:[[Björn_Engholm]] color:id1
 from:03/05/1993 	till:25/06/1993  color:id2
 from:25/06/1993 	till:16/11/1995 text:[[Rudolf_Scharping]] color:id1
 from:16/11/1995 	till:11/03/1999 text:[[Oskar_Lafontaine]] color:id2
 from:11/03/1999 	till:21/03/2004 text:[[Gerhard_Schröder]] color:id1
 from:21/03/2004 	till:15/11/2005	text:[[Franz_Müntefering]] color:id2
 from:15/11/2005 	till:10/04/2006 text:[[Matthias_Platzeck]] color:id1
 from:10/04/2006        till:end        text:[[Kurt_Beck]] color:id2
| Lijst van heersers van Rusland | top next |

First version by Jeroenvrp on Thursday, August 25, 2005, last update on Thursday, September 29, 2005
ImageSize  = width:700 height:100
PlotArea   = left:40 right:30 top:30 bottom:30
TimeAxis   = orientation:horizontal
DateFormat = yyyy
Period     = from:1325 till:1918
AlignBars  = early
ScaleMajor = unit:year increment:100 start:1400
Colors =


  id:gray value:gray(0.7)

Define $dx=-3

PlotData =
  bar:events width:25 color:red shift:($dx,-20)

  from:1325 till:1547  color:lavender
  from:1547 till:1605  color:yellowgreen
  from:1605 till:1613  color:drabgreen
  from:1613 till:1721 color:green
  from:1721 till:1918 color:teal

  at: 1330 text:"Grootvorsten van Moskovië" shift:($dx,-5)
  at: 1552 text:"Tsaren van Rusland" shift:($dx,-5)
  at: 1726 text:"Keizers (of tsaren) van Rusland"  shift:($dx,-5)
| Lijst van Belgische nationale regeringen | top next |

First version by Riki on Tuesday, November 1, 2005, last update on Thursday, May 4, 2006
ImageSize  = width:730 height:240
PlotArea   = left:120 right:20 top:30 bottom:30
TimeAxis   = orientation:horizontal
DateFormat = dd/mm/yyyy

Period     = from:12/02/1945 till:01/01/2006
AlignBars  = early
ScaleMajor = unit:year increment:5 start:12/02/1945


Colors =
    id:comm value:rgb(1,0,0) # red
    id:soc value:rgb(1,0.7,0.7) # light red
    id:christ value:rgb(1,0.5,0) # orange
    id:lib value:rgb(0.7,0.7,1) # blue
    id:nat value:rgb(1,1,0) # yellow
    id:groen value:rgb(0,1,0) # green

Define $dx=-3

PlotData =
  bar:Communist width:20 color:comm shift:($dx,0)
  from:12/02/1945 till:13/03/1946 color:comm
  from:31/03/1946 till:20/03/1947 color:comm
  at:01/01/1946 text:"[[KPB]]/[[Kommunistische Partij van België|PCB]]" shift:($dx,-5)

  bar:Socialist width:20 color:soc shift:($dx,0)
  from:12/02/1945 till:11/08/1949 color:soc
  from:23/04/1954 till:26/06/1958 color:soc
  from:25/04/1961 till:19/03/1966 color:soc
  from:17/06/1968 till:25/04/1974 color:soc
  from:03/06/1977 till:17/12/1981 color:soc
  from:09/05/1988 till:end color:soc
  at:01/01/1946 text:"[[BSP]]/[[PSB]]" shift:($dx,-5)
  at:01/01/1980 text:"[[Socialistische Partij Anders|SP]]/[[Parti Socialiste (België)|PS]]" shift:($dx,-5)

  bar:Christelijk width:20 color:christ shift:($dx,0)
  from:12/02/1945 till:02/08/1945 color:christ
  from:13/03/1946 till:31/03/1946 color:christ
  from:20/03/1947 till:23/04/1954 color:christ
  from:26/06/1958 till:12/07/1999 color:christ
  at:12/02/1945 text:"katholieken" shift:($dx,-5)
  at:31/03/1960 text:"[[CVP]]/[[PSC]]" shift:($dx,-5)

  bar:Liberaal width:20 color:lib shift:($dx,0)
  from:12/02/1945 till:13/03/1946 color:lib
  from:31/03/1946 till:20/03/1947 color:lib
  from:11/08/1949 till:08/06/1950 color:lib
  from:23/04/1954 till:26/06/1958 color:lib
  from:06/11/1958 till:25/04/1961 color:lib
  from:19/03/1966 till:17/06/1968 color:lib
  from:26/01/1973 till:03/06/1977 color:lib
  from:17/05/1980 till:22/10/1980 color:lib
  from:17/12/1981 till:09/05/1988 color:lib
  from:12/07/1999 till:end color:lib
  at:01/01/1946 text:"liberalen" shift:($dx,-5)
  at:17/06/1967 text:"[[PVV]]/PLP" shift:($dx,-5)
  at:17/06/1980 text:"[[PVV]]/[[PRL]]" shift:($dx,-5)
  at:12/07/1999 text:"[[VLD]]/[[PRL]]" shift:($dx,-5)
  at:11/07/2004 text:"[[VLD]]/[[MR]]" shift:($dx,-5)

  bar:Volks-nationaal width:20 color:nat shift:($dx,0)
  from:03/06/1977 till:23/01/1980 color:nat
  from:09/05/1988 till:29/09/1991 color:nat
  from:12/07/1999 till:11/07/2003 color:nat
  at:03/06/1977 text:"[[VU]]/[[FDF]]" shift:($dx,-20)
  at:03/04/1979 text:"[[FDF]]" shift:($dx,0)
  at:03/06/1988 text:"[[VU]]" shift:($dx,-5)
  at:03/08/1999 text:"[[FDF]]" shift:($dx,-5)

  bar:Groen width:20 color:groen shift:($dx,0)
  from:12/07/1999 till:11/07/2003 color:groen
  at:12/07/1999 text:"[[Agalev]]/[[Ecolo]]" shift:($dx,-5)
| China | top next |

First version by Michiel1972 on Friday, February 25, 2005, last update on Monday, February 6, 2006
ImageSize  = width:750 height:150
PlotArea   = left:80 right:30 top:30 bottom:30
TimeAxis   = orientation:horizontal
DateFormat = yyyy

Period     = from:1811 till:2005
AlignBars  = early
ScaleMajor = unit:year increment:20 start:1850


Colors =
    id:China value:rgb(1,0.7,0.7) # light red
    id:Japans-China value:rgb(1,0.7,0.7) # light red
    id:Taiwan value:rgb(1,0.7,0.7) # light red

Define $dx=-3

PlotData =
  bar:China width:20 color:red shift:($dx,-20)

  from:1811 till:1911  color:yellow
  from:1911 till:1928  color:green
  from:1928 till:1949 color:tan1
  from:1949 till:2000 color:red

  at: 1820 text:" [[Chinese keizerrijk|Laatste eeuw Chinese keizerrijk]]" shift:($dx,-5)
  at: 1908 text:" [[Republiek China (1911-1928) |Rep. China]]" shift:($dx,-5)
  at: 1930 text:" [[Kwomintang-China|Kwomintang]]" shift:($dx,-5)
  at: 1955 text:" [[Volksrepubliek China]]"  shift:($dx,-5)

  bar:Japans-China width:20 color:red shift:($dx,-20)
  from:1937 till:1945  color:orange
  at:1937 text:" [[Japans-China]]" shift:($dx,-5)

  bar:Taiwan width:20 color:red shift:($dx,-20)
  from:1949 till:2005  color:yellowgreen
  at:1950 text:" [[Taiwan]]" shift:($dx,-5)
| Ronde van Frankrijk 2004 | top next |

First version by SanderSpek on Tuesday, August 24, 2004, last update on Tuesday, July 4, 2006
ImageSize  = width:600 height:600
PlotArea   = left:25 right:0 bottom:20 top:10
DateFormat = yyyy
Period     = from:0 till:20
TimeAxis   = orientation:vertical order:reverse
ScaleMajor = gridcolor:white unit:year increment:1 start:0

Colors =
  id:alggeel    value:rgb(1,1,0.4)
  id:bergrood   value:rgb(1,0.5,0.5)
  id:puntgroen  value:rgb(0.7,1,0.5)
  id:lichtgrijs value:rgb(0.95,0.95,0.95)
  id:lichtpaars value:rgb(0.85,0.9,1)

PlotData=

  bar:Algemeen color:alggeel width:110 mark:(line,black) align:center fontsize:S shift:(0,2)
  # shift texts up or down manually to avoid overlap
  from:0  till:2  text:[[Fabian Cancellara]]
  from:2  till:3  text:[[Thor Hushovd]]
  from:3  till:4  text:[[Robbie McEwen]]
  from:4  till:5  text:[[Lance Armstrong]]
  from:5  till:15 text:[[Thomas Voeckler]]
  from:15 till:20 text:[[Lance Armstrong]]

  bar:Puntenklassement color:puntgroen
  # shift texts up or down manually to avoid overlap
  from:0  till:1  text:[[Fabian Cancellara]]
  from:1  till:3  text:[[Thor Hushovd]]
  from:3  till:6  text:[[Robbie McEwen]]
  from:6  till:8  text:[[Stuart O'Grady]]
  from:8  till:20 text:[[Robbie McEwen]]

  bar:Bergklassement color:bergrood
  # shift texts up or down manually to avoid overlap
  from:0  till:1  text:Nog geen~klassement
  from:1  till:10 text:[[Paolo Bettini]]
  from:10 till:20 text:[[Richard Virenque]]

  bar:Jongerenklassement color:lichtgrijs
  # shift texts up or down manually to avoid overlap
  from:0  till:4  text:[[Fabian Cancellara]]
  from:4  till:5  text:[[Matthias Kessler]]
  from:5  till:19 text:[[Thomas Voeckler]]
  from:19 till:20 text:[[Vladimir Karpets]]


  bar:Ploegenklassement color:lichtpaars
  # shift texts up or down manually to avoid overlap
  from:0  till:5  text: US Postal
  from:5  till:14  text: Team CSC
  from:14  till:15  text: T-Mobile
  from:15  till:16  text: Team CSC
  from:16  till:20  text: T-Mobile
| Template:Tijdbalk Tour Winnaars | top next |

First version by Erik Zachte on Sunday, June 27, 2004, last update on Thursday, July 27, 2006
Preset     = TimeVertical_OneBar_UnitYear
ImageSize  = width:220 height:1400
PlotArea   = bottom:220 left:40
Period     = from:1903 till:2007
ScaleMajor = start:1905 increment:5
ScaleMinor = start:1903 increment:1

Colors =
  id:canvas      value:gray(0.9)
  id:Frankrijk   value:rgb(0,0,1)       legend:Frankrijk_(36)
  id:België      value:rgb(1,0,1)       legend:België_(18)
  id:VS          value:rgb(1,1,0)       legend:VS_(10)
  id:Italië      value:rgb(0,0.9,0)     legend:Italië_(9)
  id:Spanje      value:rgb(1,0,0)       legend:Spanje_(8)
  id:Luxemburg   value:rgb(0,0.8,0.8)   legend:Luxemburg_(4)
  id:Nederland   value:rgb(0.7,0.3,0)   legend:Nederland_(2)
  id:Zwitserland value:rgb(0,0,0.6)     legend:Zwitserland_(2)
  id:Denemarken  value:rgb(0.6,0.6,0)   legend:Denemarken_(1)
  id:Duitsland   value:rgb(0,0.6,0)     legend:Duitsland_(1)
  id:Ierland     value:rgb(0.6,0,0)     legend:Ierland_(1)

  id:linemark    value:gray(0.8)
  id:linemark2   value:gray(0.9)

BackgroundColors = canvas:canvas

Legend = orientation:vertical columns:1 top:200 left: 45

PlotData =
  shift:(20,2)
  mark:(line,linemark)
  anchor:from
  # two links in one text are now allowed (yet), so split texts with two links
  # puts the smallest text second, as each clickable area is slightly larger than the text
  # and the small text would otherwise be masked by the larger text and be hardly clickable

  from:1903 till:1904 text:"[[Maurice Garin]]" color:Frankrijk shift:(33)
  from:1903 till:1904 text:"[[Tour de France 1903|1]]" color:Frankrijk

  from:1904 till:1905 text:"2 [[Henri Cornet]]" color:Frankrijk
  from:1905 till:1906 text:"3 [[Louis Trousselier]]" color:Frankrijk
  from:1906 till:1907 text:"4 [[René Polthier]]" color:Frankrijk
  from:1907 till:1908 text:"5 [[Lucien Petit-Breton]]" color:Frankrijk
  from:1908 till:1909 text:"6 Lucien Petit-Breton 2" color:Frankrijk
  from:1909 till:1910 text:"7 [[François Faber]]" color:Luxemburg
  from:1910 till:1911 text:"8 [[Octave Lapize]]" color:Frankrijk
  from:1911 till:1912 text:"9 [[Gustave Garrigou]]" color:Frankrijk
  from:1912 till:1913 text:"10 [[Odile Defraye]]" color:België
  from:1913 till:1914 text:"11 [[Philippe Thys]]" color:België
  from:1914 till:1915 text:"12 Philippe Thys 2" color:België
  from:1919 till:1920 text:"13 [[Firmin Lambot]]" color:België
  from:1920 till:1921 text:"14 Philippe Thys 3" color:België
  from:1921 till:1922 text:"15 [[Léon Scieur]]" color:België
  from:1922 till:1923 text:"16 Firmin Lambot 2" color:België
  from:1923 till:1924 text:"17 [[Henri Pélissier]]" color:Frankrijk
  from:1924 till:1925 text:"18 [[Ottavio Bottecchia]]" color:Italië
  from:1925 till:1926 text:"19 Ottavio Bottecchia 2" color:Italië mark:(line,linemark2)
  from:1926 till:1927 text:"20 [[Lucien Buysse]]" color:België
  from:1927 till:1928 text:"21 [[Nicolas Frantz]]" color:Luxemburg
  from:1928 till:1929 text:"22 Nicolas Frantz 2" color:Luxemburg
  from:1929 till:1930 text:"23 [[Maurice de Waele]]" color:België
  from:1930 till:1931 text:"24 [[André Leducq]]" color:Frankrijk
  from:1931 till:1932 text:"25 [[Antonin Magne]]" color:Frankrijk
  from:1932 till:1933 text:"26 André Leducq 2" color:Frankrijk
  from:1933 till:1934 text:"27 [[Georges Speicher]]" color:Frankrijk
  from:1934 till:1935 text:"28 Antonin Magne 2" color:Frankrijk
  from:1935 till:1936 text:"29 [[Romain Maes]]" color:België
  from:1936 till:1937 text:"30 [[Sylvère Maes]]" color:België
  from:1937 till:1938 text:"31 [[Roger Lapébie]]" color:Frankrijk
  from:1938 till:1939 text:"32 [[Gino Bartali]]" color:Italië
  from:1939 till:1940 text:"33 Sylvère Maes 2" color:België
  from:1947 till:1948 text:"34 [[Jean Robic]]" color:Frankrijk
  from:1948 till:1949 text:"35 Gino Bartali 2" color:Italië
  from:1949 till:1950 text:"36 [[Fausto Coppi]]" color:Italië mark:(line,linemark2)
  from:1950 till:1951 text:"37 [[Ferdinand Kubler]]" color:Zwitserland
  from:1951 till:1952 text:"38 [[Hugo Koblet]]" color:Zwitserland
  from:1952 till:1953 text:"39 Fausto Coppi 2" color:Italië
  from:1953 till:1954 text:"40 [[Louison Bobet]]" color:Frankrijk
  from:1954 till:1955 text:"41 Louison Bobet 2" color:Frankrijk
  from:1955 till:1956 text:"42 Louison Bobet 3" color:Frankrijk
  from:1956 till:1957 text:"43 [[Roger Walkowiak]]" color:Frankrijk
  from:1957 till:1958 text:"44 [[Jacques Anquetil]]" color:Frankrijk
  from:1958 till:1959 text:"45 [[Charly Gaul]]" color:Luxemburg
  from:1959 till:1960 text:"46 [[Federico Bahamontes]]" color:Spanje
  from:1960 till:1961 text:"47 [[Gastone Nencini]]" color:Italië
  from:1961 till:1962 text:"48 Jacques Anquetil 2" color:Frankrijk
  from:1962 till:1963 text:"49 Jacques Anquetil 3" color:Frankrijk
  from:1963 till:1964 text:"50 Jacques Anquetil 4" color:Frankrijk
  from:1964 till:1965 text:"51 Jacques Anquetil 5" color:Frankrijk
  from:1965 till:1966 text:"52 [[Felice Gimondi]]" color:Italië
  from:1966 till:1967 text:"53 [[Lucien Aimar]]" color:Frankrijk
  from:1967 till:1968 text:"54 [[Roger Pingeon]]" color:Frankrijk
  from:1968 till:1969 text:"55 [[Jan Janssen]]" color:Nederland
  from:1969 till:1970 text:"56 [[Eddy Merckx]]" color:België
  from:1970 till:1971 text:"57 Eddy Merckx 2" color:België
  from:1971 till:1972 text:"58 Eddy Merckx 3" color:België
  from:1972 till:1973 text:"59 Eddy Merckx 4" color:België
  from:1973 till:1974 text:"60 [[Luis Ocaña]]" color:Spanje
  from:1974 till:1975 text:"61 Eddy Merckx 5" color:België
  from:1975 till:1976 text:"62 [[Bernard Thévenet]]" color:Frankrijk
  from:1976 till:1977 text:"63 [[Lucien Van Impe]]" color:België
  from:1977 till:1978 text:"64 Bernard Thévenet 2" color:Frankrijk
  from:1978 till:1979 text:"65 [[Bernard Hinault]]" color:Frankrijk
  from:1979 till:1980 text:"66 Bernard Hinault 2" color:Frankrijk
  from:1980 till:1981 text:"67 [[Joop Zoetemelk]]" color:Nederland
  from:1981 till:1982 text:"68 Bernard Hinault 3" color:Frankrijk
  from:1982 till:1983 text:"69 Bernard Hinault 4" color:Frankrijk
  from:1983 till:1984 text:"70 [[Laurent Fignon]]" color:Frankrijk
  from:1984 till:1985 text:"71 Laurent Fignon 2" color:Frankrijk
  from:1985 till:1986 text:"72 Bernard Hinault 5" color:Frankrijk
  from:1986 till:1987 text:"73 [[Greg LeMond]]" color:VS
  from:1987 till:1988 text:"74 [[Stephen Roche]]" color:Ierland
  from:1988 till:1989 text:"75 [[Pedro Delgado]]" color:Spanje
  from:1989 till:1990 text:"76 Greg LeMond 2" color:VS
  from:1990 till:1991 text:"77 Greg LeMond 3" color:VS
  from:1991 till:1992 text:"78 [[Miguel Induráin]]" color:Spanje
  from:1992 till:1993 text:"79 Miguel Induráin 2" color:Spanje
  from:1993 till:1994 text:"80 Miguel Induráin 3" color:Spanje
  from:1994 till:1995 text:"81 Miguel Induráin 4" color:Spanje
  from:1995 till:1996 text:"82 Miguel Induráin 5" color:Spanje
  from:1996 till:1997 text:"83 [[Bjarne Riis]]" color:Denemarken
  from:1997 till:1998 text:"84 [[Jan Ullrich]]" color:Duitsland
  from:1998 till:1999 text:"85 [[Marco Pantani]]" color:Italië
  from:1999 till:2000 text:"86 [[Lance Armstrong]]" color:VS
  from:2000 till:2001 text:"[[Ronde van Frankrijk 2000|87]] Lance Armstrong 2" color:VS
  from:2001 till:2002 text:"[[Ronde van Frankrijk 2001|88]] Lance Armstrong 3" color:VS
  from:2002 till:2003 text:"[[Ronde van Frankrijk 2002|89]] Lance Armstrong 4" color:VS
  from:2003 till:2004 text:"[[Ronde van Frankrijk 2003|90]] Lance Armstrong 5" color:VS
  from:2004 till:2005 text:"[[Ronde van Frankrijk 2004|91]] Lance Armstrong 6" color:VS
  from:2005 till:2006 text:"[[Ronde van Frankrijk 2005|92]] Lance Armstrong 7" color:VS
  from:2006 till:2007 text:"93 [[Floyd Landis]]" color:VS
| Ronde van Frankrijk 2001 | top next |

Initial version by Friesland 1 on Wednesday, July 13, 2005
ImageSize  = width:480 height:600
PlotArea   = left:25 right:0 bottom:20 top:10
DateFormat = yyyy
Period     = from:0 till:20
TimeAxis   = orientation:vertical order:reverse
ScaleMajor = gridcolor:white unit:year increment:1 start:0

Colors =
  id:alggeel    value:rgb(1,1,0.4)
  id:bergrood   value:rgb(1,0.5,0.5)
  id:puntgroen  value:rgb(0.7,1,0.5)
  id:lichtgrijs value:rgb(0.95,0.95,0.95)

PlotData=

  bar:Algemeen color:alggeel width:110 mark:(line,black) align:center fontsize:S shift:(0,2)
  # shift texts up or down manually to avoid overlap
  from:0  till:2  text:[[Christophe Moreau]]
  from:2  till:3  text:[[Marc Wauters]]
  from:3  till:7  text:[[Stuart O'Grady]]
  from:7  till:8  text:[[Jens Voigt]]
  from:8  till:10 text:[[Stuart O'Grady]]
  from:10  till:13 text:[[François Simon]]
  from:13  till:20 text:[[Lance Armstrong]]

  bar:Puntenklassement color:puntgroen
  # shift texts up or down manually to avoid overlap
  from:0  till:1  text:[[Christophe Moreau]]
  from:1  till:2  text:[[Erik Zabel]]
  from:2  till:3  text:[[Jaan Kirsipuu]]
  from:3  till:7  text:[[Erik Zabel]]
  from:7  till:19 text:[[Stuart O'Grady]]
  from:19  till:20  text:[[Erik Zabel]]

  bar:Bergklassement color:bergrood
  # shift texts up or down manually to avoid overlap
  from:0  till:1  text:Nog geen~klassement
  from:1  till:3 text:[[Jacky Durand]]
  from:3  till:4  text:[[Benoit Salmon]]
  from:4  till:9 text:[[Patrice Halgand]]
  from:9 till:13 text:[[Laurent Roux]]
  from:13 till:20 text:[[Laurent Jalabert]]

  bar:Jongerenklassement color:lichtgrijs
  # shift texts up or down manually to avoid overlap
  from:0  till:2  text:[[Florent Brard]]
  from:2  till:3  text:[[Robert Hunter]]
  from:3  till:5 text:[[Florent Brard]]
  from:5 till:10 text:[[Jörg Jaksche]]
  from:10 till:20 text:[[Oscar Sevilla]]
| Lijst van presidenten van Turkije | top next |

Initial version by SanderSpek on Monday, September 6, 2004
# All measures all in pixels

ImageSize  = width:150 height:550
PlotArea   = left:50 right:0 bottom:10 top:10
AlignBars  = early

DateFormat = yyyy
Period     = from:1920 till:2005
TimeAxis   = orientation:vertical
ScaleMajor = unit:year increment:5 start:1920

# there is no automatic collision detection,
# so shift texts up or down manually to avoid overlap

Define $dx = 25 # shift text to right side of bar

PlotData=
  bar:Leaders color:red width:25 mark:(line,white) align:left fontsize:S

  from:start till:1938 shift:($dx,5)   text:Atatürk
  from:1938  till:1950 shift:($dx,5)   text:Inönü
  from:1950  till:1960 shift:($dx,5)   text:Bayar
  from:1960  till:1961 shift:($dx,0) color:yellow  text:Gürsel
  from:1961  till:1966 shift:($dx,0)   text:Sunay
  from:1966  till:1971 shift:($dx,0)   text:Gürsel
  from:1971  till:1972 shift:($dx,0) color:yellow text:Areburun
  from:1972  till:1980 shift:($dx,0)   text:Koruturk
  from:1980  till:1982 shift:($dx,0) color:yellow text:Evren
  from:1982  till:1989 shift:($dx,0)   text:Evren
  from:1989  till:1993 shift:($dx,0)   text:Ozal
  from:1993  till:2000 shift:($dx,0)   text:Demirel
  from:2000  till:end  shift:($dx,0)   text:Sezer
| Lembeke | top next |

Initial version by Zonneschijn on Monday, July 31, 2006
Colors=
  id:a value:gray(0.9)
  id:b value:gray(0.7)
  id:c value:rgb(1,1,1)
  id:d value:rgb(0.6,0.7,0.8)

ImageSize  = width:700 height:373
PlotArea   = left:50 bottom:30 top:30 right:30
DateFormat = x.y
Period     = from:0 till:4000
TimeAxis   = orientation:vertical
AlignBars  = justify
ScaleMajor = gridcolor:b increment:500 start:0
ScaleMinor = gridcolor:a increment:100 start:0
BackgroundColors = canvas:c

BarData=
  bar:1806 text:1806
  bar:1816 text:1816
  bar:1830 text:1830
  bar:1846 text:1846
  bar:1856 text:1856
  bar:1866 text:1866
  bar:1876 text:1876
  bar:1880 text:1880
  bar:1890 text:1890
  bar:1900 text:1900
  bar:1910 text:1910
  bar:1920 text:1920
  bar:1930 text:1930
  bar:1947 text:1947
  bar:1961 text:1961
  bar:1970 text:1970
  bar:1976 text:1976
  bar:1981 text:1981
  bar:1991 text:1991
  bar:2002 text:2002

PlotData=
  color:d width:20 align:left

  bar:1806 from:0 till: 2582
  bar:1816 from:0 till: 2806
  bar:1830 from:0 till: 3199
  bar:1846 from:0 till: 3053
  bar:1856 from:0 till: 2721
  bar:1866 from:0 till: 2609
  bar:1876 from:0 till: 2785
  bar:1880 from:0 till: 2869
  bar:1890 from:0 till: 2816
  bar:1900 from:0 till: 3007
  bar:1910 from:0 till: 2896
  bar:1920 from:0 till: 2752
  bar:1930 from:0 till: 2781
  bar:1947 from:0 till: 2783
  bar:1961 from:0 till: 2982
  bar:1970 from:0 till: 2935
  bar:1976 from:0 till: 3097
  bar:1981 from:0 till: 3221
  bar:1991 from:0 till: 3508
  bar:2002 from:0 till: 3496

PlotData=

  bar:1806 at: 2582 fontsize:s text: 2.582 shift:(-10,5)
  bar:1816 at: 2806 fontsize:S text: 2.806 shift:(-10,5)
  bar:1830 at: 3199 fontsize:S text: 3.199 shift:(-10,5)
  bar:1846 at: 3053 fontsize:S text: 3.053 shift:(-10,5)
  bar:1856 at: 2721 fontsize:S text: 2.721 shift:(-10,5)
  bar:1866 at: 2609 fontsize:S text: 2.609 shift:(-10,5)
  bar:1876 at: 2785 fontsize:S text: 2.785 shift:(-10,5)
  bar:1880 at: 2869 fontsize:S text: 2.869 shift:(-10,5)
  bar:1890 at: 2816 fontsize:S text: 2.816 shift:(-10,5)
  bar:1900 at: 3007 fontsize:S text: 3.007 shift:(-10,5)
  bar:1910 at: 2896 fontsize:S text: 2.896 shift:(-10,5)
  bar:1920 at: 2752 fontsize:S text: 2.752 shift:(-10,5)
  bar:1930 at: 2781 fontsize:S text: 2.781 shift:(-10,5)
  bar:1947 at: 2783 fontsize:S text: 2.783 shift:(-10,5)
  bar:1961 at: 2982 fontsize:S text: 2.982 shift:(-10,5)
  bar:1970 at: 2935 fontsize:S text: 2.935 shift:(-10,5)
  bar:1976 at: 3097 fontsize:S text: 3.097 shift:(-10,5)
  bar:1981 at: 3221 fontsize:S text: 3.221 shift:(-10,5)
  bar:1991 at: 3508 fontsize:S text: 3.508 shift:(-10,5)
  bar:2002 at: 3496 fontsize:S text: 3.496 shift:(-10,5)
| Shoegaze | top next |

First version by 213.118.206.86 on Saturday, September 18, 2004, last update on Wednesday, May 11, 2005
TimeAxis = orientation:horizontal format:yyyy
ImageSize = width:850 height:400
PlotArea = width:800 height:300 bottom:20 left:20

Colors =
  id:canvas value:rgb(0.97,0.97,0.97)
  id:grid1  value:rgb(0.86,0.86,0.86)
  id:grid2  value:gray(0.8)
  id:bars   value:rgb(0.96,0.96,0.6)

BackgroundColors = canvas:canvas

Period     = from:1983 till:2004
ScaleMajor = unit:year increment:1 start:1983 gridcolor:grid1

BarData=
  barset:Bands

LineData =
  at:1985 color:grid2 layer:back
  at:1991 color:grid2 layer:back

PlotData=

# set defaults
  width:25 fontsize:L textcolor:black align:left anchor:from shift:(10,-4) color:bars

  barset:Bands


    at:1985 text:1985: Psychocandy van JAMC
  from:1984 till:1994 text: "My Bloody Valentine"
    at:1991 text:1991: "Loveless" van MBV
  from:1986 till:1991 text: "Galaxie 500"
  from:1987 till:1994 text: "Chapterhouse"
  from:1988 till:1996 text: "Ride"
  from:1988 till:1998 text: "Lush
  from:1988 till:1999 text: "The Boo Radleys"
  from:1989 till:1999 text: "The Verve"
  from:1989 till:1995 text: "Slowdive"
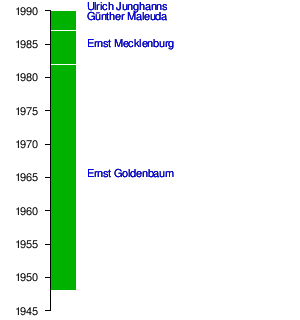
| Demokratische Bauernpartei Deutschlands | top next |
Initial version by Nicklaarakkers on Friday, January 6, 2006
ImageSize  = width:300 height:320
PlotArea   = width:250 height:300 left:50 bottom:10

DateFormat = yyyy
Period     = from:1945 till:1990
TimeAxis   = orientation:vertical
ScaleMajor = unit:year increment:5 start:1945

Define $dx = 25

PlotData=
  bar:Leaders color:green width:25 mark:(line,white) align:left fontsize:S

  from:1948  till:1982 shift:($dx,0)   text:[[Ernst Goldenbaum]]
  from:1982  till:1987 shift:($dx,0)   text:[[Ernst Mecklenburg]]
  from:1987  till:1990 shift:($dx,0)   text:[[Günther Maleuda]]
  from:1990  till:1990 shift:($dx,0)   text:[[Ulrich Junghanns]]
| Liberaldemokratische Partei Deutschlands | top next |

Initial version by Nicklaarakkers on Friday, January 6, 2006
ImageSize  = width:300 height:320
PlotArea   = width:250 height:300 left:50 bottom:10

DateFormat = yyyy
Period     = from:1945 till:1990
TimeAxis   = orientation:vertical
ScaleMajor = unit:year increment:5 start:1945

Define $dx = 25

PlotData=
  bar:Leaders color:green width:25 mark:(line,white) align:left fontsize:S

  from:1945  till:1945 shift:($dx,0)   text:[[Waldemar Koch]]
  from:1945  till:1948 shift:($dx,0)   text:[[Wilhelm Külz]]
  from:1948  till:1948 shift:($dx,0)   text:[[Arthur Lieutenant]]
  from:1948  till:1952 shift:($dx,0)   text:[[Karl Hamann]]/[[Hermann Kastner]] (tot 1950)
  from:1952  till:1960 shift:($dx,0)   text:[[Hans Loch]]
  from:1960  till:1967 shift:($dx,0)   text:[[Max Suhrbier]]
  from:1967  till:1990 shift:($dx,0)   text:[[Manfred Gerlach]]
  from:1990  till:1990 shift:($dx,0)   text:[[Rainer Ortleb]]
| Nationaldemokratische Partei Deutschlands (DDR) | top next |

Initial version by Nicklaarakkers on Friday, January 6, 2006
ImageSize  = width:300 height:320
PlotArea   = width:250 height:300 left:50 bottom:10

DateFormat = yyyy
Period     = from:1945 till:1991
TimeAxis   = orientation:vertical
ScaleMajor = unit:year increment:5 start:1945

Define $dx = 25

PlotData=
  bar:Leaders color:yellow width:25 mark:(line,white) align:left fontsize:S

  from:1948  till:1972 shift:($dx,0)   text:[[Lothar Bolz]]
  from:1972  till:1989 shift:($dx,0)   text:[[Heinrich Homann]]
  from:1989  till:1990 shift:($dx,0)   text:[[Günter Hartmann]]
  from:1991  till:1991 shift:($dx,0)   text:[[Wolfgang Glaeser]]; [[Wolfgang Rauls]]
| Bondskanselier (Duitsland) | top next |

First version by Wdelaet on Monday, October 31, 2005, last update on Monday, February 6, 2006
ImageSize	= width:250 height:400
PlotArea	= left:40 right:0 bottom:80 top:20
Legend		= columns:3 left:40 top:60 columnwidth:50

DateFormat	= dd/mm/yyyy
Period		= from:15/09/1949 till:06/02/2006
TimeAxis	= orientation:vertical format:yyyy

ScaleMajor	= unit:year increment:5 start:1950

Colors=
 id:CDU	value:black	legend:CDU
 id:CSU value:blue  legend:CSU
 id:SPD value:red	legend:SPD

PlotData=
 bar:Kanselier color:CDU width:20 fontsize:M align:left shift:(20,-5) mark:(line,white)

 from:start till:16/10/1963 text:[[Konrad_Adenauer]] color:CDU
 from:16/10/1963 till:01/12/1966 text:[[Ludwig_Erhardt]] color:CDU
 from:01/12/1966 till:21/10/1969 text:[[Kurt_Georg_Kiesinger]] color:CDU
 from:21/10/1969 till:07/05/1974 text:[[Willy_Brandt]] color:SPD
 from:16/05/1974 till:01/10/1982 text:[[Helmut_Schmidt]] color:SPD
 from:01/10/1982 till:27/10/1998 text:[[Helmut_Kohl]] color:CDU
 from:27/10/1998 till:22/11/2005 text:[[Gerhard_Schröder]] color:SPD
 from:22/11/2005 till:end text:[[Angela_Merkel]] color:CDU
| Sloveense Democratische Partij | top next |

Initial version by Besednjak on Thursday, June 2, 2005
ImageSize  = width:350 height:120
PlotArea   = width:250 height:80 left:50 bottom:20
AlignBars  = justify

DateFormat = yyyy
Period     = from:0 till:32
TimeAxis   = orientation:vertical
ScaleMajor = unit:year increment:4 start:0

PlotData=
  bar:Zetels color:claret width:30   mark:(line,white) align:left fontsize:S
  bar:1990 from:start till:6 text:6
  bar:1992 from:start till:4 text:4
  bar:1996 color:pink from:start till:16 text:16
  bar:2000 color:pink from:start till:14 text:14
  bar:2004 color:skyblue from:start till:29 text:29
| Liberale Democratie van Slovenië | top next |

Initial version by Besednjak on Thursday, June 2, 2005
ImageSize  = width:350 height:120
PlotArea   = width:250 height:80 left:50 bottom:20
AlignBars  = justify

DateFormat = yyyy
Period     = from:0 till:40
TimeAxis   = orientation:vertical
ScaleMajor = unit:year increment:4 start:0

PlotData=
  bar:Zetels color:powderblue width:30   mark:(line,white) align:left fontsize:S
  bar:1990 color: oceanblue from:start till:12 text:12
  bar:1992 from:start till:22 text:22
  bar:1992 from:22 till:28 text:6 DP
  bar:1992 from:28 till:33 text:5 Groenen
  bar:1996 from:start till:25 text:25
  bar:2000 from:start till:34 text:34
  bar:2004 from:start till:23 text:23
| Democratische Partij van Gepensioneerden van Slovenië | top next |

Initial version by Besednjak on Thursday, June 2, 2005
ImageSize  = width:350 height:120
PlotArea   = width:250 height:80 left:50 bottom:20
AlignBars  = justify

DateFormat = yyyy
Period     = from:0 till:8
TimeAxis   = orientation:vertical
ScaleMajor = unit:year increment:1 start:0

PlotData=
  bar:Zetels color:green width:30   mark:(line,white) align:left fontsize:S
  bar:1990 from:start till:0 text:0
  bar:1992 from:start till:1 text:1
  bar:1996 from:start till:5 text:5
  bar:2000 from:start till:4 text:4
  bar:2004 from:start till:4 text:4
| Sloveense Volkspartij | top next |

Initial version by Besednjak on Thursday, June 2, 2005
ImageSize  = width:350 height:120
PlotArea   = width:250 height:80 left:50 bottom:20
AlignBars  = justify

DateFormat = yyyy
Period     = from:0 till:21
TimeAxis   = orientation:vertical
ScaleMajor = unit:year increment:3 start:0

PlotData=
  bar:Zetels color:kelleygreen width:30   mark:(line,white) align:left fontsize:S
  bar:1990 from:start till:11 text:11
  bar:1992 from:start till:10 text:10
  bar:1996 from:start till:19 text:19
  bar:2000 from:start till:9 text:9
  bar:2000 color:teal from:9 till:17 text:8 NSi
  bar:2004 from:start till:7 text:7
| Sloveense Nationale Partij | top next |

Initial version by Besednjak on Thursday, June 2, 2005
ImageSize  = width:350 height:120
PlotArea   = width:250 height:80 left:50 bottom:20
AlignBars  = justify

DateFormat = yyyy
Period     = from:0 till:10
TimeAxis   = orientation:vertical
ScaleMajor = unit:year increment:1 start:0

PlotData=
  bar:Zetels color:yelloworange width:30   mark:(line,white) align:left fontsize:S
  bar:1990 from:start till:0 text:0
  bar:1992 from:start till:4 text:4
  bar:1996 from:start till:4 text:4
  bar:2000 from:start till:4 text:4
  bar:2004 from:start till:6 text:6
| Nieuw Slovenië | top next |

Initial version by Besednjak on Monday, June 6, 2005
ImageSize  = width:350 height:120
PlotArea   = width:250 height:80 left:50 bottom:20
AlignBars  = justify

DateFormat = yyyy
Period     = from:0 till:20
TimeAxis   = orientation:vertical
ScaleMajor = unit:year increment:4 start:0

PlotData=
  bar:Zetels color:teal width:30   mark:(line,white) align:left fontsize:S
  bar:1990 color:green from:start till:11 text:11
  bar:1992 color:green from:start till:15 text:15
  bar:1996 color:green from:start till:10 text:10
  bar:2000 color:kelleygreen from:start till:9 text:9
  bar:2000 from:9 till:17 text:8
  bar:2004 from:start till:9 text:9
| Sociaal-Democraten (Slovenië) | top next |

Initial version by Besednjak on Thursday, June 2, 2005
ImageSize  = width:350 height:120
PlotArea   = width:250 height:80 left:50 bottom:20
AlignBars  = justify

DateFormat = yyyy
Period     = from:0 till:18
TimeAxis   = orientation:vertical
ScaleMajor = unit:year increment:2 start:0

PlotData=
  bar:Zetels color:coral width:30   mark:(line,white) align:left fontsize:S
  bar:1990 color: magenta from:start till:14 text:14
  bar:1992 from:start till:14 text:14
  bar:1996 from:start till:9 text:9
  bar:2000 from:start till:11 text:11
  bar:2004 from:start till:10 text:10
| Socialistische Partij van Slovenië | top next |

Initial version by Besednjak on Monday, June 6, 2005
ImageSize  = width:350 height:120
PlotArea   = width:250 height:80 left:50 bottom:20
AlignBars  = early

DateFormat = yyyy
Period     = from:0 till:20
TimeAxis   = orientation:vertical
ScaleMajor = unit:year increment:5 start:0

PlotData=
  bar:Percentage color:red width:30   mark:(line,white) align:left fontsize:S
  bar:1990 from:start till:5 text:5
  bar:1992 from:start till:0 text:0
| Socialistische Bond van het Arbeidende Volk | top next |

Initial version by Besednjak on Saturday, May 28, 2005
ImageSize  = width:950 height:220
PlotArea   = left:0 right:40 top:30 bottom:30
TimeAxis   = orientation:horizontal
DateFormat = yyyy

Period     = from:1941 till:2005
AlignBars  = early
ScaleMajor = unit:year increment:3 start:1941


Colors =
    id:Sloveens_Bevrijdingsfront value:rgb(1,0.7,0.7) # light red
    id:Socialistische_Bond_van_het_Arbeidende_Volk value:rgb(1,0.7,0.7) # light red
    id:Socialistische_Partij_van_Slovenië value:rgb(1,0.7,0.7) # light red
    id:Liberale_Democratie_van_Slovenië value:rgb(1,0.7,0.7) # red


Define $dx=-3

PlotData =

  bar:Sloveense_Bevrijdingsfront width:20 color:red shift:($dx,-20)
  from:1941 till:1945  color:orange
  from:1945 till:1953  color:red
  at:1941 text:" [[Sloveens Bevrijdingsfront|Sloveense Bevrijdingsfront]]" shift:($dx,-5)
  at:1945 text:" [[Sloveens Bevrijdingsfront| ]]" shift:($dx,-5)

  bar:Socialistische_Bond_van_het_Arbeidende_Volk width:20 color:red shift:($dx,-20)
  from:1953 till:1989  color:red
  at:1953 text:" [[Socialistische Bond van het Arbeidende Volk]]" shift:($dx,-5)

  bar:Socialistische_Partij_van_Slovenië width:20 color:red shift:($dx,-20)
  from:1989 till:1994  color:redorange
  at:1989 text:" [[Socialistische Partij van Slovenië]]" shift:($dx,-5)

  bar:Liberale_Democratie_van_Slovenië width:20 color:red shift:($dx,-20)
  from:1994 till:2005  color:green
  at:1994 text:" [[Liberale Democratie van Slovenië|LDS]]" shift:($dx,-5)
| Tijdloze 100 | top next |

First version by 81.241.163.73 on Sunday, November 6, 2005, last update on Wednesday, June 7, 2006
ImageSize  = width:600 height:600
PlotArea   = left:25 right:50 bottom:20 top:10
DateFormat = yyyy
Period     = from:1987 till:2006
TimeAxis   = orientation:vertical order:reverse
ScaleMajor = gridcolor:white unit:year increment:1 start:1987

Colors =
  id:eengeel    value:rgb(1,1,0.4)
  id:tweerood   value:rgb(1,0.5,0.5)

PlotData=

  bar:Nr.1 color:eengeel width:110 mark:(line,black) align:center fontsize:S shift:(0,2)
  # shift texts up or down manually to avoid overlap
  from:1987  till:1988  text:Deep Purple - Child in Time
  from:1988  till:1989  text:Rolling Stones - Angie
  from:1989  till:1990  text:Geen Tijdloze
  from:1990  till:1991  text:Deep Purple - Child in Time
  from:1991  till:1993  text:Rolling Stones - Angie
  from:1993  till:1995  text:Deep Purple - Child in Time
  from:1995  till:1996  text:Rolling Stones - Angie
  from:1996  till:1999  text:Deep Purple - Child in Time
  from:1999  till:2003  text:Nirvana - Smells like Teen Spirit
  from:2003  till:2006  text:Gorky - Mia


  bar:Nr.2 color:tweerood
  # shift texts up or down manually to avoid overlap
  from:1987  till:1988  text:Rolling Stones - Angie
  from:1988  till:1989  text:Deep Purple - Child in Time
  from:1989  till:1990  text:Geen Tijdloze
  from:1990  till:1991  text:Rolling Stones - Angie
  from:1991  till:1993  text:Deep Purple - Child in Time
  from:1993  till:1995  text:Rolling Stones - Angie
  from:1995  till:1996  text:Deep Purple - Child in Time
  from:1996  till:1998  text:Rolling Stones - Angie
  from:1998  till:1999  text:Nirvana (band)|Nirvana - Smells like Teen Spirit
  from:1999  till:2001  text:Deep Purple - Child in Time
  from:2001  till:2003  text:Gorky - Mia
  from:2003  till:2006  text:Nirvana - Smells like Teen Spirit
| Westers Schisma | top next |

Initial version by Riki on Sunday, April 2, 2006
ImageSize = width:600 height:200
PlotArea = width:460 height:109 left:80 bottom:71
AlignBars = justify

Colors =
  id:avignon value:rgb(0.6,1,1) legend:Avignon
  id:rome value:rgb(0.6,1,0.6) legend:Rome
  id:pisan value:rgb(1,1,0.6) legend:Pisa
  id:black value:black

Period = from:1378 till:1418
TimeAxis = orientation:horizontal
ScaleMajor = unit:year increment:10 start:1378
ScaleMinor = unit:year increment:1 start:1378

BarData =
  bar:title text:
  bar:Avignon text:
  bar:Rome text:
  bar:Pisan text:

PlotData =
  bar:title from:start till:end text:"Pausen onder het Westers Schisma" align:center width:15 color:white fontsize:XL

  align:center textcolor:black fontsize:S mark:(line,black) width:25 shift:(0,-5)


  bar:Avignon color:avignon
  from:1378.7 till:1394.7 text:[[Tegenpaus Clemens VII|Clemens VII]]
  from:1394.7 till:1417.6 text:[[Tegenpaus Benedictus XIII|Benedictus XIII]]

  bar:Rome color:rome
  from:1378.3 till:1389.8 text:[[Paus Urbanus VI|Urbanus VI]]
  from:1389.8 till:1404.8 text:[[Paus Bonifatius IX|Bonifatius IX]]
  from:1404.8 till:1406.9 text:"[[Paus Innocentius VII|Innocentius]]~[[Paus Innocentius VII|VII]]" shift:(0,1)
  from:1406.9 till:1415.5 text:"[[Paus Gregorius XII|Gregorius XII]]" shift:(2,-5)

  bar:Pisan color:pisan
  from:1409.5 till:1410.3 text:"[[Paus Alexander V|Alexander V]]" shift:(-31,-5)
  from:1410.3 till:1415.5 text:"[[Tegenpaus Johannes XXIII|Johannes]]~[[Tegenpaus Johannes XXIII|XXIII]]" shift:(0,1)

TextData =
  fontsize:8
  pos:(10,107) text:"[[Paus Gregorius XI|Gregorius XI]]"
  pos:(545,107) text:"[[Paus Martinus V|Martinus V]]"

Legend = orientation:horizontal position:bottom
| Jongerenpartij van Slovenië | top next |

Initial version by Besednjak on Thursday, June 2, 2005
ImageSize  = width:350 height:120
PlotArea   = width:250 height:80 left:50 bottom:20
AlignBars  = justify

DateFormat = yyyy
Period     = from:0 till:8
TimeAxis   = orientation:vertical
ScaleMajor = unit:year increment:1 start:0

PlotData=
  bar:Percentage color:yellow width:30   mark:(line,white) align:left fontsize:S
  bar:1990 from:start till:0 text:0
  bar:1992 from:start till:0 text:0
  bar:1996 from:start till:0 text:0
  bar:2000 from:start till:4 text:4
  bar:2004 from:start till:0 text:0
| Sociaal-Democratische Partij van Slovenië | top next |
Initial version by Besednjak on Thursday, June 2, 2005
ImageSize  = width:350 height:120
PlotArea   = width:250 height:80 left:50 bottom:20
AlignBars  = justify

DateFormat = yyyy
Period     = from:0 till:32
TimeAxis   = orientation:vertical
ScaleMajor = unit:year increment:4 start:0

PlotData=
  bar:Zetels color:claret width:30   mark:(line,white) align:left fontsize:S
  bar:1990 from:start till:6 text:6
  bar:1992 from:start till:4 text:4
  bar:1996 color:pink from:start till:16 text:16
  bar:2000 color:pink from:start till:14 text:14
  bar:2004 color:skyblue from:start till:29 text:29
| Geschiedenis van het internet in Nederland | top next |

First version by SanderSpek on Thursday, February 17, 2005, last update on Monday, July 18, 2005
# All measures all in pixels

ImageSize  = width:270 height:350
PlotArea   = left:35 right:0 bottom:10 top:10
AlignBars  = early

DateFormat = yyyy
Period     = from:1975 till:2000
TimeAxis   = orientation:vertical
ScaleMajor = unit:year increment:5 start:1975

# there is no automatic collision detection,
# so shift texts up or down manually to avoid overlap

Define $dx = 20 # shift text to right side of bar

PlotData=
  bar:Leaders color:red width:25 mark:(line,black) align:left fontsize:XS

   at:1979 shift:($dx,0) text:"Usenet en BBS zien het licht"
   at:1989 shift:($dx,-10) text:"Internet toegankelijk voor academici"
   at:1989 shift:($dx,0) text:"Pine e-mail voor UNIX geïntroduceerd"
   at:1993 shift:($dx,-28) text:"Pine e-mail voor DOS geïntroduceerd"
   at:1993 shift:($dx,-18) text:"NCSA Mosaic browser voor UNIX geïntroduceerd"
   at:1993 shift:($dx,-8) text:"XS4ALL eerste ISP voor het publiek"
   at:1993 shift:($dx,3) text:"NCSA Mosaic browser voor Windows geïntroduceerd"
   at:1994 shift:($dx,5) text:"DSA open met e-mailpostbus"
   at:1994 shift:($dx,15) text:"Bart Internet Services 3e ISP"
| Winteroorlog | top next |

Initial version by Nicklaarakkers on Thursday, December 29, 2005
#
# Tijdlijn Zuiderzeewerken
#
ImageSize  = width:750 height:120
PlotArea   = left:75 bottom:20 width:600 height:50
AlignBars  = early

DateFormat = yyyy
Period     = from:1917 till:2005
TimeAxis   = orientation:horizontal
ScaleMajor = unit:year increment:10 start:1917

Colors =
  id:grey  value:gray(0.7)

PlotData=
  bar:Leaders color:red width:25 mark:(line,grey) align:left fontsize:S shift:(0,-40)
  from:1917 till:1939 color:red
  from:1939 till:1940 color:green
  from:1940 till:2005 color:red

  shift:(-10,20)
  at:1917 mark:(line,blue) text:1917 Onafhankelijkheid
  shift:(-10,42) textcolor:black
  at:1918 mark:(line,white) text:1918 Burgeroorlog
  shift:(-10,64)
  at:1919 mark:(line,white) text:1919 Rep. Finland
  shift:(-10,20)
  at:1939 mark:(line,white) text:1939-1940 Winteroorlog
  shift:(-10,42)
  at:1941 mark:(line,white) text:1941-1944 Vervolgoorlog
  shift:(-10,64)
  at:1948 mark:(line,white) text:1948 YYA-verdrag
  shift:(-11,20)
  at:1956 mark:(line, white) text:1956-1982 Periode Kekkonen
  shift:(-11,20)
  at:1995 mark:(line, white) text:1995 Lid EU
| Ronde van Frankrijk 1999 | top next |

Initial version by Ckoelma on Friday, November 18, 2005
ImageSize  = width:600 height:600
PlotArea   = left:25 right:0 bottom:20 top:10
DateFormat = yyyy
Period     = from:0 till:20
TimeAxis   = orientation:vertical order:reverse
ScaleMajor = gridcolor:white unit:year increment:1 start:0

Colors =
  id:alggeel    value:rgb(1,1,0.4)
  id:bergrood   value:rgb(1,0.5,0.5)
  id:puntgroen  value:rgb(0.7,1,0.5)
  id:lichtgrijs value:rgb(0.95,0.95,0.95)
  id:lichtpaars value:rgb(0.85,0.9,1)

PlotData=

  bar:Algemeen color:alggeel width:110 mark:(line,black) align:center fontsize:S shift:(0,2)
  # shift texts up or down manually to avoid overlap
  from:0  till:1  text:[[Lance Armstrong]]
  from:1  till:7  text:[[Jaan Kirsipuu]]
  from:7  till:20  text:[[Lance Armstrong]]

  bar:Puntenklassement color:puntgroen
  # shift texts up or down manually to avoid overlap
  from:0  till:1  text:[[Lance Armstrong]]
  from:1  till:2  text:[[Jaan Kirsipuu]]
  from:2  till:5  text:[[Tom Steels]]
  from:5  till:6  text:[[Erik Zabel]]
  from:6  till:7  text:[[Mario Cipollini]]
  from:7  till:8  text:[[Jaan Kirsipuu]]
  from:8  till:11  text:[[Stuart O'Grady]]
  from:11  till:20  text:[[Erik Zabel]]

  bar:Bergklassement color:bergrood
  # shift texts up or down manually to avoid overlap
  from:0  till:8  text:[[Mariano Piccoli]]
  from:8  till:20  text:[[Richard Virenque]]

  bar:Jongerenklassement color:lichtgrijs
  # shift texts up or down manually to avoid overlap
  from:0  till:1  text:[[Rik Verbrugghe]]
  from:1  till:7  text:[[Christian Vandevelde]]
  from:7  till:8  text:[[Magnus Backstedt]]
  from:8  till:20  text:[[Benoit Salmon]]

  bar:Ploegenklassement color:lichtpaars
  # shift texts up or down manually to avoid overlap
  from:0  till:20  text:w.i.u.
| Template:Leiders Sovjet-Unie | top next |

First version by Rex on Friday, March 25, 2005, last update on Monday, October 24, 2005
ImageSize  = width:550 height:150
PlotArea   = width:530 height:40 left:10 bottom:30

DateFormat = yyyy
Period     = from:1919 till:1991
TimeAxis   = orientation:horizontal
ScaleMajor = unit:year increment:5 start:1920

# there is no automatic collision detection,
# so shift texts up or down manually to avoid overlap

Define $dy = 45
Define $dys = 72
PlotData=
  bar:Leaders color:red width:25 mark:(line,white) align:left fontsize:S

  from:start till:1922 shift:(-10,$dy)   text:Vladimir~Iljitsj~[[Vladimir Lenin|Lenin]]
  from:1922  till:1953 shift:(-5,$dy)    text:~Jozef~[[Jozef Stalin|Stalin]]
  from:1953  till:1964 shift:(-32,$dy)    text:~Nikita~[[Nikita Chroesjtsjov|Chroesjtsjov]]
  from:1964  till:1982 shift:(-25,$dy)    text:~Leonid~[[Leonid Brezjnev|Brezjnev]]
  from:1982  till:1984 shift:(-45,$dy)  text:~   Joeri~[[Joeri Andropov|Andropov]]
  from:1984  till:1985 shift:(-24,$dys)    text:~Konstantin~[[Konstantin Tsjernenko|Tsjernenko]]
  from:1985  till:end  shift:(-27,$dy)   text:~Michail~[[Michail Gorbatsjov|Gorbatsjov]]
| Ronde van Frankrijk 2005 | top next |

First version by Mtcv on Sunday, March 27, 2005, last update on Sunday, July 24, 2005
ImageSize  = width:600 height:600
PlotArea   = left:25 right:0 bottom:20 top:10
DateFormat = yyyy
Period     = from:1 till:22
TimeAxis   = orientation:vertical order:reverse
ScaleMajor = gridcolor:white unit:year increment:1 start:1

Colors =
  id:alggeel    value:rgb(1,1,0.4)
  id:bergrood   value:rgb(1,0.5,0.5)
  id:puntgroen  value:rgb(0.7,1,0.5)
  id:lichtgrijs value:rgb(0.95,0.95,0.95)
  id:lichtpaars value:rgb(0.85,0.9,1)

PlotData=

  bar:Algemeen color:alggeel width:110 mark:(line,black) align:center fontsize:S shift:(0,2)
  # shift texts up or down manually to avoid overlap
  from:1  till:4  text:[[David Zabriskie]]
  from:4  till:9  text:[[Lance Armstrong]]
  from:9  till:10  text:[[Jens Voigt]]
  from:10  till:22  text:[[Lance Armstrong]]

  bar:Puntenklassement color:puntgroen
  # shift texts up or down manually to avoid overlap
  from:1  till:2  text:[[David Zabriskie]]
  from:2  till:12  text:[[Tom Boonen]]
  from:12  till:22 text:[[Thor Hushovd]]


  bar:Bergklassement color:bergrood
  # shift texts up or down manually to avoid overlap
  from:1  till:2  text:Nog geen~klassement
  from:2  till:3  text:[[Thomas Voeckler]]
  from:3  till:6  text:[[Erik Dekker]]
  from:6  till:7  text:[[Karsten Kroon]]
  from:7  till:8  text:[[Fabian Wegmann]]
  from:8  till:22  text:[[Michael Rasmussen]]


  bar:Jongerenklassement color:lichtgrijs
  # shift texts up or down manually to avoid overlap
  from:1  till:4  text:[[Fabian Cancellara]]
  from:4  till:8  text:[[Jaroslav Popovitsj]]
  from:8  till:10  text:[[Vladimir Karpets]]
  from:10  till:13  text:[[Alejandro Valverde]]
  from:13  till:22  text:[[Jaroslav Popovitsj]]


  bar:Ploegenklassement color:lichtpaars
  # shift texts up or down manually to avoid overlap
  from:1  till:14  text:[[Team CSC]]
  from:14  till:17 text:[[T-Mobile Team]]
  from:17  till:18 text:[[Discovery Channel (wielerploeg)|Discovery Channel]]
  from:18  till:22 text:[[T-Mobile Team]]
| Template:Tijdlijn Mongoolse Rijk | top next |

First version by Rex on Friday, April 8, 2005, last update on Saturday, July 8, 2006
ImageSize  = width:550 height:100
PlotArea   = width:530 height:40 left:10 bottom:30

DateFormat = yyyy
Period     = from:1200 till:1294
TimeAxis   = orientation:horizontal
ScaleMajor = unit:year increment:5 start:1200

# there is no automatic collision detection,
# so shift texts up or down manually to avoid overlap

Define $dy = 20
Define $dys = 30
Define $dyss = 40
PlotData=
  bar:Leaders width:20 mark:(line,white) align:left fontsize:S
  color:green  from:1206 till:1227 shift:(-20,$dy)   text:[[Dzjengis Khan|Dzjengis]]
  color:blue   from:1227 till:1229 shift:(-15,$dy)    text:[[Tolui]]
  color:green  from:1229 till:1241 shift:(-22,$dy)    text:[[Ögedei Khan|Ögedei]]
  color:blue   from:1241  till:1246 shift:(-30,$dy)    text:[[Töregene Khatun|Töregene]]
  color:green  from:1246  till:1248 shift:(-15,$dys)    text:[[Güyük Khan|Güyük]]
  color:blue   from:1248  till:1251 shift:(-10,$dy)  text:[[Oghul Ghaymish|Oghul]]
  color:green  from:1251  till:1259 shift:(-5,$dy)    text:[[Möngke Khan|Möngke]]
  color:blue   from:1260  till:end  shift:(-20,$dy)   text:[[Koeblai Khan]]
| Template:Tijdlijn Perzische Rijk | top next |

First version by Rex on Saturday, April 9, 2005, last update on Wednesday, April 27, 2005
ImageSize  = width:600 height:100
PlotArea   = width:580 height:40 left:10 bottom:30

DateFormat = yyyy
Period     = from:-650 till:1935
TimeAxis   = orientation:horizontal
ScaleMajor = unit:year increment:200 start:-600

# there is no automatic collision detection,
# so shift texts up or down manually to avoid overlap

Define $dy = 20
Define $dys = 30
Define $dyss = 40
PlotData=
  bar:Leaders width:20 mark:(line,white) align:left fontsize:S
  color:green  from:-648 till:-330 shift:(-42,$dy)   text:[[Achaemeniden]]
  color:blue   from:-330 till:-170 shift:(-15,$dy)    text:[[Oud-Griekenland|Hellinisme]]
  color:green  from:-170 till:226  shift:(-10,$dy)    text:[[Parthen]]
  color:blue   from:226  till:650  shift:(-30,$dy)    text:[[Sassaniden]]
  color:green  from:650  till:1219 shift:(-30,$dy)    text:[[Islam|Islamisering]]
  color:blue   from:1219 till:1500 shift:(-25,$dy)  text:[[Mongoolse Rijk|Mongolen]]
  color:green  from:1500  till:1722 shift:(-25,$dy)    text:[[Safaviden]]
  color:blue   from:1722 till:1935  shift:(-8,$dy)   text:[[Afsharid]]
| Template:NederlandseTV | top next |

First version by Michiel1972 on Wednesday, April 20, 2005, last update on Friday, June 16, 2006
ImageSize  = width:730 height:450
PlotArea   = left:90 right:20 top:30 bottom:30
TimeAxis   = orientation:horizontal
DateFormat = yyyy

Period     = from:1950 till:2007
AlignBars  = early
ScaleMajor = unit:year increment:5 start:1950


Colors =
    id:Ned1 value:rgb(1,0.7,0.7) # light red
    id:Ned2 value:rgb(1,0.7,0.7) # light red
    id:Ned3 value:rgb(1,0.7,0.7) # light red
    id:BVN value:rgb(1,0.7,0.7) # light red
    id:Sport7 value:rgb(1,0.7,0.7) # light red
    id:RTL4 value:rgb(1,0.7,0.7) # light red
    id:RTL5 value:rgb(1,0.7,0.7) # light red
    id:NET5 value:rgb(1,0.7,0.7) # light red
    id:SBS6 value:rgb(1,0.7,0.7) # light red
    id:RTL7 value:rgb(1,0.7,0.7) # light red
    id:TMF value:rgb(1,0.7,0.7) # light red
    id:Veronica value:rgb(1,0.7,0.7) # light red
    id:Jetix value:rgb(1,0.7,0.7) # light red
    id:Nickelodeon value:rgb(1,0.7,0.7) # light red
    id:Talpa value:rgb(1,0.7,0.7) # light red
    id:MTV value:rgb(1,0.7,0.7) # light red
    id:The_Box value:rgb(1,0.7,0.7) # light red
    id:Euro7 value:rgb(1,0.7,0.7) # light red

Define $dx=-3

PlotData =
  bar:Ned1 width:20 color:red shift:($dx,-20)

  from:1951 till:2007  color:yellow
  at:1960 text:" [[Nederland 1]]" shift:($dx,-5)

  bar:Ned2 width:20 color:red shift:($dx,-20)
  from:1965 till:1997  color:yellow
  from:1988 till:2003  color:orange
  from:2003 till:2007  color:yellow
  at:1975 text:" [[Nederland 2]]" shift:($dx,-5)
  at:1991 text:" [[Nederland 2| Nederland 2 (TV2)]]" shift:($dx,-5)
  at:2003 text:" [[Nederland 2]]" shift:($dx,-5)

  bar:Ned3 width:20 color:red shift:($dx,-20)
  from:1988 till:2007  color:redorange
  at:1991 text:" [[Nederland 3]]" shift:($dx,-5)

  bar:BVN width:20 color:red shift:($dx,-20)
  from:1996 till:1997  color:redorange
  From:1997 till:2007  color:yellow
  at:1992 text:" [[BVN|Zomer TV]]" shift:($dx,-5)
  at:2001 text:" [[BVN]]" shift: ($dx,-5)

  bar:vdEnde/Endemol width:20 color:red shift:($dx,-20)
  from:1989 till:1990  color:powderblue2
  from:1996 till:1997  color:lavender
  at:1988 text:" [[TV10 Ende|TV10]]" shift:($dx,-5)
  at:1993 text:" [[Sport 7]]" shift:($dx,-5)

  bar:RTL4 width:20 color:red shift:($dx,-20)
  from:1989 till:1990  color:yellowgreen
  from:1990 till:2007  color:green

  at:1983 text:" [[RTL-Véronique|RTL Veronique]]" shift:($dx,-5)
  at:1995 text:" [[RTL 4]]" shift:($dx,-5)

  bar:RTL5 width:20 color:red shift:($dx,-20)
  from:1993 till:2007  color:drabgreen
  at:1996 text:" [[RTL 5]]" shift:($dx,-5)

  bar:NET5 width:20 color:red shift:($dx,-20)
  from:1999 till:2007  color:powderblue2
  at:2001 text:" [[NET 5]]" shift:($dx,-5)

  bar:SBS6 width:20 color:red shift:($dx,-20)
  from:1995 till:2007  color:powderblue
  at:1999 text:" [[SBS 6]]" shift:($dx,-5)

  bar:RTL7 width:20 color:red shift:($dx,-20)
  from:1995 till:2001  color:coral
  from:2001 till:2005  color:skyblue
  from:2005 till:2007  color:powderblue2

  at:1995 text:" [[Veronica TV (HMG)|Veronica]]" shift:($dx,-5)
  at:2000 text:" [[Yorin]]" shift:($dx,-5)
  at:2005 text:" [[RTL 7 Nederland|RTL 7]]" shift:($dx,-5)

  bar:TMF width:20 color:red shift:($dx,-20)
  from:1995 till:1996  color:yellow
  from:1996 till:2002  color:drabgreen
  from:2002 till:2007  color:redorange

  at:1993 text:" [[TMF6]]" shift:($dx,-5)
  at:1997 text:" [[TMF9]]" shift:($dx,-5)
  at:2003 text:" [[TMF Nederland|TMF]]" shift:($dx,-5)

  bar:Veronica width:20 color:red shift:($dx,-20)
  from:1995 till:1996  color:yellow
  from:1996 till:1998  color:orange
  from:1998 till:1999  color:yellow
  from:1999 till:2000  color:orange
  from:2000 till:2002  color:yellow
  from:2002 till:2003  color:orange
  from:2003 till:2007  color:coral

  at:1991 text:" [[TV10 Gold]]" shift:($dx,-5)
  at:1996 text:" [[TV10 1996-1998|TV10]]" shift:($dx,-5)
  at:1999 text:" [[Fox (Nederland)|Fox]]" shift:($dx,-5)
  at:2002 text:" [[V8 zender|V8]]" shift:($dx,-5)
  at:2004 text:" [[Veronica TV (SBS Broadcasting)|Veronica]]" shift:($dx,-5)

  bar:Jetix width:20 color:red shift:($dx,-20)
  from:1997 till:2005  color:red
  from:2005 till:2007  color:lavender
  at:1997 text:" [[Fox Kids]]" shift:($dx,-5)
  at:2005 text:" [[Jetix]]" shift:($dx,-5)

  bar:Nickelodeon width:20 color:red shift:($dx,-20)
  from:1988 till:2003  color:green
  from:2003 till:2007  color:Orange
  at:1991 text:" [[Kindernet]]" shift:($dx,-5)
  at:2002 text:" [[Nickelodeon]]" shift:($dx,-5)

  bar:Talpa width:20 color:red shift:($dx,-20)
  from:1996 till:1997  color:green
  from:2002 till:2003  color:coral
  from:2005 till:2007  color:yellow
  at:1996 text:" [[VTV]]" shift:($dx,-5)
  at:2001 text:" [[Uitzendingen van Veronica op kanalen van MTV Networks|Veronica]]" shift:($dx,-5)
  at:2005 text:" [[Talpa zender|Talpa]]" shift:($dx,-5)

  bar:MTV width:20 color:red shift:($dx,-20)
  from:1987 till:2002  color:lavender
  from:2002 till:2007  color:redorange
  at:1988 text:" [[MTV Europe]]" shift:($dx,-5)
  at:2002 text:" [[MTV Nederland]]" shift:($dx,-5)

  bar:The_Box width:20 color:red shift:($dx,-20)
  from:1995 till:2007  color:Orange
  at:1996 text:" [[The Box]]" shift:($dx,-5)

  bar:Euro7 width:20 color:red shift:($dx,-20)
  from:1994 till:1997  color:yellow
  at:1994 text:" [[Euro7]]" shift:($dx,-5)
| Template:ÖVP | top next |

Initial version by Rex on Friday, April 29, 2005
ImageSize  = width:200 height:500
PlotArea   = width:150  height:490 left:50 bottom:10

DateFormat = yyyy
Period     = from:1945 till:2004
TimeAxis   = orientation:vertical
ScaleMajor = unit:year increment:4 start:1945

# there is no automatic collision detection,
# so shift texts up or down manually to avoid overlap

Colors=
  id:ÖVP  value:red

Define $dx = 25 # shift text to right side of bar
Define $dy = -4 # adjust height

PlotData=

  bar:Partijleider color:red width:25 mark:(line,white) align:left fontsize:S

  from:1945  till:1952 shift:($dx,$dy)    color:ÖVP    text:[[Leopold Figl]]
  from:1952  till:1960 shift:($dx,$dy)    color:ÖVP    text:[[Julius Raab]]
  from:1960  till:1963 shift:($dx,$dy)    color:ÖVP    text:[[Alfons Gorbach]]
  from:1963  till:1970 shift:($dx,$dy)    color:ÖVP    text:[[Josef Klaus]]
  from:1970  till:1971 shift:($dx,$dy)    color:ÖVP    text:[[Hermann Withalm]]
  from:1971  till:1975 shift:($dx,$dy)    color:ÖVP    text:[[Karl Schleinzer]]
  from:1975  till:1979 shift:($dx,$dy)    color:ÖVP    text:[[Josef Taus]]
  from:1979  till:1989 shift:($dx,$dy)    color:ÖVP    text:[[Alois Mock]]
  from:1989  till:1991 shift:($dx,$dy)    color:ÖVP    text:[[Josef Riegler]]
  from:1991  till:1995 shift:($dx,$dy)    color:ÖVP    text:[[Erhard Busek]]
  from:1995  till:end shift:($dx,$dy)    color:ÖVP    text:[[Wolfgang Schüssel]]
| Vervolgoorlog | top next |

Initial version by Nicklaarakkers on Thursday, December 29, 2005
#
# Tijdlijn Zuiderzeewerken
#
ImageSize  = width:750 height:120
PlotArea   = left:75 bottom:20 width:600 height:50
AlignBars  = early

DateFormat = yyyy
Period     = from:1917 till:2005
TimeAxis   = orientation:horizontal
ScaleMajor = unit:year increment:10 start:1917

Colors =
  id:grey  value:gray(0.7)

PlotData=
  bar:Leaders color:red width:25 mark:(line,grey) align:left fontsize:S shift:(0,-40)
  from:1917 till:1941 color:red
  from:1941 till:1944 color:green
  from:1944 till:2005 color:red

  shift:(-10,20)
  at:1917 mark:(line,blue) text:1917 Onafhankelijkheid
  shift:(-10,42) textcolor:black
  at:1918 mark:(line,white) text:1918 Burgeroorlog
  shift:(-10,64)
  at:1919 mark:(line,white) text:1919 Rep. Finland
  shift:(-10,20)
  at:1939 mark:(line,white) text:1939-1940 Winteroorlog
  shift:(-10,42)
  at:1941 mark:(line,white) text:1941-1944 Vervolgoorlog
  shift:(-10,64)
  at:1948 mark:(line,white) text:1948 YYA-verdrag
  shift:(-11,20)
  at:1956 mark:(line, white) text:1956-1982 Periode Kekkonen
  shift:(-11,20)
  at:1995 mark:(line, white) text:1995 Lid EU
| Template:TijdlijnMesoAmerika | top next |

First version by Evil berry on Wednesday, June 1, 2005, last update on Tuesday, June 13, 2006
ImageSize  = width:600 height:226
PlotArea   = width:500 height:178 left:100 bottom:20
DateFormat = yyyy
Period     = from:-1200 till:1700
TimeAxis   = orientation:horizontal
ScaleMajor = gridcolor:black unit:year increment:250 start:-1000

BarData=
 bar:alg
 bar:mex text:[[Dal van Mexico]]
 bar:oax text:[[Oaxaca]]
 bar:gk text:[[Golf van Mexico|Golfkust]]
 bar:yuc text:[[Yucatán (schiereiland)|Yucatán]]
 bar:wes text:[[Mexico (land)|West-Mexico]]

Colors=
  id:lightyellow value:rgb(1,1,0.4)

PlotData=
  color:kelleygreen width:25 mark:(line,black) align:center fontsize:S shift:(0,0)
  # shift texts up or down manually to avoid overlap
  bar:alg color:tan1 mark:(line,black) textcolor:black
  from:-1200 till:0 fontsize:S text:Pre-klassieke Periode

  bar:alg color:tan2 mark:(line,black) textcolor:black
  from:0 till:900 fontsize:S text:Klassieke Periode

  bar:alg color:tan1 mark:(line,black) textcolor:black
  from:900 till:1521 fontsize:S text:Post-klassieke Periode

  bar:mex color:kelleygreen mark:(line,black) textcolor:black
  from:-1200 till:-600 fontsize:S text:[[Tlatilco]]
  from:-600 till:-100 fontsize:S text:[[Cuicuilco]]
  from:-100 till:700 fontsize:S  text:[[Teotihuacan]]
  from:700 till:900 fontsize:S text:[[Xochicalco]]
  from:900 till:1168 fontsize:S text:[[Tolteken]]
  from:1325 till:1521 fontsize:S text:[[Azteken]]

  bar:oax color:yellow mark:(line,black) textcolor:white
  from:-500 till:1000 fontsize:S text:[[Zapoteken]]
  from:1000 till:1524 fontsize:S text:[[Mixteken]]

  bar:gk color:skyblue mark:(line,black) textcolor:white
  from:-1200 till:-400 fontsize:S text:[[Olmeken]]
  from:400 till:1100 fontsize:S text:[[El Tajín]]
  from:1100 till:1500 fontsize:S  text:[[Zempoala]]

  bar:yuc color:red mark:(line,black) textcolor:white
  from:-400 till:1697 fontsize:S text:[[Mayavolk|Maya]]

  bar:wes color:lavender mark:(line,black) textcolor:white
  from:-500 till:0 fontsize:S text:[[Chupícuaro]]
  from:0 till:1000 fontsize:S text:[[Schachttombecultuur]]
  from:1100 till:1530 fontsize:S text:[[Tarasken]]
| Template:TijdlijnRome | top next |

First version by Evil berry on Wednesday, June 1, 2005, last update on Sunday, March 5, 2006
ImageSize  = width:345 height:700
PlotArea   = right:40 top:10 left:40 bottom:10
DateFormat = yyyy
TimeAxis   = orientation:vertical order:reverse
Period     = from:-753 till:500
AlignBars  = early
ScaleMajor = unit:year increment:50 start:-750
Colors     =
  id:canvas value:rgb(1,1,0.85)
BackgroundColors = canvas:canvas
PlotData =
  width:15 color:green
  bar:test from:-753 till:-509 # Koninkrijk Rome
PlotData =
  width:15 color:yellow
  bar:test from:-509 till:-88 # Republiek Rome
PlotData =
  width:15 color:orange
  bar:test from:-88 till:-31 # Anarchie en burgeroorlog
PlotData =
  width:15 color:red
  bar:test from:-31 till:476 # Romeins Keizerrijk
PlotData =
  width:15 color:white
  bar:test from:476 till:500 # Oost-Romeinse Rijk

PlotData =
  bar:test at:-753 mark:(line,black)
  at:-753 shift:(10,0) text:753 v. Chr. stichting van [[Rome]].
  bar:test at:-617 mark:(line,black)
  at:-617 shift:(10,0) text:617 v. Chr. [[Etrurië|Etruskische]] koningen.
  bar:test at:-509 mark:(line,black)
  at:-509 shift:(10,0) text:509 v. Chr. [[Tarquinius Superbus]] verbannen.
  bar:test at:-500 mark:(line,black)
  bar:test at:-400 mark:(line,black)
  at:-450 shift:(10,0) text:5e eeuw v. Chr. [[Plebejer]]s vechten voor rechten.
  bar:test at:-387 mark:(line,black)
  at:-387 shift:(10,0) text:387 v. Chr. [[Kelten]] vernietigen Rome.
  bar:test at:-343 mark:(line,black)
  bar:test at:-298 mark:(line,black)
  at:-320 shift:(10,0) text:343 - 298 v. Chr. [[Samnitische oorlogen]].
  bar:test at:-264 mark:(line,black)
  at:-264 shift:(10,0) text:264 - 146 v. Chr. [[Punische oorlogen]].
  bar:test at:-216 mark:(line,black)
  at:-216 shift:(10,0) text:216 v. Chr. [[Hannibal Barkas|Hannibal]] - Slag bij Cannae.
  bar:test at:-146 mark:(line,black)
  at:-146 shift:(10,0) text:146 v. Chr. Vernietiging van [[Carthago]].
  bar:test at:-102 mark:(line,black)
  at:-102 shift:(10,0) text:104 - 100 v. Chr. [[Gaius Marius]] 5x consul.
  bar:test at:-83 mark:(line,black)
  at:-83 shift:(10,0) text:88 v. Chr. Begin [[Romeinse burgeroorlog]].
  bar:test at:-58 mark:(line,black)
  at:-58 shift:(10,0) text:58 v. Chr. [[Gaius Iulius Caesar]] verovert [[Gallia]].
  bar:test at:-44 mark:(line,black)
  at:-44 shift:(10,0) text:[[44 v. Chr.]] Gaius Iulius Caesar wordt vermoord.
  bar:test at:-31 mark:(line,black)
  at:-31 shift:(10,0) text:31 v. Chr. ''[[principaat]]'' - regering [[Gaius Iulius Caesar Octavianus (Augustus)|Augustus]].
  bar:test at:14 mark:(line,black)
  at:14 shift:(10,0) text:14 dood Augustus - regering [[Tiberius Claudius Nero (zoon)|Tiberius]].
  bar:test at:69 mark:(line,black)
  at:69 shift:(10,0) text:69 Vierkeizerjaar, [[Flavische dynsatie|Flaviërs]].
  bar:test at:97 mark:(line,black)
  at:96 shift:(10,0) text:96 [[Adoptiekeizers]]
  bar:test at:117 mark:(line,black)
  at:117 shift:(10,0) text:[[117]] Grootste omvang van het rijk.
  bar:test at:181 mark:(line,black)
  at:181 shift:(10,0) text:181 dood [[Marcus Aurelius]] - start chaos.
  at:250 shift:(10,0) text:[[3e eeuw]] Vele gewelddagdige troonswisselingen.
  bar:test at:290 mark:(line,black)
  at:290 shift:(10,0) text:[[290]] Rijk administratief gesplist.
  bar:test at:313 mark:(line,black)
  at:313 shift:(10,0) text:[[313]] Godsdienstvrijheid.
  bar:test at:330 mark:(line,black)
  at:330 shift:(10,0) text:330 [[Constantinopel]] wordt hoofdstad.
  bar:test at:390 mark:(line,black)
  at:380 shift:(10,0) text:390 [[christendom]] staatsgodsdienst.
  bar:test at:395 mark:(line,black)
  at:395 shift:(10,0) text:[[395]] Rijk definitief gesplitst.
  bar:test at:406 mark:(line,black)
  at:425 shift:(10,0) text:vanaf [[406]] Grote volksverhuizingen.
  bar:test at:476 mark:(line,black)
  at:476 shift:(10,0) text:476 Val [[West-Romeinse Rijk]].
  at:500 shift:(10,0) text:[[Oost-Romeinse Rijk]]
| Template:Geschiedenis van New York City | top next |

Initial version by Rex on Sunday, June 19, 2005
ImageSize  = width:280 height:540
PlotArea   = left:40 right:10 bottom:10 top:10
TimeAxis   = orientation:vertical
DateFormat = yyyy
Period     = from:1600 till:2010
AlignBars  = early
ScaleMajor = unit:year increment:50 start:1600
Colors =
  id:gray value:gray(0.7)

# there is no automatic collision detection,
# so shift texts up or down manually to avoid overlap
Define $dx = 20 # shift text to right side of bar

PlotData =
  bar:events width:20 shift:($dx,-4)

  from:1898 till:2010 color:red
  from:1600 till:1664 color:blue
  from:1664 till:1783 color:green
  from:1783 till:1898 color:yellow

  mark:(line,white)
  at:1609 text:"1609 ontdekking Henry Hudson"
  at:1624 text:"1624-5 Nederlandse nederzetting"
  at:1658 text:"1658 Nieuw Haarlem gesticht" shift:($dx,-7)
  at:1664 text:"1664 Britse verovering"       shift:($dx,-2)
  at:1735 text:"1735 Zaak-Zenger"
  at:1756 text:"1756 Eerste St Patrick's Day"
  at:1776 text:"1776-83 Britsen bezetting"
  mark:(line,gray)
  at:1789 text:"1789 Inauguratie Washington" shift:($dx,-8)
  at:1795 text:"1792 Stock Exchange geopend"
  at:1811 text:"1811 Commissioners' grid plan"
  at:1825 text:"1825 Erie-kanaal"
  at:1835 text:"1835 Grote brand"
  at:1863 text:"1863 Rellen"
  at:1883 text:"1883 [[Brooklyn Bridge]]"   shift:($dx,-2)
  at:1898 text:"1898 Vereniging van districten"       shift:($dx,-9)
  mark:(line,white)
  at:1904 text:"1904 IRT metro"
  at:1929 text:"1929 Instorting aandelenhandel"
  at:1939 text:"1939 Wereldtentoonstelling"
  at:1964 text:"1964 Wereldtentoonstelling"
  at:1975 text:"1975 Bijna failliet"
  at:2001 text:"2001 Terroristische aanslag WTC"
| FC Brussels | top next |

Initial version by LimoWreck on Thursday, May 4, 2006
ImageSize  = width:600 height:auto barincrement:25
PlotArea   = left:10 right:20 top:10 bottom:30
AlignBars  = justify
Period = from:1890 till:2015
ScaleMajor = unit:year increment:10 start:1890
AlignBars  = justify
TimeAxis = orientation:horizontal

Colors =
  id:RacingCB       value:white
  id:DaringCB       value:claret
  id:WhiteStar      value:red
  id:RacingWhite    value:red
  id:RWDM           value:red
  id:Brussels       value:white
  id:Strombeek      value:white
  id:canvas         value:gray(0.9)

BackgroundColors = canvas:canvas

BarData=
  Bar:RacingCB
  Bar:RacingWhite
  Bar:WhiteStar
  Bar:RWDM
  Bar:DaringCB
  Bar:Brussels
  Bar:Strombeek

PlotData=
  fontsize:S align:center width:18 mark:(line,black)
  bar:RacingCB color:RacingCB from:1891 till:1963 text:"[[Racing Club de Bruxelles]]"
  bar:DaringCB color:DaringCB from:1895 till:1973 text:"[[Daring Club de Bruxelles]]"
  bar:WhiteStar color:WhiteStar from:1909 till:1963 text:"[[White Star AC]]"
  bar:Strombeek color:Strombeek from:1932 till:2002 text:"[[KFC Strombeek]]"
  bar:RacingWhite color:RacingWhite from:1963 till:1973 text:"[[Racing White]]"
  bar:RWDM color:RWDM from:1973 till:2002 text:"[[RWDM]]"
  bar:Brussels color:Brussels from:2002 till:2007 text:"[[FC Brussels]]"
LineData=
  at:1963 color:black frompos:118
  at:1973 color:black frompos:74 tillpos:153
  at:2002 color:black frompos:30 tillpos:114
| KSC Lokeren Oost-Vlaanderen | top next |

Initial version by LimoWreck on Wednesday, May 3, 2006
ImageSize  = width:600 height:auto barincrement:25
PlotArea   = left:10 right:20 top:10 bottom:30
AlignBars  = justify
Period = from:1915 till:2015
ScaleMajor = unit:year increment:10 start:1920
AlignBars  = justify
TimeAxis = orientation:horizontal

Colors =
  id:Racing       value:white
  id:Standaard    value:yellow
  id:SK           value:skyblue
  id:Excelsior    value:green
  id:canvas       value:gray(0.97)

BackgroundColors = canvas:canvas

BarData=
  Bar:Racing
  Bar:KSC
  Bar:Standaard
  Bar:KSCLOVL
  Bar:SK
  Bar:KSNSE
  Bar:Excelsior

PlotData=
  fontsize:S align:center width:18 mark:(line,black)
  bar:Racing color:Racing from:1923 till:1970 text:"[[Racing Club Lokeren]]"
  bar:KSC color:Racing from:1970 till:2000 text:"[[KSC Lokeren]]"
  bar:Standaard color:Standaard from:1931 till:1970 text:"[[Standaard FC Lokeren]]"
  bar:KSCLOVL mark:(line,white) color:Racing from:2000 till:2007 text:"[[KSC Lokeren Oost-Vlaanderen|KSC Lokeren O-Vl]]"
  bar:SK color:SK from:1920 till:1989 text:"[[Sint-Niklase SK]]"
  bar:KSNSE color:SK from:1989 till:2000 text:"[[Sint-Niklase SK|Sint-Niklase SK Excelsior]]"
  bar:Excelsior color:Excelsior from:1921 till:1989 text:"[[Excelsior AC Sint-Niklaas]]"
LineData=
  at:1989 color:black frompos:30 tillpos:92
  at:1970 color:black frompos:117
  at:2000 color:black frompos:52 tillpos:158
| Template:VlaamseTV | top next |

First version by FT on Friday, August 26, 2005, last update on Monday, June 12, 2006
ImageSize  = width:730 height:300
PlotArea   = left:80 right:30 top:30 bottom:30
TimeAxis   = orientation:horizontal
DateFormat = yyyy

Period     = from:1950 till:2007
AlignBars  = early
ScaleMajor = unit:year increment:5 start:1950


Colors =
    id:één value:rgb(1,0.7,0.7) # light red
    id:Canvas/Ketnet value:rgb(1,0.7,0.7) # light red
    id:BVN value:rgb(1,0.7,0.7) # light red
    id:VTM value:rgb(1,0.7,0.7) # light red
    id:Kanaaltwee value:rgb(1,0.7,0.7) # light red
    id:JIM value:rgb(1,0.7,0.7) # light red
    id:VT4 value:rgb(1,0.7,0.7) # light red
    id:VijfTV value:rgb(1,0.7,0.7) # light red
    id:TMF value:rgb(1,0.7,0.7) # light red
    id:Vitaya value:rgb(1,0.7,0.7) # light red
    id:KanaalZ value:rgb(1,0.7,0.7) # light red
    id:ActuaTV value:rgb(1,0.7,0.7) # light red


Define $dx=-3

PlotData =
  bar:VRT1 width:20 color:red shift:($dx,-20)

  from:1953 till:1960  color:redorange
  from:1960 till:1977  color:yellow
  from:1977 till:1990  color:redorange
  from:1990 till:1998  color:yellow
  from:1998 till:2005  color:redorange
  from:2005 till:2007  color:yellow
  at:1953 text:" [[NIR]]" shift:($dx,-5)
  at:1960 text:" [[BRT]]" shift:($dx,-5)
  at:1977 text:" [[BRT1]]" shift:($dx,-5)
  at:1990 text:" [[BRTN TV1]]" shift:($dx,-5)
  at:1998 text:" [[VRT TV1]]" shift:($dx,-5)
  at:2005 text:" [[Één (televisiezender)|één]]" shift:($dx,-5)

  bar:VRT2 width:20 color:red shift:($dx,-20)
  from:1977 till:1990  color:yellow
  from:1990 till:1998  color:redorange
  from:1998 till:2007  color:yellow
  at:1977 text:" [[BRTN_TV2|BRT2]]" shift:($dx,-5)
  at:1990 text:" [[BRTN_TV2|BRTN TV2]]" shift:($dx,-5)
  at:1998 text:" [[Canvas (televisie)|Canvas]] [[Ketnet]]" shift:($dx,-5)

  bar:VRT/NOS width:20 color:red shift:($dx,-20)
  from:1996 till:1997  color:redorange
  From:1997 till:2007  color:yellow
  at:1993 text:" [[BVN|Zomer TV]]" shift:($dx,-5)
  at:2001 text:" [[BVN]]" shift: ($dx,-5)

  bar:Vmm1 width:20 color:red shift:($dx,-20)
  from:1989 till:2007  color:powderblue
  at:1989 text:" [[VTM]]" shift:($dx,-5)

  bar:Vmm2 width:20 color:red shift:($dx,-20)
  from:1995 till:1997  color:powderblue2
  from:1997 till:2007  color:powderblue
  at:1995 text:" [[KanaalTwee|Ka2]]" shift:($dx,-5)
  at:1997 text:" [[KanaalTwee|Kanaal twee]]" shift:($dx,-5)

  bar:Vmm3 width:20 color:red shift:($dx,-20)
  from:2001 till:2007  color:powderblue
  at:2001 text:" [[JIMtv|JIM]]" shift:($dx,-5)

  bar:SBS1 width:20 color:red shift:($dx,-20)
  from:1995 till:2007  color:red
  at:1995 text:" [[VT4]]" shift:($dx,-5)

  bar:SBS2 width:20 color:red shift:($dx,-20)
  from:2005 till:2007  color:red
  at:2005 text:" [[VijfTV]]" shift:($dx,-5)

  bar:MTV width:20 color:red shift:($dx,-20)
  from:1998 till:2007  color:orange
  at:1998 text:" [[TMF_Vlaanderen|TMF]]" shift:($dx,-5)

  bar:BBT width:20 color:red shift:($dx,-20)
  from:1999 till:2007  color:skyblue
  at:1999 text:" [[Kanaal Z]]" shift:($dx,-5)

  bar:Vitaya width:20 color:red shift:($dx,-20)
  from:2000 till:2007  color:coral
  at:2000 text:" [[Vitaya]]" shift:($dx,-5)

  bar:ActuaTV width:20 color:red shift:($dx,-20)
  from:2005 till:2007  color:green
  at:2005 text:" [[ActuaTV]]" shift:($dx,-5)
| Template:Timeline0tot2000 | top next |

Initial version by HenkvD on Monday, August 29, 2005
ImageSize  = width:560 height:50
PlotArea   = width:530 height:25 left:10 bottom:20
DateFormat = yyyy
Period     = from:0 till:2005
TimeAxis   = orientation:horizontal
ScaleMajor = unit:year increment:500 start:0
ScaleMinor = unit:year increment:100 start:0
PlotData   = width:25
  from:start till:end  color:orange
  from:500   till:500  color:yellow
  from:1000  till:1000 color:yellow
  from:1500  till:1500 color:yellow
  from:2000  till:2000 color:yellow
  from:{{{1}}} till:{{{2}}} color:red width:15
| RWDM | top next |
Initial version by LimoWreck on Thursday, May 4, 2006
ImageSize  = width:600 height:auto barincrement:25
PlotArea   = left:10 right:20 top:10 bottom:30
AlignBars  = justify
Period = from:1890 till:2015
ScaleMajor = unit:year increment:10 start:1890
AlignBars  = justify
TimeAxis = orientation:horizontal

Colors =
  id:RacingCB       value:white
  id:DaringCB       value:claret
  id:WhiteStar      value:red
  id:RacingWhite    value:red
  id:RWDM           value:red
  id:Brussels       value:white
  id:Strombeek      value:white
  id:canvas         value:gray(0.9)

BackgroundColors = canvas:canvas

BarData=
  Bar:RacingCB
  Bar:RacingWhite
  Bar:WhiteStar
  Bar:RWDM
  Bar:DaringCB
  Bar:Brussels
  Bar:Strombeek

PlotData=
  fontsize:S align:center width:18 mark:(line,black)
  bar:RacingCB color:RacingCB from:1891 till:1963 text:"[[Racing Club de Bruxelles]]"
  bar:DaringCB color:DaringCB from:1895 till:1973 text:"[[Daring Club de Bruxelles]]"
  bar:WhiteStar color:WhiteStar from:1909 till:1963 text:"[[White Star AC]]"
  bar:Strombeek color:Strombeek from:1932 till:2002 text:"[[KFC Strombeek]]"
  bar:RacingWhite color:RacingWhite from:1963 till:1973 text:"[[Racing White]]"
  bar:RWDM color:RWDM from:1973 till:2002 text:"[[RWDM]]"
  bar:Brussels color:Brussels from:2002 till:2007 text:"[[FC Brussels]]"
LineData=
  at:1963 color:black frompos:118
  at:1973 color:black frompos:74 tillpos:153
  at:2002 color:black frompos:30 tillpos:114
| Ronde van Frankrijk 2006 | top next |

First version by Koos Jol on Friday, November 4, 2005, last update on Sunday, July 23, 2006
ImageSize  = width:600 height:600
PlotArea   = left:25 right:0 bottom:20 top:10
DateFormat = yyyy
Period     = from:0 till:21
TimeAxis   = orientation:vertical order:reverse
ScaleMajor = gridcolor:white unit:year increment:1 start:1

Colors =
  id:alggeel    value:rgb(1,1,0.4)
  id:bergrood   value:rgb(1,0.5,0.5)
  id:puntgroen  value:rgb(0.7,1,0.5)
  id:lichtgrijs value:rgb(0.95,0.95,0.95)
  id:lichtpaars value:rgb(0.85,0.9,1)

PlotData=

  bar:Algemeen color:alggeel width:110 mark:(line,black) align:center fontsize:S shift:(0,2)
  # shift texts up or down manually to avoid overlap
  from:0  till:1   text:[[Thor Hushovd]]
  from:1  till:2   text:[[George Hincapie]]
  from:2  till:3   text:[[Thor Hushovd]]
  from:3  till:7   text:[[Tom Boonen]]
  from:7  till:10   text:[[Sergej Gontsjar]]
  from:10  till:11   text:[[Cyril Dessel]]
  from:11  till:13   text:[[Floyd Landis]]
  from:13  till:15  text:[[Oscar Pereiro Sio]]
  from:15  till:16   text:[[Floyd Landis]]
  from:16  till:19 text:[[Oscar Pereiro Sio]]
  from:19  till:21 text:[[Floyd Landis]]

  bar:Puntenklassement color:puntgroen
  # shift texts up or down manually to avoid overlap
  from:0  till:1   text:[[Thor Hushovd]]
  from:1  till:2   text:[[Jimmy Casper]]
  from:2  till:3   text:[[Robbie McEwen]]
  from:3  till:4   text:[[Tom Boonen]]
  from:4  till:21   text:[[Robbie McEwen]]

  bar:Bergklassement color:bergrood
  # shift texts up or down manually to avoid overlap
  from:0  till:1  text:Nog geen punten
  from:1  till:2  text:[[Fabian Wegmann]]
  from:2  till:3  text:[[David De La Fuente]]
  from:3  till:10   text:[[Jérôme Pineau]]
  from:10  till:11   text:[[Cyril Dessel]]
  from:11  till:16   text:[[David De La Fuente]]
  from:16  till:21  text:[[Michael Rasmussen]]

  bar:Jongerenklassement color:lichtgrijs
  # shift texts up or down manually to avoid overlap
  from:0  till:1  text:[[Joost Posthuma]]
  from:1  till:3  text:[[Benoît Vaugrenard]]
  from:3  till:6   text:[[Markus Fothen]]
  from:6  till:7  text:[[Benoît Vaugrenard]]
  from:7  till:17  text:[[Markus Fothen]]
  from:17  till:21  text:[[Damiano Cunego]]

  bar:Ploegenklassement color:lichtpaars
  # shift texts up or down manually to avoid overlap
  from:0  till:7  text:[[Discovery Channel Pro Cycling Team|Discovery Channel]]
  from:7  till:10  text:[[T-Mobile Team]]
  from:10  till:11  text:[[Ag2r Prévoyance]]
  from:11  till:13  text:[[T-Mobile Team]]
  from:13  till:17  text:[[Team CSC]]
  from:17  till:21  text:[[T-Mobile Team]]
| Template:Grafiek bezoekersaantallen | top next |
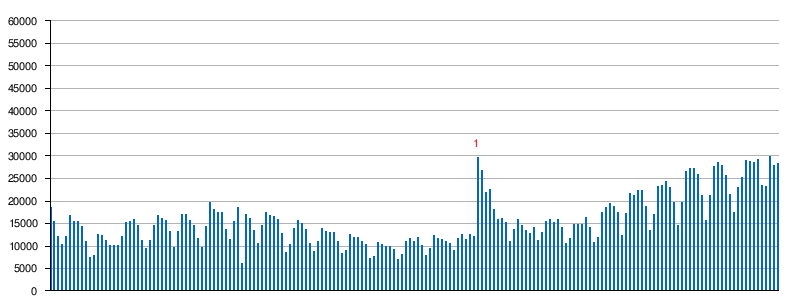
First version by JePe ? on Thursday, October 20, 2005, last update on Monday, April 24, 2006
ImageSize  = width:auto height:300 barincrement:4
PlotArea   = left:50 right:20 top:20 bottom:10
AlignBars  = justify

Colors     =
  id:lightgrey value:gray(0.7)

DateFormat = yyyy
Period     = from:0 till:60000
TimeAxis   = orientation:vertical
ScaleMajor = unit:year gridcolor:lightgrey increment:5000 start:0

BarData=
  barset:Teller

PlotData=
  color:blue width:1
  barset:Teller
  from:start till:28336 #19-10-2005
  from:start till:27986 #18-10-2005
  from:start till:29969 #17-10-2005
  from:start till:23158 #16-10-2005
  from:start till:23552 #15-10-2005
  from:start till:29253 #14-10-2005
  from:start till:28481 #13-10-2005
  from:start till:28801 #12-10-2005
  from:start till:29027 #11-10-2005
  from:start till:25282 #10-10-2005
  from:start till:22958 #09-10-2005
  from:start till:17413 #08-10-2005
  from:start till:21455 #07-10-2005
  from:start till:25591 #06-10-2005
  from:start till:27982 #05-10-2005
  from:start till:28595 #04-10-2005
  from:start till:27772 #03-10-2005
  from:start till:21231 #02-10-2005
  from:start till:15683 #01-10-2005
  from:start till:21232 #30-09-2005
  from:start till:25792 #29-09-2005
  from:start till:27279 #28-09-2005
  from:start till:27189 #27-09-2005
  from:start till:26454 #26-09-2005
  from:start till:19593 #25-09-2005
  from:start till:14622 #24-09-2005
  from:start till:19642 #23-09-2005
  from:start till:23078 #22-09-2005
  from:start till:24265 #21-09-2005
  from:start till:23385 #20-09-2005
  from:start till:23140 #19-09-2005
  from:start till:16992 #18-09-2005
  from:start till:13501 #17-09-2005
  from:start till:18750 #16-09-2005
  from:start till:22303 #15-09-2005
  from:start till:22430 #14-09-2005
  from:start till:21186 #13-09-2005
  from:start till:21629 #12-09-2005
  from:start till:17124 #11-09-2005
  from:start till:12424 #10-09-2005
  from:start till:17449 #09-09-2005
  from:start till:18778 #08-09-2005
  from:start till:19375 #07-09-2005
  from:start till:18631 #06-09-2005
  from:start till:17512 #05-09-2005
  from:start till:11956 #04-09-2005
  from:start till:10871 #03-09-2005
  from:start till:14112 #02-09-2005
  from:start till:16309 #01-09-2005
  from:start till:14747 #31-08-2005
  from:start till:14850 #30-08-2005
  from:start till:14879 #29-08-2005
  from:start till:11645 #28-08-2005
  from:start till:10546 #27-08-2005
  from:start till:14127 #26-08-2005
  from:start till:15889 #25-08-2005
  from:start till:15117 #24-08-2005
  from:start till:15855 #23-08-2005
  from:start till:15517 #22-08-2005
  from:start till:12915 #21-08-2005
  from:start till:11237 #20-08-2005
  from:start till:14124 #19-08-2005
  from:start till:12852 #18-08-2005
  from:start till:13334 #17-08-2005
  from:start till:14639 #16-08-2005
  from:start till:15938 #15-08-2005
  from:start till:13718 #14-08-2005
  from:start till:11082 #13-08-2005
  from:start till:15283 #12-08-2005
  from:start till:16133 #11-08-2005
  from:start till:15938 #10-08-2005
  from:start till:18181 #09-08-2005
  from:start till:22629 #08-08-2005
  from:start till:21948 #07-08-2005
  from:start till:26779 #06-08-2005
  from:start till:29646 align:center shift:(0,77) textcolor:red fontsize:S text:1 #05-08-2005
  from:start till:12042 #04-08-2005
  from:start till:12509 #03-08-2005
  from:start till:11414 #02-08-2005
  from:start till:12630 #01-08-2005
  from:start till:11683 #31-07-2005
  from:start till:8934  #30-07-2005
  from:start till:10557 #29-07-2005
  from:start till:11069 #28-07-2005
  from:start till:11486 #27-07-2005
  from:start till:11573 #26-07-2005
  from:start till:12319 #25-07-2005
  from:start till:9396  #24-07-2005
  from:start till:7867  #23-07-2005
  from:start till:10134 #22-07-2005
  from:start till:11819 #21-07-2005
  from:start till:10899 #20-07-2005
  from:start till:11577 #19-07-2005
  from:start till:10988 #18-07-2005
  from:start till:8093  #17-07-2005
  from:start till:6993  #16-07-2005
  from:start till:9293  #15-07-2005
  from:start till:9884  #14-07-2005
  from:start till:9916  #13-07-2005
  from:start till:10359 #12-07-2005
  from:start till:10703 #11-07-2005
  from:start till:7746  #10-07-2005
  from:start till:7298  #09-07-2005
  from:start till:10390 #08-07-2005
  from:start till:10926 #07-07-2005
  from:start till:11784 #06-07-2005
  from:start till:11788 #05-07-2005
  from:start till:12581 #04-07-2005
  from:start till:8949  #03-07-2005
  from:start till:8226  #02-07-2005
  from:start till:11045 #01-07-2005
  from:start till:12965 #30-06-2005
  from:start till:12900 #29-06-2005
  from:start till:13259 #28-06-2005
  from:start till:13991 #27-06-2005
  from:start till:11061 #26-06-2005
  from:start till:8674  #25-06-2005
  from:start till:10471 #24-06-2005
  from:start till:13566 #23-06-2005
  from:start till:14963 #22-06-2005
  from:start till:15659 #21-06-2005
  from:start till:13973 #20-06-2005
  from:start till:10412 #19-06-2005
  from:start till:8575  #18-06-2005
  from:start till:12703 #17-06-2005
  from:start till:15939 #16-06-2005
  from:start till:16556 #15-06-2005
  from:start till:16702 #14-06-2005
  from:start till:17461 #13-06-2005
  from:start till:14592 #12-06-2005
  from:start till:10473 #11-06-2005
  from:start till:13348 #10-06-2005
  from:start till:16168 #09-06-2005
  from:start till:16985 #08-06-2005
  from:start till:6123  #07-06-2005
  from:start till:18620 #06-06-2005
  from:start till:15401 #05-06-2005
  from:start till:11391 #04-06-2005
  from:start till:13591 #03-06-2005
  from:start till:17368 #02-06-2005
  from:start till:17384 #01-06-2005
  from:start till:18049 #31-05-2005
  from:start till:19768 #30-05-2005
  from:start till:14301 #29-05-2005
  from:start till:9557  #28-05-2005
  from:start till:11650 #27-05-2005
  from:start till:14497 #26-05-2005
  from:start till:15734 #25-05-2005
  from:start till:17022 #24-05-2005
  from:start till:16949 #23-05-2005
  from:start till:13238 #22-05-2005
  from:start till:9592  #21-05-2005
  from:start till:13256 #20-05-2005
  from:start till:15625 #19-05-2005
  from:start till:16134 #18-05-2005
  from:start till:16869 #17-05-2005
  from:start till:14573 #16-05-2005
  from:start till:11317 #15-05-2005
  from:start till:9388  #14-05-2005
  from:start till:11259 #13-05-2005
  from:start till:14531 #12-05-2005
  from:start till:15932 #11-05-2005
  from:start till:15467 #10-05-2005
  from:start till:15246 #09-05-2005
  from:start till:12056 #08-05-2005
  from:start till:10198 #07-05-2005
  from:start till:10158 #06-05-2005
  from:start till:10181 #05-05-2005
  from:start till:11132 #04-05-2005
  from:start till:12313 #03-05-2005
  from:start till:12601 #02-05-2005
  from:start till:7961  #01-05-2005
  from:start till:7470  #30-04-2005
  from:start till:11016 #29-04-2005
  from:start till:14384 #28-04-2005
  from:start till:15439 #27-04-2005
  from:start till:15343 #26-04-2005
  from:start till:16853 #25-04-2005
  from:start till:12145 #24-04-2005
  from:start till:10244 #23-04-2005
  from:start till:12026 #22-04-2005
  from:start till:15502 #21-04-2005
  from:start till:18595 #20-04-2005
| Template:Grafiek bezoekersaantallen | top next |

First version by JePe ? on Thursday, October 20, 2005, last update on Monday, April 24, 2006
ImageSize  = width:auto height:350 barincrement:4
PlotArea   = left:50 right:20 top:20 bottom:10
AlignBars  = justify

Colors     =
  id:lightgrey value:gray(0.7)

DateFormat = yyyy
Period     = from:0 till:60000
TimeAxis   = orientation:vertical
ScaleMajor = unit:year gridcolor:lightgrey increment:5000 start:0

BarData=
  barset:Teller

PlotData=
  color:blue width:1
  barset:Teller
  from:start till:43520 #19-03-2006
  from:start till:57273 #18-03-2006
  from:start till:44900 #17-03-2006
  from:start till:33326 #16-03-2006
  from:start till:29842 #15-03-2006
  from:start till:38447 #14-03-2006
  from:start till:46207 #13-03-2006
  from:start till:51629 #12-03-2006
  from:start till:52456 #11-03-2006
  from:start till:54007 #10-03-2006
  from:start till:38015 #09-03-2006
  from:start till:29755 #08-03-2006
  from:start till:41193 #07-03-2006
  from:start till:47359 #06-03-2006
  from:start till:50382 #05-03-2006
  from:start till:51356 #04-03-2006
  from:start till:51546 #03-03-2006
  from:start till:38527 #02-03-2006
  from:start till:28851 #01-03-2006
  from:start till:40113 #31-03-2006
  from:start till:51455 #30-03-2006
  from:start till:52840 #29-03-2006
  from:start till:53222 #28-03-2006
  from:start till:55566 #27-03-2006
  from:start till:39196 #26-03-2006
  from:start till:32289 #25-03-2006
  from:start till:43334 #24-03-2006
  from:start till:50201 #23-03-2006
  from:start till:54449 #22-03-2006
  from:start till:55806 #21-03-2006
  from:start till:55516 #20-03-2006
  from:start till:43901 #19-03-2006
  from:start till:31710 #18-03-2006
  from:start till:42776 #17-03-2006
  from:start till:54148 #16-03-2006
  from:start till:54992 #15-03-2006
  from:start till:54260 #14-03-2006
  from:start till:56622 #13-03-2006
  from:start till:45188 #12-03-2006
  from:start till:35270 #11-03-2006
  from:start till:43741 #10-03-2006
  from:start till:53924 #09-03-2006
  from:start till:58085 #08-03-2006
  from:start till:54469 #07-03-2006
  from:start till:58356 #06-03-2006
  from:start till:47260 #05-03-2006
  from:start till:36846 #04-03-2006
  from:start till:45277 #03-03-2006
  from:start till:45368 #02-03-2006
  from:start till:45104 #01-03-2006
  from:start till:42397 #28-02-2006
  from:start till:34360 #27-02-2006
  from:start till:25519 #26-02-2006
  from:start till:31313 #25-02-2006
  from:start till:42887 #24-02-2006
  from:start till:44488 #23-02-2006
  from:start till:45488 #22-02-2006
  from:start till:43792 #21-02-2006
  from:start till:46323 #20-02-2006
  from:start till:35640 #19-02-2006
  from:start till:28505 #18-02-2006
  from:start till:38904 #17-02-2006
  from:start till:48944 #16-02-2006
  from:start till:51420 #15-02-2006
  from:start till:47480 #14-02-2006
  from:start till:46783 #13-02-2006
  from:start till:39378 #12-02-2006
  from:start till:29020 #11-02-2006
  from:start till:39595 #10-02-2006
  from:start till:49017 #09-02-2006
  from:start till:51590 #08-02-2006
  from:start till:50536 #07-02-2006
  from:start till:50204 #06-02-2006
  from:start till:40953 #05-02-2006
  from:start till:30610 #04-02-2006
  from:start till:39705 #03-02-2006
  from:start till:50084 #02-02-2006
  from:start till:51264 #01-02-2006
  from:start till:46352 #31-01-2006
  from:start till:49105 #30-01-2006
  from:start till:39278 #29-01-2006
  from:start till:30139 #28-01-2006
  from:start till:38584 #27-01-2006
  from:start till:47027 #26-01-2006
  from:start till:48907 #25-01-2006
  from:start till:47773 #24-01-2006
  from:start till:48841 #23-01-2006
  from:start till:40373 #22-01-2006
  from:start till:30330 #21-01-2006
  from:start till:39906 #20-01-2006
  from:start till:47440 #19-01-2006
  from:start till:49049 #18-01-2006
  from:start till:49077 #17-01-2006
  from:start till:49152 #16-01-2006
  from:start till:40136 #15-01-2006
  from:start till:29434 #14-01-2006
  from:start till:37231 #13-01-2006
  from:start till:46377 #12-01-2006
  from:start till:48108 #11-01-2006
  from:start till:46882 #10-01-2006
  from:start till:45283 #09-01-2006
  from:start till:35393 #08-01-2006
  from:start till:27401 #07-01-2006
  from:start till:33332 #06-01-2006
  from:start till:35312 #05-01-2006
  from:start till:35400 #04-01-2006
  from:start till:33207 #03-01-2006
  from:start till:33377 #02-01-2006
  from:start till:18543 #01-01-2006
  from:start till:18761 #31-12-2005
  from:start till:25877 #30-12-2005
  from:start till:27262 #29-12-2005
  from:start till:28220 align:center shift:(0,80) textcolor:red fontsize:S text:2 #28-12-2005
  from:start till:27369 #27-12-2005
  from:start till:22287 #26-12-2005
  from:start till:17918 #25-12-2005
  from:start till:18370 #24-12-2005
  from:start till:23923 #23-12-2005
  from:start till:31566 #22-12-2005
  from:start till:39731 #21-12-2005
  from:start till:42030 #20-12-2005
  from:start till:44788 #19-12-2005
  from:start till:36073 #18-12-2005
  from:start till:31077 #17-12-2005
  from:start till:44105 #16-12-2005
  from:start till:50069 align:center shift:(0,140) textcolor:red fontsize:S text:1 #15-12-2005
  from:start till:36874 #14-12-2005
  from:start till:37308 #13-12-2005
  from:start till:37500 #12-12-2005
  from:start till:26867 #11-12-2005
  from:start till:19961 #10-12-2005
  from:start till:27813 #09-12-2005
  from:start till:36844 #08-12-2005
  from:start till:38992 #07-12-2005
  from:start till:38733 #06-12-2005
  from:start till:34224 #05-12-2005
  from:start till:26380 #04-12-2005
  from:start till:20495 #03-12-2005
  from:start till:26814 #02-12-2005
  from:start till:34269 #01-12-2005
  from:start till:36297 #30-11-2005
  from:start till:35464 #29-11-2005
  from:start till:35807 #28-11-2005
  from:start till:27847 #27-11-2005
  from:start till:20615 #26-11-2005
  from:start till:26612 #25-11-2005
  from:start till:34061 #24-11-2005
  from:start till:34529 #23-11-2005
  from:start till:34782 #22-11-2005
  from:start till:34497 #21-11-2005
  from:start till:28019 #20-11-2005
  from:start till:20251 #19-11-2005
  from:start till:26052 #18-11-2005
  from:start till:34490 #17-11-2005
  from:start till:35390 #16-11-2005
  from:start till:35300 #15-11-2005
  from:start till:34476 #14-11-2005
  from:start till:27404 #13-11-2005
  from:start till:20675 #12-11-2005
  from:start till:27464 #11-11-2005
  from:start till:32106 #10-11-2005
  from:start till:35440 #09-11-2005
  from:start till:32067 #08-11-2005
  from:start till:35791 #07-11-2005
  from:start till:27503 #06-11-2005
  from:start till:21077 #05-11-2005
  from:start till:27776 #04-11-2005
  from:start till:32211 #03-11-2005
  from:start till:32894 #02-11-2005
  from:start till:31769 #01-11-2005
  from:start till:32435 #31-10-2005
  from:start till:25048 #30-10-2005
  from:start till:18166 #29-10-2005
  from:start till:24748 #28-10-2005
  from:start till:31252 #27-10-2005
  from:start till:31370 #26-10-2005
  from:start till:32476 #25-10-2005
  from:start till:30346 #24-10-2005
  from:start till:27036 #23-10-2005
  from:start till:22621 #22-10-2005
  from:start till:25199 #21-10-2005
  from:start till:27626 #20-10-2005

  barset:skip
| Template:Tijdlijn Grote Volksverhuizing | top next |

First version by Gpvos on Saturday, November 26, 2005, last update on Tuesday, December 27, 2005
DateFormat = yyyy
ImageSize  = width:750 height:auto barincrement:18
PlotArea   = left:20 right:40 bottom:30 top:15

Colors     =
  id:canvas      value:rgb(0.97,0.97,0.97)
  id:grid1       value:rgb(0.80,0.80,0.80)
  id:grid2       value:rgb(0.90,0.90,0.90)
  id:Titel       value:rgb(0.86,0.56,0.56)
  id:Byzantium   value:rgb(0.80,0.80,0.99)
  id:Goten       value:rgb(0.80,0.99,0.80)
  id:Lango       value:rgb(0.80,0.99,0.80)
  id:Germ1       value:rgb(0.80,0.99,0.80)
  id:Germ2       value:rgb(0.90,0.99,0.80)
  id:Germ3       value:rgb(0.80,0.99,0.80)
  id:Vandalen    value:rgb(0.80,0.99,0.80)
  id:Islam       value:rgb(0.70,0.99,0.70)
  id:Hunnen      value:rgb(0.80,0.60,0.40)
  id:Avaren      value:rgb(0.80,0.80,0.60)
  id:Slaven      value:rgb(0.99,0.80,0.60)
  id:Magyaren    value:rgb(0.90,0.30,0.60)

  id:Leven       value:rgb(0.99,0.80,0.80)
  id:Regeert     value:rgb(0.99,0.60,0.60)
  id:Keizer      value:rgb(0.99,0.30,0.50)
  id:gray        value:gray(0.7)
  id:lightblue   value:rgb(0.60,0.99,0.99)

Period     = from:267 till:1000
TimeAxis   = orientation:horizontal format:yyyy
ScaleMinor = unit:year  increment:25  start:325 gridcolor:grid2
ScaleMajor = unit:year  increment:100 start:300 gridcolor:grid1
AlignBars  = justify

BackgroundColors = canvas:canvas bars:canvas

BarData=
  bar:Titelbalk
  bar:Levens1
  bar:Levens2
  bar:Levens3
  bar:Germ1
  bar:Migr1
  bar:Migr2
  bar:Byz
  bar:Italie
  bar:Iberie
  bar:Brittannie
  bar:Hunnen
  bar:Avaren
  bar:Onogur
  bar:Bulgaren
  bar:Westslaven
  bar:Zuidslaven
  bar:Magyaren
  barset:Ev1


PlotData=
  width:18 fontsize:S textcolor:black align:center
  bar:Titelbalk color:Titel shift:(0,-3)
  from:start  till:end text: "Grote Volksverhuizing"

  width:18 fontsize:S textcolor:black anchor:from align:left
  bar:Levens1
  color:Keizer
  from:305 till:395 text:[[Tetrarchie]]
  from:424 till:455 text:[[Valentinianus III]]
  color:Leven
  from:747 till:771 text:"[[Karel de Grote]]"
  color:Regeert
  from:771 till:800
  color:Keizer
  from:800 till:814

  bar:Levens2
  color:Leven
  from:271 till:306 text:[[Constantijn de Grote|Constantijn]]
  color:Keizer
  from:306 till:337
  color:Leven
  from:406 till:434 text:[[Attila]]
  color:Regeert
  from:434 till:453
  color:Leven
  from:540 till:590 text:[[Gregorius I]]
  color:Regeert
  from:590 till:604
  color:Leven
  from:632 till:735 text:[[Bede]]

  bar:Levens3
  color:Leven
  from:454 till:488 text:[[Theodoric de Grote|Theodoric]]
  color:Regeert
  from:488 till:526
  color:Leven
  from:570 till:632 text:"[[Mohammed]]

  bar:Germ1
  color:Germ1
  from:457 till:751 text:"[[Merovingen]]"
  color:Germ2
  from:751 till:end text:"[[Karolingen]]"

  bar:Byz
  color:Byzantium
  from:539 till:751 text:"[[Exarchaat van Ravenna]]"

  bar:Italie
  color:Lango
  from:568 till:774 text:"[[Langobarden]]"

  bar:Migr1
  color:Goten
  from:267 till:271 text:"[[Goten|Gothische]] migratie"

  bar:Migr2
  color:Vandalen
  from:400 till:534 text:"[[Vandalen]]"

  bar:Iberie
  color:Goten
  from:429 till:711 text:"[[Visigoten|Visigothisch]] Iberie"
  color:Islam
  from:711 till:end text:[[Al-Andalus]]

  bar:Brittannie
  color:Germ2
  from:410 till:590 text:"[[Angelsaksen|Angelsaksische]] invasie van [[Brittannië]]"
  color:Germ3
  from:793 till:end text:"[[Viking]]rooftochten"

  bar:Hunnen
  color:Hunnen
  from:370 till:454 text:[[Hunnen]]

  bar:Avaren
  color:Avaren
  from:500 till:805 text:[[Euraziatische Avaren|Avaren]]

  bar:Onogur
  color:Avaren
  from:635 till:685 text:[[Onogur]]

  bar:Bulgaren
  color:Slaven
  from:681 till:end text:[[Bulgarije]]

  bar:Westslaven
  color:Slaven
  from:623 till:658 text:Rijk van [[Samo]]
  from:770 till:907 text:Moravië/Nitrië (v/a 833 [[Groot-Moravië]])

  bar:Zuidslaven
  color:Slaven
  from:626 till:end text:[[Middeleeuwse Kroatische staat]]

  bar:Magyaren
  color:Magyaren
  from:896 till:end text:[[Magyaren]]

  barset:Ev1
  at:410 text:410 Visigoten plunderen Rome
  at:410 text:410 Rome verlaat Brittannië
  at:439 text:439 Vandalen bij Carthago
  at:451 text:451 [[Slag van Chalons]]
  at:454 text:454 [[Slag van Nedao]]
  at:455 text:455 Vandalen plunderen Rome
  at:476 text:476 laatste westelijke Keizer
  at:486 text:486 Rome verlaat Gallië
  at:626 text:626 Avaren plunderen [[Constantinopel]]
  at:681 text:681 Khan [[Asparuh]] erkend door Byzantium
  at:805 text:805 [[Franks]] vernietigen Avaren
  at:955 text:955 [[Slag van Lechfeld]]
| Lijst van premiers van Finland | top next |

First version by Nicklaarakkers on Monday, December 5, 2005, last update on Monday, July 10, 2006
==Hoofd van het Comité van Finse Zaken=={|border="1"
|-
| [[Mikhail Mikhailovitsj Speranskiy]] || [[1809]]-[[1811]]
|-
|}

==Staatssecretaris==
{|border="1"
|-
| [[Robert Hendrik Rehbinder]] || [[1811]]-[[1834]]
|-
|}

==Vice-voorzitters van de Economische Commissie van de Senaat==
{|border="2"
|-
| [[Carl Erik Mannerheim]] || [[1822]]-[[1826]]
|-
| [[Samuel Fredrik von Born]] (waarnemend) || [[1826]]-[[1828]]
|-
| [[Anders Henrik Falck]] || [[1828]]-[[1833]]
|-
| [[Gustaf Hjärne]] || [[1833]]-[[1841]]
|-
| [[Lars Gabriel von Haartman]] || [[1841]]-[[1858]]
|-
| [[Johan Mauritz Norderstam]] || [[1858]]-[[1882]] || Mil.
|-
| [[Edvard Gustaf af Forselles]] || [[1882]]-[[1885]] || Mil.
|-
| [[Samuel Werner von Troil]] || [[1885]]-[[1891]]
|-
| [[Sten Carl Tudeer]] || [[1891]]-[[1900]]
|-
| [[Constantin Linder]] || [[1900]]-[[1905]]
|-
| [[Emil Streng]] || [[1905]]
|-
| [[Leopold Henrik Stanislaus Mechelin]] || [[1905]]-[[1908]]
|-
| [[Edvard Immanuel Hjelt]] || [[1908]]-[[1909]] || [[Oud-Finse Partij|SP]]
|-
| [[August Johannes Hjelt]] || [[1909]] || SP
|-
| [[Vladimir Ivanovitsj Markov]] || [[1909]]-[[1913]] || Mil.
|-
| [[Mikhail Borovitinov]] || [[1913]]-[[1917]] || Mil.
|-
| [[Andrej Andrejevitsj Virenius]] || [[1917]] || Mil.
|-
| [[Oskari Tokoi]] || [[1917]] || [[Sociaal-Democratische Partij (Finland)|SDP]]
|-
| [[Eemil Nestor Setälä]] || [[1917]] || [[Jong-Finse Partij|NSP]]
|-
|}

==Premiers==
{|border="2"
|-
| [[Pehr Evind Svinhufvud|Pehr Evind Svinhufvud af Qvalstad]] (1x) || [[1917]]-[[1918]] || NSP/[[Nationale Coalitie Partij|KOK]]
|-
| [[Juho Kusti Paasikivi]] (1x) || [[1918]] || KOK
|-
| [[Lauri Ingman|Lauri Johannes Ingman]] (1x) || [[1918]]-[[1919]] || KOK
|-
| [[Kaarlo Castrén]] || [[1919]] || [[Nationale Progressieve Partij (Finland)|NPP]]
|-
| [[Juho Heikki Vennola]] (1x) || [[1919]]-[[1920]] || NPP
|-
| [[Rafael Waldemar Erich]] || [[1920]]-[[1921]] || KOK
|-
| [[Juho Heikki Vennola]] (2x) || [[1921]]-[[1922]] || NPP
|-
| [[Aimo Cajander|Aimo Kaarlo Cajander]] (1x) || [[1922]] || n/p
|-
| [[Kyösti Kallio]] (1x) || [[1922]]-[[1924]] || [[Finse Agrarische Partij|ML]]
|-
| [[Aimo Cajander|Aimo Kaarlo Cajander]] (2x) || [[1924]] || NPP
|-
| [[Lauri Ingman|Lauri Johannes Ingman]] (2x) || [[1924]]-[[1925]] || KOK
|-
| [[Antti Tulenheimo|Antti Agaton Tulenheimo]] || [[1925]] || KOK
|-
| [[Kyösti Kallio]] (2x) || [[1925]]-[[1926]] || ML
|-
| [[Väinö Tanner|Väinö Alfred Tanner]] || [[1926]]-[[1927]] || SDP
|-
| [[Juho Sunila|Juho Emil Sunila]] (1x) || [[1927]]-[[1928]] || ML
|-
| [[Oskari Mantere]] || [[1928]]-[[1929]] || NPP
|-
| [[Kyösti Kallio]] (3x) || [[1929]]-[[1930]] || ML
|-
| [[Pehr Evind Svinhufvud|Pehr Evind Svinhufvud af Qvalstad]] (2x) || [[1930]]-[[1931]] || KOK
|-
| [[Juho Heikki Vennola]] (3x) || [[1931]] || NPP
|-
| [[Juho Emil Sunila]] (2x) || [[1931]]-[[1932]] || ML
|-
| [[Toivo Mikael Kivimäki]] || [[1932]]-[[1936]] || NPP
|-
| [[Kyösti Kallio]] (4x) || [[1936]]-[[1937]] || ML
|-
| [[Aimo Cajander|Aimo Kaarlo Cajander]] (3x) || [[1937]]-[[1939]] || NPP
|-
| [[Risto Ryti|Risto Heikki Ryti]] || [[1939]]-[[1940]] || NPP
|-
| [[Karl Rudolf Walden]] (waarnemend) || [[1940]]-[[1941]] || Mil.
|-
| [[Johan Wilhelm Rangell]] || [[1941]]-[[1943]] || NPP
|-
| [[Edwin Linkomies|Edwin Johannes Hildegard Linkomies]] || [[1943]]-[[1944]] || KOK
|-
| [[Antti Hackzell|Antti Verner Hackzell]] || [[1944]] || KOK
|-
| [[Urho Jonas Castrén]] || [[1944]] || n/p
|-
| [[Juho Kusti Paasikivi]] (2x) || [[1944]]-[[1946]] || KOK
|-
| [[Mauno Pekkala]] || [[1946]]-[[1948]] || [[Finse Volksdemocratische Liga|SKDL]]
|-
| [[Karl-August Fagerholm]] (1x) || [[1948]]-[[1950]] || SDP
|-
| [[Urho Kekkonen]] (1x) || [[1950]]-[[1953]] || ML
|-
| [[Sakari Tuomioja|Sakari Severi Tuomioja]] || [[1953]]-[[1954]] || [[Vrijdenkersbond|VL]]
|-
| [[Ralf Johan Gustaf Törngren]] || [[1954]] || [[Zweedse Volkspartij|SFP]]
|-
| [[Urho Kekkonen]] (2x) || [[1954]]-[[1956]] || ML
|-
| [[Karl-August Fagerholm]] (2x) || [[1956]]-[[1957]] || SDP
|-
| [[Väinö Johannes Sukselainen]] (1x) || [[1957]] || ML
|-
| [[Berndt Rainer von Fieandt]] || [[1957]]-[[1958]] || n/p
|-
| [[Reino Iisakki Kuuskoski]] || [[1958]] || n/p
|-
| [[Karl-August Fagerholm]] (3x) || [[1958]]-[[1959]] || SDP
|-
| [[Vieno Johannes Sukselainen]] (2x) || [[1959]]-[[1961]] || ML
|-
| [[Eemil Luukka|Eemil Vihtori Luukka]] (waarnemend) || [[1961]] || ML
|-
| [[Martti Miettunen|Marrti Johannes Miettunen]] (1x) || [[1961]]-[[1962]] || ML
|-
| [[Ahti Karjalainen|Ahti Kalle Samuli Karjalainen]] (1x) || [[1962]]-[[1963]] || ML
|-
| [[Leino Ragnar Lehto]] || [[1963]]-[[1964]] || n/p
|-
| [[Johannes Virolainen]] || [[1964]]-[[1966]] || ML/[[Centrumpartij (Finland)|KESK]]
|-
| [[Rafael Paasio|Kuusta Rafael Paasio]] (1x) || [[1966]]-[[1968]] || SDP
|-
| [[Mauno Koivisto]] (1x) || [[1968]]-[[1970]] || SDP
|-
| [[Teuvo Aura|Teuvo Ensio Aura]] (1x) (waarnemend) || [[1970]] || n/p
|-
| [[Ahti Karjalainen|Ahti Kalle Samuli Karjalainen]] (2x) || [[1970]]-[[1971]] || KESK
|-
| [[Teuvo Aura|Teuvo Ensio Aura]] (2x) (waarnemend) || [[1971]]-[[1972]] || n/p
|-
| [[Rafael Paasio|Kuusta Rafael Paasio]] (2x) || [[1972]] || SDP
|-
| [[Kalevi Sorsa|Taisto Kalevi Sorsa]] (1x) || [[1972]]-[[1975]] || SDP
|-
| [[Keijo Liinamaa|Keijo Anfero Liinamaa]] (waarnemend) || [[1975]] || n/p
|-
| [[Martti Miettunen|Martti Johannes Miettunen]] (2x) || [[1975]]-[[1977]] || KESK
|-
| [[Kalevi Sorsa|Taisto Kalevi Sorsa]] (2x) || [[1977]]-[[1979]] || SDP
|-
| [[Mauno Koivisto]] (2x) || [[1979]]-[[1982]] || SDP
|-
| [[Enio Oskari Uusitalo]] (waarnemend voor Koivisto tot 27-1-1982) || [[1981]]-[[1982]] || KESK
|-
| [[Kalevi Sorsa|Taisto Kalevi Sorsa]] (3x) || [[1982]]-[[1987]] || SDP
|-
| [[Harri Holkeri|Harri Hermanni Holkeri]] || [[1987]]-[[1991]] || KOK
|-
| [[Esko Tapani Aho]] || [[1991]]-[[1995]] || KESK
|-
| [[Paavo Lipponen|Paavo Tapio Lipponen]] || [[1995]]-[[2003]] || SDP
|-
| [[Anneli Jäätteenmäki|Anneli Tuulikki Jäätteenmäki]] (v) || [[2003]] || KESK
|-
| [[Matti Vanhanen|Matti Taneli Vanhanen]] || sinds [[2003]] || KESK
|-
|}


'''Afkortingen:''' Mil.= militair - SP= [[Oud-Finse Partij]] (conservatief liberaal, nationalistisch) - SDP= [[Sociaal-Democratische Partij (Finland)]] (sociaal-democratisch) - NSP= [[Jong-Finse Partij]] (progressief liberaal, nationalistisch) - KOK= [[Nationale Coalitie Partij]] (conservatief) - NPP= [[Nationale Progressieve Partij (Finland)]] (progressief liberaal) - n/p= partijloos - ML= [[Finse Agrarische Partij]] (centrum) - SKDL= [[Finse Volksdemocratische Liga]] (communistisch/links-socialistisch) - VL= [[Vrijdenkersbond]] (liberaal) - SFP= [[Zweedse Volkspartij]] (Zweedstalige liberalen) - KESK= [[Centrumpartij (Finland)]] (centrum, voorzetting [[Finse Agrarische Partij]])

[[Categorie:Politiek in Finland]]
[[Categorie:Lijsten van premiers|Finland]]
| Lijst van staatshoofden van IJsland | top next |

Initial version by Nicklaarakkers on Thursday, December 29, 2005
ImageSize  = width:300 height:320
PlotArea   = width:250 height:300 left:50 bottom:10

DateFormat = yyyy
Period     = from:1944 till:2005
TimeAxis   = orientation:vertical
ScaleMajor = unit:year increment:5 start:1944

Define $dx = 25

PlotData=
  bar:Leaders color:blue width:25 mark:(line,white) align:left fontsize:S

  from:1944  till:1952 shift:($dx,0)   text:[[Sveinn Björnsson]]
  from:1952  till:1968 shift:($dx,0)   text:[[Ásgeir Ásgeirsson]]
  from:1968  till:1980 shift:($dx,0)   text:[[Kristján Eldjárn]]
  from:1980  till:1996 shift:($dx,0)   text:[[Vigdís Finnbogadóttir]]
  from:1996  till:end  shift:($dx,0)   text:[[Ólafur Ragnar Grímsson]]
| Kabinet-Grotewohl I | top next |
Initial version by Nicklaarakkers on Thursday, December 29, 2005
ImageSize  = width:824 height:226
PlotArea   = width:560 height:178 left:186 bottom:20
DateFormat = yyyy
Period     = from:1946 till:1990
TimeAxis   = orientation:horizontal
ScaleMajor = gridcolor:black unit:year increment:5 start:1950

BarData=
 bar:rvm text:"Voorzitter raad van ministers"
 bar:sg text:"Secretaris-generaal van de SED"

Colors=
  id:lightyellow value:rgb(1,1,0.4)

PlotData=
  color:lightyellow width:75 mark:(line,red) align:center fontsize:L shift:(0,0)
  # shift texts up or down manually to avoid overlap
  bar:rvm
  from:1949 till:1964 fontsize:M text:Otto Grotewohl
  from:1964 till:1973 shift:(0,-15) fontsize:M text:Willy Stoph
  from:1973 till:1976 shift:(0,13) fontsize:M  text:Horst~Sindermann
  from:1976 till:1989 shift:(0,-15) fontsize:M text:Willy Stoph
  from:1989 till:1990 shift:(0,17) fontsize:M text:Hans~Modrow
  from:1990 till:1990 shift:(20,-12) fontsize:M text:Lothar~de Maizière

  bar:sg color:red mark:(line,yellow) textcolor:white
  from:1946 till:1950 align:left shift:(-25,0) fontsize:M text:Wilhelm~Pieck
  from:1950 till:1971 fontsize:M text:Walter Ulbricht
  from:1971 till:1989 fontsize:M text:Erich Honecker
  from:1989 till:1989 align:left textcolor:black fontsize:M text:Egon~Krenz
| Template:Finland | top next |

Initial version by Migdejong on Sunday, February 19, 2006
#
#
#
ImageSize  = width:750 height:120
PlotArea   = left:75 bottom:20 width:600 height:50
AlignBars  = early

DateFormat = yyyy
Period     = from:1917 till:2005
TimeAxis   = orientation:horizontal
ScaleMajor = unit:year increment:10 start:1917

Colors =
  id:grey  value:gray(0.7)

PlotData=
  bar:Leaders color:red width:25 mark:(line,grey) align:left fontsize:S shift:(0,-40)
  from:1917 till:1917 color:blue
  from:1918 till:1918 color:grey
  from:1919 till:1919 color:black
  from:1939 till:1940 color:purple
  from:1941 till:1944 color:drabgreen
  from:1948 till:1948 color:yellow
  from:1956 till:1982 color:lavender
  from:1995 till:1995 color:teal

  shift:(-10,20) textcolor:blue
  at:1917 mark:(line,blue) text:1917 Onafhankelijkheid
  shift:(-10,42) textcolor:grey
  at:1918 mark:(line,grey) text:1918 Burgeroorlog
  shift:(-10,64) textcolor:black
  at:1919 mark:(line,black) text:1919 Rep. Finland
  shift:(-10,20) textcolor:purple
  at:1939 mark:(line,purple) text:1939-1940 Winteroorlog
  shift:(-10,42) textcolor:drabgreen
  at:1941 mark:(line,drabgreen) text:1941-1944 Vervolgoorlog
  shift:(-10,64) textcolor:yellow
  at:1948 mark:(line,yellow) text:1948 YYA-verdrag
  shift:(-11,20) textcolor:lavender
  at:1956 mark:(line,lavender) text:1956-1982 Periode Kekkonen
  shift:(-11,20) textcolor:teal
  at:1995 mark:(line,teal) text:1995 Lid EU
| Kabinet-Grotewohl II | top next |
Initial version by Nicklaarakkers on Sunday, January 1, 2006
ImageSize  = width:824 height:226
PlotArea   = width:560 height:178 left:186 bottom:20
DateFormat = yyyy
Period     = from:1946 till:1990
TimeAxis   = orientation:horizontal
ScaleMajor = gridcolor:black unit:year increment:5 start:1950

BarData=
 bar:rvm text:"Voorzitter raad van ministers"
 bar:sg text:"Secretaris-generaal van de SED"

Colors=
  id:lightyellow value:rgb(1,1,0.4)

PlotData=
  color:lightyellow width:75 mark:(line,red) align:center fontsize:L shift:(0,0)
  # shift texts up or down manually to avoid overlap
  bar:rvm
  from:1949 till:1964 fontsize:M text:Otto Grotewohl
  from:1964 till:1973 shift:(0,-15) fontsize:M text:Willy Stoph
  from:1973 till:1976 shift:(0,13) fontsize:M  text:Horst~Sindermann
  from:1976 till:1989 shift:(0,-15) fontsize:M text:Willy Stoph
  from:1989 till:1990 shift:(0,17) fontsize:M text:Hans~Modrow
  from:1990 till:1990 shift:(20,-12) fontsize:M text:Lothar~de Maizière

  bar:sg color:red mark:(line,yellow) textcolor:white
  from:1946 till:1950 align:left shift:(-25,0) fontsize:M text:Wilhelm~Pieck
  from:1950 till:1971 fontsize:M text:Walter Ulbricht
  from:1971 till:1989 fontsize:M text:Erich Honecker
  from:1989 till:1989 align:left textcolor:black fontsize:M text:Egon~Krenz
| Template:Fascisme in Nederland | top next |
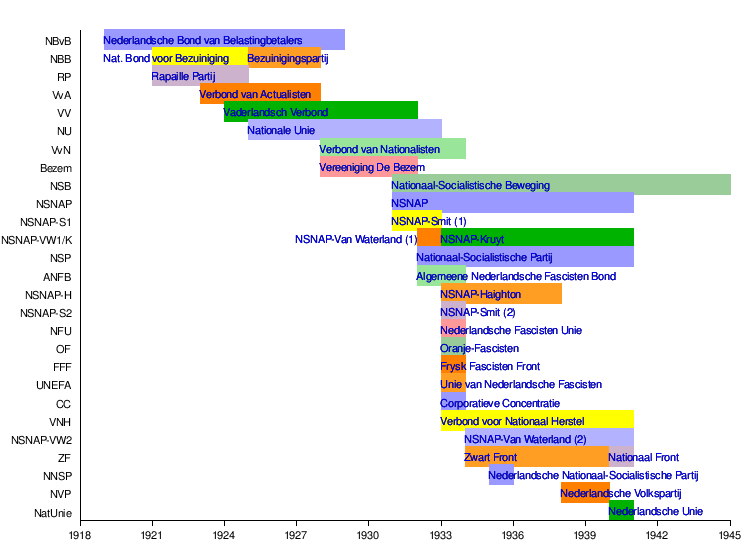
First version by Willem Huberts on Friday, January 6, 2006, last update on Tuesday, April 4, 2006
ImageSize  = width:750 height:550
PlotArea   = left:80 right:20 top:30 bottom:30
TimeAxis   = orientation:horizontal
DateFormat = yyyy

Period     = from:1918 till:1945
AlignBars  = early
ScaleMajor = unit:year increment:3 start:1918


Colors =
    id:NBvB value:rgb(1,0.7,0.7) # light red
    id:NBB value:rgb(1,0.7,0.7) # light red
    id:RP value:rgb(1,0.7,0.7) # light red
    id:VvA value:rgb(1,0.7,0.7) # light red
    id:VV value:rgb(1,0.7,0.7) # light red
    id:NU value:rgb(1,0.7,0.7) # light red
    id:VvN value:rgb(1,0.7,0.7) # light red
    id:Bezem value:rgb(1,0.7,0.7) # light red
    id:NSB value:rgb(1,0.7,0.7) # light red
    id:NSNAP value:rgb(1,0.7,0.7) # light red
    id:NSNAP-S1 value:rgb(1,0.7,0.7) # light red
    id:NSNAP-H value:rgb(1,0.7,0.7) # light red
    id:NSNAP-S2 value:rgb(1,0.7,0.7) # light red
    id:NSNAP-VW/K value:rgb(1,0.7,0.7) # light red
    id:NSNAP-VW2 value:rgb(1,0.7,0.7) # light red
    id:ANFB value:rgb(1,0.7,0.7) # light red
    id:NFU value:rgb(1,0.7,0.7) # light red
    id:OF value:rgb(1,0.7,0.7) # light red
    id:UNEFA value:rgb(1,0.7,0.7) # light red
    id:FFF value:rgb(1,0.7,0.7) # light red
    id:CC value:rgb(1,0.7,0.7) # light red
    id:VNH value:rgb(1,0.7,0.7) # light red
    id:ZF value:rgb(1,0.7,0.7) # light red
    id:NVP value:rgb(1,0.7,0.7) # light red
    id:NatUnie value:rgb(1,0.7,0.7) # light red
    id:NSP value:rgb(1,0.7,0.7) # light red
    id:NNSPUnie value:rgb(1,0.7,0.7) # light red

Define $dx=-3

PlotData =
  bar:NBvB width:20 color:red shift:($dx,-20)
  from:1919 till:1929  color:powderblue
  at:1919 text:" [[Nederlandsche Bond van Belastingbetalers]]" shift:($dx,-5)

  bar:NBB width:20 color:red shift:($dx,-20)
  from:1921 till:1925  color:yellow
  from:1925 till:1928  color:orange
  at:1919 text:" [[Nationale Bond voor Bezuiniging|Nat. Bond voor Bezuiniging]]" shift:($dx,-5)
  at:1925 text:" [[Bezuinigingspartij]]" shift:($dx,-5)

  bar:RP width:20 color:red shift:($dx,-20)
  from:1921 till:1925  color:lavender
  at:1921 text:" [[Rapaille Partij]]" shift:($dx,-5)

  bar:VvA width:20 color:red shift:($dx,-20)
  from:1923 till:1928  color:redorange
  at:1923 text:" [[Verbond van Actualisten]]" shift:($dx,-5)

  bar:VV width:20 color:red shift:($dx,-20)
  from:1924 till:1932  color:green
  at:1924 text:" [[Vaderlandsch Verbond]]" shift:($dx,-5)

  bar:NU width:20 color:red shift:($dx,-20)
  from:1925 till:1933  color:powderblue2
  at:1925 text:" [[Nationale Unie (Nederland)|Nationale Unie]]" shift:($dx,-5)

  bar:VvN width:20 color:red shift:($dx,-20)
  from:1928 till:1934  color:yellowgreen
  at:1928 text:" [[Verbond van Nationalisten]]" shift:($dx,-5)

  bar:Bezem width:20 color:red shift:($dx,-20)
  from:1928 till:1932  color:coral
  at:1928 text:" [[Vereeniging De Bezem]]" shift:($dx,-5)

  bar:NSB width:20 color:red shift:($dx,-20)
  from:1931 till:1945  color:drabgreen
  at:1931 text:" [[Nationaal-Socialistische Beweging]]" shift:($dx,-5)

  bar:NSNAP width:20 color:red shift:($dx,-20)
  from:1931 till:1941  color:powderblue
  at:1931 text:" [[NSNAP]]" shift:($dx,-5)

  bar:NSNAP-S1 width:20 color:red shift:($dx,-20)
  from:1931 till:1933  color:yellow
  at:1931 text:" [[NSNAP|NSNAP-Smit (1)]]" shift:($dx,-5)

  bar:NSNAP-VW1/K width:20 color:red shift:($dx,-20)
  from:1932 till:1933  color:redorange
  from:1933 till:1941  color:green
  at:1927 text:" [[NSNAP|NSNAP-Van Waterland (1)]]" shift:($dx,-5)
  at:1933 text:" [[NSNAP|NSNAP-Kruyt]]" shift:($dx,-5)

  bar:NSP width:20 color:red shift:($dx,-20)
  from:1932 till:1941  color:powderblue
  at:1932 text:" [[Nationaal-Socialistische Partij]]" shift:($dx,-5)

  bar:ANFB width:20 color:red shift:($dx,-20)
  from:1932 till:1934  color:yellowgreen
  at:1932 text:" [[Algemeene Nederlandsche Fascisten Bond]]" shift:($dx,-5)

  bar:NSNAP-H width:20 color:red shift:($dx,-20)
  from:1933 till:1938  color:orange
  at:1933 text:" [[NSNAP|NSNAP-Haighton]]" shift:($dx,-5)

  bar:NSNAP-S2 width:20 color:red shift:($dx,-20)
  from:1933 till:1934  color:lavender
  at:1933 text:" [[NSNAP|NSNAP-Smit (2)]]" shift:($dx,-5)

  bar:NFU width:20 color:red shift:($dx,-20)
  from:1933 till:1934  color:coral
  at:1933 text:" [[Nederlandsche Fascisten Unie]]" shift:($dx,-5)

  bar:OF width:20 color:red shift:($dx,-20)
  from:1933 till:1934  color:drabgreen
  at:1933 text:" [[Oranje-Fascisten]]" shift:($dx,-5)

  bar:FFF width:20 color:red shift:($dx,-20)
  from:1933 till:1934  color:redorange
  at:1933 text:" [[Frysk Fascisten Front]]" shift:($dx,-5)

  bar:UNEFA width:20 color:red shift:($dx,-20)
  from:1933 till:1934  color:orange
  at:1933 text:" [[Unie van Nederlandsche Fascisten]]" shift:($dx,-5)

  bar:CC width:20 color:red shift:($dx,-20)
  from:1933 till:1934  color:powderblue
  at:1933 text:" [[Corporatieve Concentratie]]" shift:($dx,-5)

  bar:VNH width:20 color:red shift:($dx,-20)
  from:1933 till:1941  color:yellow
  at:1933 text:" [[Verbond voor Nationaal Herstel]]" shift:($dx,-5)

  bar:NSNAP-VW2 width:20 color:red shift:($dx,-20)
  from:1934 till:1941  color:powderblue2
  at:1934 text:" [[NSNAP|NSNAP-Van Waterland (2)]]" shift:($dx,-5)

  bar:ZF width:20 color:red shift:($dx,-20)
  from:1934 till:1940  color:orange
  from:1940 till:1941  color:lavender
  at:1934 text:" [[Zwart Front]]" shift:($dx,-5)
  at:1940 text:" [[Zwart Front|Nationaal Front]]" shift:($dx,-5)

  bar:NNSP width:20 color:red shift:($dx,-20)
  from:1935 till:1936  color:powderblue
  at:1935 text:" [[Nederlandsche Nationaal-Socialistische Partij]]" shift:($dx,-5)

  bar:NVP width:20 color:red shift:($dx,-20)
  from:1938 till:1940  color:redorange
  at:1938 text:" [[Nederlandsche Volkspartij]]" shift:($dx,-5)

  bar:NatUnie width:20 color:red shift:($dx,-20)
  from:1940 till:1941  color:green
  at:1940 text:" [[Nederlandsche Unie]]" shift:($dx,-5)
| Sint-Jan-in-Eremo | top next |

First version by Westermarck on Saturday, April 15, 2006, last update on Saturday, July 29, 2006
ImageSize  = width:500 height:250
PlotArea   = left:40 right:10 top:10 bottom:20
TimeAxis   = orientation:horizontal
AlignBars  = justify
Colors =
    id:a value:gray(0.9)
    id:b value:rgb(0,0,0)

DateFormat = yyyy
Period     = from:1800 till:2020
ScaleMajor = unit:year increment:20 start:1800

PlotData =
  bar:1200 color:a width:1
  from:start till:end
  bar:1000 color:a
  from:start till:end
  bar:800 color:a
  from:start till:end
  bar:600 color:a
  from:start till:end
  bar:400 color:a
  from:start till:end
  bar:200 color:a
  from:start till:end
  bar:0 color:a


LineData =
  layer:front
  points:(52,142)(73,144)         color:b    width:1
  points:(73,144)(102,153)        color:b    width:1
  points:(102,153)(134,174)       color:b    width:1
  points:(134,174)(155,161)       color:b    width:1
  points:(155,161)(175,158)       color:b    width:1
  points:(175,158)(196,170)       color:b    width:1
  points:(196,170)(204,178)       color:b    width:1
  points:(204,178)(225,181)       color:b    width:1
  points:(225,181)(245,184)       color:b    width:1
  points:(245,184)(266,180)       color:b    width:1
  points:(266,180)(286,187)       color:b    width:1
  points:(286,187)(307,196)       color:b    width:1
  points:(307,196)(341,200)       color:b    width:1
  points:(341,200)(370,190)       color:b    width:1
  points:(370,190)(389,190)       color:b    width:1
  points:(389,190)(401,183)       color:b    width:1
  points:(401,183)(421,186)       color:b    width:1
  points:(421,186)(427,197)       color:b    width:1
  points:(427,197)(440,215)       color:b    width:1
  points:(440,215)(446,213)       color:b    width:1
  points:(446,213)(458,212)       color:b    width:1
| Franse Nationale Vergadering | top next |

First version by Nicklaarakkers on Saturday, January 14, 2006, last update on Friday, January 27, 2006
ImageSize  = width:350 height:350
PlotArea   = width:250 height:250 left:50 bottom:20
AlignBars  = justify

DateFormat = yyyy
Period     = from:0 till:575
TimeAxis   = orientation:vertical
ScaleMajor = unit:year increment:25 start:0

PlotData=
  bar:Zetels  color:coral width:30   mark:(line,white) align:left fontsize:S
  bar:UMP     color:blue  from:start till:357 text:357
  bar:PS      color:red       from:start till:140 text:140
  bar:UDF     color:yellow  from:start till:29  text:29
  bar:PCF     color:red        from:start till:11  text:11
  bar:PRG     color:skyblue       from:start till:7   text:7
  bar:overige color:kelleygreen      from:start till:12  text:12
| Union pour la Démocratie Française | top next |

Initial version by Nicklaarakkers on Sunday, January 15, 2006
ImageSize  = width:350 height:350
PlotArea   = width:250 height:250 left:50 bottom:20
AlignBars  = justify

DateFormat = yyyy
Period     = from:25 till:577
TimeAxis   = orientation:vertical

ScaleMajor = unit:year increment:25 start:25

PlotData=
  bar:Zetels color:yellow width:30   mark:(line,white) align:left fontsize:S
  bar:1978 from:start till:112 text:112
  bar:1981 from:start till:53 text:53
  bar:1986 from:start till:127 text:127
  bar:1988 from:start till:129 text:129
  bar:1993 from:start till:213 text:213
  bar:1997 from:start till:108 text:108
  bar:2002 color:yellow  from:start till:29 text:29
| Assembleia da República (Portugal) | top next |

Initial version by Nicklaarakkers on Friday, January 27, 2006
ImageSize  = width:350 height:350
PlotArea   = width:250 height:250 left:50 bottom:20
AlignBars  = justify

DateFormat = yyyy
Period     = from:0 till:230
TimeAxis   = orientation:vertical
ScaleMajor = unit:year increment:10 start:0

PlotData=
  bar:Zetels  color:coral width:30   mark:(line,white) align:left fontsize:S
  bar:PS      color:red        from:start till:121 text:121
  bar:PSD     color:orange      from:start till:75 text:75
  bar:CDU      color:red        from:start till:14  text:14
  bar:PP      color:yellow      from:start till:12  text:12
  bar:BE     color:black      from:start till:8   text:8
| Tijdlijn Eerste Portugese republiek | top next |

Initial version by Nicklaarakkers on Thursday, February 2, 2006
ImageSize  = width:700 height:100
PlotArea   = left:40 right:30 top:30 bottom:30
TimeAxis   = orientation:horizontal
DateFormat = yyyy
Period     = from:1811 till:2000
AlignBars  = early
ScaleMajor = unit:year increment:20 start:1850
Colors =
  id:gray value:gray(0.7)

Define $dx=-3

PlotData =
  bar:events width:25 color:red shift:($dx,-20)

  from:1811 till:1910  color:green
  from:1910 till:1926  color:yellow
  from:1926 till:1933  color:white
  from:1933 till:1974  color:blue
  from:1974 till:2000  color:pink

  at:1840 text:" Laatste eeuw koninkrijk Portugal" shift:($dx,-5)
  at: 1912 text:" 1e Rep." shift:($dx,-5)
  at: 1926 text:" Mil." shift:($dx,-5)
  at: 1945 text:" Estado Novo"  shift:($dx,-5)
  at: 1978 text:" 2e Republiek" shift:($dx,-5)
| Tijdlijn Ditadura Nacional | top next |
Initial version by Nicklaarakkers on Friday, February 3, 2006
ImageSize  = width:700 height:100
PlotArea   = left:40 right:30 top:30 bottom:30
TimeAxis   = orientation:horizontal
DateFormat = yyyy
Period     = from:1811 till:2000
AlignBars  = early
ScaleMajor = unit:year increment:20 start:1850
Colors =
  id:gray value:gray(0.7)

Define $dx=-3

PlotData =
  bar:events width:25 color:red shift:($dx,-20)

  from:1811 till:1910  color:green
  from:1910 till:1926  color:yellow
  from:1926 till:1933  color:white
  from:1933 till:1974  color:blue
  from:1974 till:2000  color:pink

  at:1840 text:" Laatste eeuw koninkrijk Portugal" shift:($dx,-5)
  at: 1912 text:" 1e Rep." shift:($dx,-5)
  at: 1926 text:" Mil." shift:($dx,-5)
  at: 1945 text:" Estado Novo"  shift:($dx,-5)
  at: 1978 text:" 2e Republiek" shift:($dx,-5)
| Castell-Platja d'Aro | top next |

Initial version by Zonneschijn on Tuesday, July 4, 2006
Colors=
  id:a value:gray(0.9)
  id:b value:gray(0.7)
  id:c value:rgb(1,1,1)
  id:d value:rgb(0.6,0.7,0.8)

ImageSize  = width:500 height:373
PlotArea   = left:50 bottom:30 top:30 right:30
DateFormat = x.y
Period     = from:0 till:10000
TimeAxis   = orientation:vertical
AlignBars  = justify
ScaleMajor = gridcolor:b increment:1250 start:0
ScaleMinor = gridcolor:a increment:250 start:0
BackgroundColors = canvas:c

BarData=
  bar:1900 text:1900
  bar:1910 text:1910
  bar:1920 text:1920
  bar:1930 text:1930
  bar:1940 text:1940
  bar:1950 text:1950
  bar:1960 text:1960
  bar:1970 text:1970
  bar:1981 text:1981
  bar:1991 text:1991
  bar:2001 text:2001
  bar:2005 text:2005

PlotData=
  color:d width:20 align:left

  bar:1900 from:0 till: 1185
  bar:1910 from:0 till: 1208
  bar:1920 from:0 till: 1182
  bar:1930 from:0 till: 1128
  bar:1940 from:0 till: 1088
  bar:1950 from:0 till: 1125
  bar:1960 from:0 till: 1358
  bar:1970 from:0 till: 2473
  bar:1981 from:0 till: 3774
  bar:1991 from:0 till: 4785
  bar:2001 from:0 till: 6806
  bar:2005 from:0 till: 9239

PlotData=

  bar:1900 at: 1185 fontsize:s text: 1185 shift:(-10,5)
  bar:1910 at: 1208 fontsize:s text: 1208 shift:(-10,5)
  bar:1920 at: 1182 fontsize:s text: 1182 shift:(-10,5)
  bar:1930 at: 1128 fontsize:s text: 1128 shift:(-10,5)
  bar:1940 at: 1088 fontsize:S text: 1088 shift:(-10,5)
  bar:1950 at: 1125 fontsize:S text: 1125 shift:(-10,5)
  bar:1960 at: 1358 fontsize:S text: 1358 shift:(-10,5)
  bar:1970 at: 2473 fontsize:S text: 2473 shift:(-10,5)
  bar:1981 at: 3774 fontsize:S text: 3774 shift:(-10,5)
  bar:1991 at: 4785 fontsize:S text: 4785 shift:(-10,5)
  bar:2001 at: 6806 fontsize:S text: 6806 shift:(-10,5)
  bar:2005 at: 9239 fontsize:S text: 9239 shift:(-10,5)
| Zuidschote | top next |

Initial version by Zonneschijn on Monday, July 10, 2006
Colors=
  id:a value:gray(0.9)
  id:b value:gray(0.7)
  id:c value:rgb(1,1,1)
  id:d value:rgb(0.6,0.7,0.8)

ImageSize  = width:700 height:373
PlotArea   = left:50 bottom:30 top:30 right:30
DateFormat = x.y
Period     = from:0 till:800
TimeAxis   = orientation:vertical
AlignBars  = justify
ScaleMajor = gridcolor:b increment:100 start:0
ScaleMinor = gridcolor:a increment:20 start:0
BackgroundColors = canvas:c

BarData=
  bar:1806 text:1806
  bar:1816 text:1816
  bar:1830 text:1830
  bar:1846 text:1846
  bar:1856 text:1856
  bar:1866 text:1866
  bar:1876 text:1876
  bar:1880 text:1880
  bar:1890 text:1890
  bar:1900 text:1900
  bar:1910 text:1910
  bar:1920 text:1920
  bar:1930 text:1930
  bar:1947 text:1947
  bar:1961 text:1961
  bar:1970 text:1970
  bar:1981 text:1981
  bar:1991 text:1991
  bar:1999 text:1999

PlotData=
  color:d width:20 align:left

  bar:1806 from:0 till: 567
  bar:1816 from:0 till: 540
  bar:1830 from:0 till: 570
  bar:1846 from:0 till: 582
  bar:1856 from:0 till: 564
  bar:1866 from:0 till: 579
  bar:1876 from:0 till: 555
  bar:1880 from:0 till: 564
  bar:1890 from:0 till: 651
  bar:1900 from:0 till: 631
  bar:1910 from:0 till: 559
  bar:1920 from:0 till: 270
  bar:1930 from:0 till: 471
  bar:1947 from:0 till: 425
  bar:1961 from:0 till: 418
  bar:1970 from:0 till: 394
  bar:1981 from:0 till: 407
  bar:1991 from:0 till: 373
  bar:1999 from:0 till: 308

PlotData=

  bar:1806 at: 567 fontsize:s text: 567 shift:(-10,5)
  bar:1816 at: 540 fontsize:S text: 540 shift:(-10,5)
  bar:1830 at: 570 fontsize:S text: 570 shift:(-10,5)
  bar:1846 at: 582 fontsize:S text: 582 shift:(-10,5)
  bar:1856 at: 564 fontsize:S text: 564 shift:(-10,5)
  bar:1866 at: 579 fontsize:S text: 579 shift:(-10,5)
  bar:1876 at: 555 fontsize:S text: 555 shift:(-10,5)
  bar:1880 at: 564 fontsize:S text: 564 shift:(-10,5)
  bar:1890 at: 651 fontsize:S text: 651 shift:(-10,5)
  bar:1900 at: 631 fontsize:S text: 631 shift:(-10,5)
  bar:1910 at: 559 fontsize:S text: 559 shift:(-10,5)
  bar:1920 at: 270 fontsize:S text: 270 shift:(-10,5)
  bar:1930 at: 471 fontsize:S text: 471 shift:(-10,5)
  bar:1947 at: 425 fontsize:S text: 425 shift:(-10,5)
  bar:1961 at: 418 fontsize:S text: 418 shift:(-10,5)
  bar:1970 at: 394 fontsize:S text: 394 shift:(-10,5)
  bar:1981 at: 407 fontsize:S text: 407 shift:(-10,5)
  bar:1991 at: 373 fontsize:S text: 373 shift:(-10,5)
  bar:1999 at: 308 fontsize:S text: 308 shift:(-10,5)
| Lindlar | top next |

Initial version by Bramvr on Tuesday, February 14, 2006
ImageSize  = width:550 height:120
PlotArea   = width:450 height:80 left:50 bottom:20
AlignBars  = late

DateFormat = yyyy
Period     = from:0 till:30000
TimeAxis   = orientation:vertical
ScaleMajor = unit:year increment:10000 start:0

PlotData=
  color:blue width:10
  bar:1816 from:start till:5050
  bar:1825 from:start till:5406
  bar:1828 from:start till:5430
  bar:1890 from:start till:6292
  bar:1922 from:start till:6670
  bar:1938 from:start till:6939
  bar:1946 from:start till:10339
  bar:1958 from:start till:11069
  bar:1968 from:start till:12837
  bar:1974 from:start till:13831
  bar:1990 from:start till:19307
  bar:1992 from:start till:19800
  bar:1995 from:start till:20945
  bar:1999 from:start till:21750
  bar:2002 from:start till:22581
  bar:2003 from:start till:22646
  bar:2004 from:start till:22714

TextData=
  pos:(20,110) fontsize:M text:
| Template:Volksopvoeding tijdlijn | top next |

First version by Effeietsanders ? on Tuesday, February 14, 2006, last update on Tuesday, July 25, 2006
ImageSize = width:840 height:100
PlotArea  = left:50 right:50 bottom:20 top:5
AlignBars = early

Colors =
  id:neo   value:rgb(0.99215,0.8,0.54)
  id:paleo value:rgb(1,0.7019,0)
  id:ceno   value:rgb(1,1,0)
  id:holo   value:rgb(1,1,0.702)
  id:paleoc    value:rgb(0.92,0.576,0.005)

Period     = from:1780 till:1848
TimeAxis   = orientation:horizontal
ScaleMajor = unit:year increment:5 start:1780
ScaleMinor = unit:year increment:1  start:1780

BarData =
  bar:toplevel
  bar:midlevel
  bar:events

PlotData=
  align:center textcolor:black fontsize:8 mark:(line,black) width:25 shift:(0,-5)

  bar:toplevel
  from: 1780  till: 1795  text:Eindfase_van_de_Republiek color: holo
  from: 1795  till: 1813  text:[[Franse tijd in Nederland|Franse_tijd]] color: holo
  from: 1813  till: 1848  text:Koninkrijk_Nederland_o.l.v._Willem_I color: holo

  bar:midlevel
  from: 1795  till: 1806  text:[[Bataafse_Republiek|Bataafse]]~[[Bataafse_Republiek|Republiek]] color: ceno shift:(-10,0)
  from: 1806  till: 1810  text:[[Koninkrijk_Holland|Koninkrijk]]~[[Koninkrijk_Holland|Holland]] color: neo
  from: 1815  till: 1830  text:Koninkrijk_met_België color: paleoc
  from: 1837  till: 1848  text:Liberale_oppositie color: neo

  bar:events
  at: 1784  text:[[Maatschappij_tot_Nut_van_t_Algemeen]]
  at: 1806  text:[[Schoolwet_van_1806]]
  at: 1848  text:Nieuwe_grondwet
| Template:Volksopvoeding tijdlijn | top next |

First version by Effeietsanders ? on Tuesday, February 14, 2006, last update on Tuesday, July 25, 2006
ImageSize = width:840 height:200
PlotArea  = left:50 right:50 bottom:20 top:5
AlignBars = early

Colors =
  id:neo   value:rgb(0.99215,0.8,0.54)
  id:paleo value:rgb(1,0.7019,0)
  id:ceno   value:rgb(1,1,0)
  id:holo   value:rgb(1,1,0.702)
  id:paleoc    value:rgb(0.92,0.576,0.005)

Period     = from:1848 till:1920
TimeAxis   = orientation:horizontal
ScaleMajor = unit:year increment:5 start:1848
ScaleMinor = unit:year increment:1  start:1848

BarData =
  bar:alevel
  bar:blevel
  bar:clevel
  bar:events1
  bar:events2

PlotData=
  align:center textcolor:black fontsize:8 mark:(line,black) width:25 shift:(0,-5)

  bar:alevel
  from: 1848  till: 1888  text:Liberale_heerschappij color: holo

  bar:blevel
  from: 1850  till: 1874  text:Groeiende_zorg_over_kinderarbeid color: paleoc
  from: 1882  till: 1896  text:Landbouw_crisis color: paleoc

  bar:clevel
  from: 1865  till: 1913  text:Krachtige_economische_groei color: holo

  bar:events1 fontsize: S
  at: 1857  text:[[Schoolwet_van_1857]]
  at: 1878  text:[[Schoolwet_van_1878]]
  at: 1889  text:[[Arbeidswet]] shift:(-10,0)
  at: 1892  text: ~stichting_Gereformeerde_Kerk

  bar:events2 fontsize: S
  at: 1874  text:[[Kinderwetje_van_Van_Houten|Kinderwetje]]~[[Kinderwetje_van_Van_Houten|van_Van_Houten]] shift:(-15,0)
  at: 1879  text:ARP shift:(-15,0)
  at: 1887  text:eerste~kiesrechtuitbreiding shift:(-15,0)
  at: 1919  text:algemeen_kiesrecht
| Template:Volksopvoeding tijdlijn2 | top next |

First version by Riddergraniet on Tuesday, February 14, 2006, last update on Tuesday, July 25, 2006
ImageSize  = width:200 height:800
PlotArea   = left:50 bottom:10 top:10 right:0
AlignBars  = early

Colors =
  id:neo   value:rgb(0.99215,0.8,0.54)
  id:paleo value:rgb(1,0.7019,0)
  id:ceno   value:rgb(1,1,0)
  id:holo   value:rgb(1,1,0.702)
  id:paleoc    value:rgb(0.92,0.576,0.005)

Period     = from:1780 till:1850
TimeAxis   = orientation:vertical
ScaleMajor = unit:year increment:10 start:1780
ScaleMinor = unit:year increment:1  start:1780

BarData =
  bar:toplevel
  bar:midlevel
  bar:events

PlotData=
  align:center textcolor:black fontsize:8 mark:(line,black) width:25 shift:(0,-5)

  bar:toplevel
  from: 1780  till: 1795  text:Eindfase_van_de_Republiek color: holo
  from: 1795  till: 1813  text:[[Franse tijd in Nederland|Franse_tijd]] color: holo
  from: 1813  till: 1848  text:Koninkrijk_Nederland~o.l.v._Willem_I color: holo shift:(0,10)

  bar:midlevel
  from: 1795  till: 1806  text:[[Bataafse_Republiek|Bataafse]]~[[Bataafse_Republiek|Republiek]] color: ceno
  from: 1806  till: 1810  text:[[Koninkrijk_Holland|Koninkrijk]]~[[Koninkrijk_Holland|Holland]] color: neo
  from: 1815  till: 1830  text:Koninkrijk~met~België color: paleoc
  from: 1837  till: 1848  text:Liberale_oppositie color: neo

  bar:events
  at: 1784  text:[[Maatschappij_tot_Nut_van_t_Algemeen|Maatschappij_tot_Nut]]~[[Maatschappij_tot_Nut_van_t_Algemeen|van_'t_Algemeen]] shift:(-15,0)
  at: 1806  text:[[Schoolwet_van_1806|Schoolwet_van]]~[[Schoolwet_van_1806|1806]]
  at: 1848  text:Nieuwe~grondwet
| Geschiedenis van Finland | top next |
Initial version by Nicklaarakkers on Thursday, December 29, 2005
#
#
#
ImageSize  = width:750 height:120
PlotArea   = left:75 bottom:20 width:600 height:50
AlignBars  = early

DateFormat = yyyy
Period     = from:1917 till:2005
TimeAxis   = orientation:horizontal
ScaleMajor = unit:year increment:10 start:1917

Colors =
  id:grey  value:gray(0.7)

PlotData=
  bar:Leaders color:red width:25 mark:(line,grey) align:left fontsize:S shift:(0,-40)
  from:1917 till:1917 color:blue
  from:1918 till:1918 color:grey
  from:1919 till:1919 color:black
  from:1939 till:1940 color:purple
  from:1941 till:1944 color:drabgreen
  from:1948 till:1948 color:yellow
  from:1956 till:1982 color:lavender
  from:1995 till:1995 color:teal

  shift:(-10,20) textcolor:blue
  at:1917 mark:(line,blue) text:1917 Onafhankelijkheid
  shift:(-10,42) textcolor:grey
  at:1918 mark:(line,grey) text:1918 Burgeroorlog
  shift:(-10,64) textcolor:black
  at:1919 mark:(line,black) text:1919 Rep. Finland
  shift:(-10,20) textcolor:purple
  at:1939 mark:(line,purple) text:1939-1940 Winteroorlog
  shift:(-10,42) textcolor:drabgreen
  at:1941 mark:(line,drabgreen) text:1941-1944 Vervolgoorlog
  shift:(-10,64) textcolor:yellow
  at:1948 mark:(line,yellow) text:1948 YYA-verdrag
  shift:(-11,20) textcolor:lavender
  at:1956 mark:(line,lavender) text:1956-1982 Periode Kekkonen
  shift:(-11,20) textcolor:teal
  at:1995 mark:(line,teal) text:1995 Lid EU
| Template:TijdlijnEgyptologie | top next |

First version by Juni on Monday, February 20, 2006, last update on Friday, April 7, 2006
ImageSize  = width:550 height:178
PlotArea   = width:450 height:158 left:100 bottom:20
DateFormat = yyyy
Period     = from:-3200 till:-330
TimeAxis   = orientation:horizontal
ScaleMajor = gridcolor:black unit:year increment:500 start:-3000

BarData=
 bar:vrt text:[[Vroege Tijd]]
 bar:odr text:[[Oude Rijk]]
 bar:1tp text:[[Eerste tussentijd]]
 bar:mdr text:[[Middenrijk (Egypte)|Middenrijk]]
 bar:2tp text:[[Tweede tussentijd]]
 bar:nwr text:[[Nieuwe Rijk]]
 bar:3tp text:[[Derde tussentijd]]
 bar:lpd text:[[Late Periode]]

Colors=
  id:lightyellow value:rgb(1,1,0.4)

PlotData=
  color:kelleygreen width:25 mark:(line,black) align:center fontsize:S shift:(0,0)
  # shift texts up or down manually to avoid overlap
  bar:vrt color:kelleygreen mark:(line,black) textcolor:black
  from:-3200 till:-3100 fontsize:S text:[[Naqada (predynastieke periode)|0]]
  from:-3100 till:-2900 fontsize:S text:[[Egypte I|1]]
  from:-2900 till:-2700 fontsize:S text:[[Egypte II|2]]


  bar:odr color:yellow mark:(line,black) textcolor:white
  from:-2700 till:-2600 fontsize:S  text:[[Egypte III|3]]
  from:-2600 till:-2500 fontsize:S text:[[Egypte IV|4]]
  from:-2500 till:-2350 fontsize:S text:[[Egypte V|5]]
  from:-2340 till:-2180 fontsize:S text:[[Egypte VI|6]]

  bar:1tp color:skyblue mark:(line,black) textcolor:white
  from:-2180 till:-2160 fontsize:S text:
  from:-2160 till:-2050 fontsize:S text:[[Eerste Tussentijd|7-10]]

  bar:mdr color:red mark:(line,black) textcolor:white
  from:-2050 till:-1990 fontsize:S text:[[Egypte XI|11]]
  from:-1990 till:-1800 fontsize:S text:[[Egypte XII|12]]
  from:-1800 till:-1650 fontsize:S text:[[Egypte XIII|13]]
  from:-1650 till:-1600 fontsize:S text:[[Egypte XIV|14]]

  bar:2tp color:lavender mark:(line,black) textcolor:white
  from:-1600 till:-1540 fontsize:S text:[[Tweede tussentijd|Verdeeld]]

  bar:nwr color:kelleygreen mark:(line,black) textcolor:white
  from:-1540 till:-1292 fontsize:S text:[[Egypte XVIII|18]
  from:-1292 till:-1224 fontsize:S text:[[Egypte XIX|19]]
  from:-1224 till:-1069 fontsize:S text:[[Egypte XX|20]]

  bar:3tp color:yellow mark:(line,black) textcolor:white
  from:-1069 till:-945 fontsize:S text:[[Egypte XXI|21]]
  from:-945 till:-715 fontsize:S text:[[Derde tussentijd|Verdeeld]]
  from:-715 till:-656 fontsize:S text:[[Egypte XXV|25]]

  bar:lpd color:skyblue mark:(line,black) textcolor:white
  from:-656 till:-525 fontsize:S text:[[Egypte XXVI|26]]
  from:-525 till:-404 fontsize:S text:[[Achaemeniden|27]]
  from:-404 till:-398 fontsize:S text:
  from:-398 till:-380 fontsize:S text:
  from:-380 till:-342 fontsize:S text:
  from:-341 till:-332 fontsize:S text:[[Egypte XXXI|31]]
| Kaprijke | top next |

Initial version by Zonneschijn on Monday, July 31, 2006
Colors=
  id:a value:gray(0.9)
  id:b value:gray(0.7)
  id:c value:rgb(1,1,1)
  id:d value:rgb(0.6,0.7,0.8)

ImageSize  = width:750 height:373
PlotArea   = left:50 bottom:30 top:30 right:30
DateFormat = x.y
Period     = from:0 till:4000
TimeAxis   = orientation:vertical
AlignBars  = justify
ScaleMajor = gridcolor:b increment:500 start:0
ScaleMinor = gridcolor:a increment:100 start:0
BackgroundColors = canvas:c

BarData=
  bar:1806 text:1806
  bar:1816 text:1816
  bar:1830 text:1830
  bar:1846 text:1846
  bar:1856 text:1856
  bar:1866 text:1866
  bar:1876 text:1876
  bar:1880 text:1880
  bar:1890 text:1890
  bar:1900 text:1900
  bar:1910 text:1910
  bar:1920 text:1920
  bar:1930 text:1930
  bar:1947 text:1947
  bar:1961 text:1961
  bar:1970 text:1970
  bar:1976 text:1976
  bar:1981 text:1981
  bar:1991 text:1991
  bar:2002 text:2002
  bar:2005 text:2005

PlotData=
  color:d width:20 align:left

  bar:1806 from:0 till: 3378
  bar:1816 from:0 till: 3471
  bar:1830 from:0 till: 3829
  bar:1846 from:0 till: 3711
  bar:1856 from:0 till: 3433
  bar:1866 from:0 till: 3311
  bar:1876 from:0 till: 3505
  bar:1880 from:0 till: 3504
  bar:1890 from:0 till: 3569
  bar:1900 from:0 till: 3472
  bar:1910 from:0 till: 3678
  bar:1920 from:0 till: 3213
  bar:1930 from:0 till: 3079
  bar:1947 from:0 till: 3153
  bar:1961 from:0 till: 3065
  bar:1970 from:0 till: 2953
  bar:1976 from:0 till: 2904
  bar:1981 from:0 till: 2802
  bar:1991 from:0 till: 2532
  bar:2002 from:0 till: 2615
  bar:2005 from:0 till: 2651

PlotData=

  bar:1806 at: 3378 fontsize:s text: 3.378 shift:(-10,5)
  bar:1816 at: 3471 fontsize:S text: 3.471 shift:(-10,5)
  bar:1830 at: 3829 fontsize:S text: 3.829 shift:(-10,5)
  bar:1846 at: 3711 fontsize:S text: 3.711 shift:(-10,5)
  bar:1856 at: 3433 fontsize:S text: 3.433 shift:(-10,5)
  bar:1866 at: 3311 fontsize:S text: 3.311 shift:(-10,5)
  bar:1876 at: 3505 fontsize:S text: 3.505 shift:(-10,5)
  bar:1880 at: 3504 fontsize:S text: 3.504 shift:(-10,5)
  bar:1890 at: 3569 fontsize:S text: 3.569 shift:(-10,5)
  bar:1900 at: 3472 fontsize:S text: 3.472 shift:(-10,5)
  bar:1910 at: 3678 fontsize:S text: 3.678 shift:(-10,5)
  bar:1920 at: 3213 fontsize:S text: 3.213 shift:(-10,5)
  bar:1930 at: 3079 fontsize:S text: 3.079 shift:(-10,5)
  bar:1947 at: 3153 fontsize:S text: 3.153 shift:(-10,5)
  bar:1961 at: 3065 fontsize:S text: 3.065 shift:(-10,5)
  bar:1970 at: 2953 fontsize:S text: 2.953 shift:(-10,5)
  bar:1976 at: 2904 fontsize:S text: 2.904 shift:(-10,5)
  bar:1981 at: 2802 fontsize:S text: 2.802 shift:(-10,5)
  bar:1991 at: 2532 fontsize:S text: 2.532 shift:(-10,5)
  bar:2002 at: 2615 fontsize:S text: 2.615 shift:(-10,5)
  bar:2005 at: 2651 fontsize:S text: 2.651 shift:(-10,5)
| Watervliet (België) | top next |

First version by Zonneschijn on Sunday, March 12, 2006, last update on Saturday, July 29, 2006
ImageSize  = width:500 height:250
PlotArea   = left:40 right:10 top:10 bottom:20
TimeAxis   = orientation:horizontal
AlignBars  = justify
Colors =
    id:a value:gray(0.9)
    id:b value:rgb(0,0,0)

DateFormat = yyyy
Period     = from:1800 till:2020
ScaleMajor = unit:year increment:20 start:1800

PlotData =
  bar:3000 color:a width:1
  from:start till:end
  bar:2250 color:a
  from:start till:end
  bar:1500 color:a
  from:start till:end
  bar:750 color:a
  from:start till:end
  bar:0 color:a

LineData =
  layer:front
  points:(53,163)(71,136)       color:b    width:1
  points:(71,136)(101,142)      color:b    width:1
  points:(101,142)(134,169)     color:b    width:1
  points:(134,169)(155,172)     color:b    width:1
  points:(155,172)(175,178)     color:b    width:1
  points:(175,178)(195,187)     color:b    width:1
  points:(195,187)(204,187)     color:b    width:1
  points:(204,187)(224,187)     color:b    width:1
  points:(224,187)(245,214)     color:b    width:1
  points:(245,214)(265,224)     color:b    width:1
  points:(265,224)(285,193)     color:b    width:1
  points:(285,193)(306,192)     color:b    width:1
  points:(306,192)(341,181)     color:b    width:1
  points:(341,181)(369,161)     color:b    width:1
  points:(369,161)(387,146)     color:b    width:1
  points:(387,146)(402,138)     color:b    width:1
  points:(402,138)(418,131)     color:b    width:1
  points:(418,131)(439,133)     color:b    width:1
  points:(439,133)(459,140)     color:b    width:1
| Topografie van Nederland | top next |

First version by Bemoeial ? on Friday, March 31, 2006, last update on Wednesday, April 26, 2006
TimeAxis = orientation:hor
ImageSize = width:800 height:240
PlotArea = width:760 height:200 bottom:20 left:20

Colors =
  id:canvas value:rgb(0.97,0.97,0.97)
  id:grid1  value:rgb(0.86,0.86,0.86)
  id:grid2  value:gray(0.8)
  id:bars   value:rgb(0.7,0.7,0.7)

BackgroundColors = canvas:canvas

Period     = from:0 till:3500
ScaleMajor = unit:year increment:200 start:0 gridcolor:grid1

BarData=
  barset:Bands

PlotData=

# set defaults
  width:12 fontsize:M textcolor:black align:center shift:(4,-5) color:bars
  barset:Bands
  from:1 till:3458 text:[[Zuid-Holland]] #3458381
  from:1 till:2599 text:[[Noord-Holland]]#2599103
  from:1 till:2411 text:[[Noord-Brabant]] #2411359
  from:1 till:1972 text:[[Gelderland]] #1972010
  from:1 till:1171 text:[[Utrecht]] #1171291
  from:1 till:1137 text:[[Limburg (Nederland)|Limburg]] #1136695
  from:1 till:1109 text:[[Overijssel]] #1109432
  from:1 till: 643 text:[[Friesland]] #642997

  from:1 till: 575 text:[[Groningen (provincie)|Groningen]] #575072
  from:1 till: 483 text:[[Drenthe]] #483369
  from:1 till: 380 text:[[Zeeland]] #379978
  from:1 till: 366 text:[[Flevoland]] #365859

TextData =
  pos:(500,100) text: Aantal 1000 inwoners per provincie (1 januari 2005)
| Topografie van Nederland | top next |

First version by Bemoeial ? on Friday, March 31, 2006, last update on Wednesday, April 26, 2006
TimeAxis = orientation:hor format:yyyyyy
ImageSize = width:800 height:340
PlotArea = width:760 height:300 bottom:20 left:20

Colors =
  id:canvas value:rgb(0.97,0.97,0.97)
  id:grid1  value:rgb(0.86,0.86,0.86)
  id:grid2  value:gray(0.8)
  id:bars   value:rgb(0.7,0.7,0.7)

BackgroundColors = canvas:canvas

Period     = from:0 till:750000
ScaleMajor = unit:year increment:50000 start:0 gridcolor:grid1

BarData=
  barset:Bands

LineData =
  at:100000 color:grid2 layer:back

PlotData=

# set defaults
  width:12 fontsize:M textcolor:black align:center shift:(4,-5) color:bars
  barset:Bands

  from:1 till:742011 text:[[Amsterdam|Amsterdam (Hoofdstad) met 742.011 inwoners]]
  from:1 till:589156 text:[[Rotterdam]]
  from:1 till:474291 text:[[Den Haag]]
  from:1 till:281025 text:[[Utrecht (stad)|Utrecht]]
  from:1 till:209740 text:[[Eindhoven]]
  from:1 till:200217 text:[[Tilburg]]
  from:1 till:180487 text:[[Groningen (stad)|Groningen]]
  from:1 till:178284 text:[[Almere]]
  from:1 till:169998 text:[[Breda]]
  from:1 till:159447 text:[[Nijmegen]]
  from:1 till:156069 text:[[Apeldoorn]]
  from:1 till:154182 text:[[Enschede]]
  from:1 till:146638 text:[[Haarlem]]
  from:1 till:142194 text:[[Arnhem]]
  from:1 till:134904 text:[[Amersfoort]]
  from:1 till:134793 text:[['s-Hertogenbosch]]
  from:1 till:120302 text:[[Maastricht]]
  from:1 till:118887 text:[[Dordrecht (Nederland)|Dordrecht]]
  from:1 till:118340 text:[[Leiden]]
  from:1 till:117222 text:[[Zoetermeer]]
  from:1 till:112905 text:[[Zwolle]]
| Kabinet-Maizière | top next |
Initial version by Nicklaarakkers on Tuesday, April 25, 2006
ImageSize  = width:824 height:226
PlotArea   = width:560 height:178 left:186 bottom:20
DateFormat = yyyy
Period     = from:1946 till:1990
TimeAxis   = orientation:horizontal
ScaleMajor = gridcolor:black unit:year increment:5 start:1950

BarData=
 bar:rvm text:"Voorzitter raad van ministers"
 bar:sg text:"Secretaris-generaal van de SED"

Colors=
  id:lightyellow value:rgb(1,1,0.4)

PlotData=
  color:lightyellow width:75 mark:(line,red) align:center fontsize:L shift:(0,0)
  # shift texts up or down manually to avoid overlap
  bar:rvm
  from:1949 till:1964 fontsize:M text:Otto Grotewohl
  from:1964 till:1973 shift:(0,-15) fontsize:M text:Willy Stoph
  from:1973 till:1976 shift:(0,13) fontsize:M  text:Horst~Sindermann
  from:1976 till:1989 shift:(0,-15) fontsize:M text:Willy Stoph
  from:1989 till:1990 shift:(0,17) fontsize:M text:Hans~Modrow
  from:1990 till:1990 shift:(20,-12) fontsize:M text:Lothar~de Maizière

  bar:sg color:red mark:(line,yellow) textcolor:white
  from:1946 till:1950 align:left shift:(-25,0) fontsize:M text:Wilhelm~Pieck
  from:1950 till:1971 fontsize:M text:Walter Ulbricht
  from:1971 till:1989 fontsize:M text:Erich Honecker
  from:1989 till:1989 align:left textcolor:black fontsize:M text:Egon~Krenz
| Geschiedenis van Maastricht | top next |

Initial version by Alankomaat on Tuesday, May 30, 2006
# All measures all in pixels

ImageSize  = width:600 height:800
PlotArea   = left:35 right:35 bottom:20 top:10
AlignBars  = early

DateFormat = yyyy
Period     = from:1200 till:2005
TimeAxis   = orientation:vertical
ScaleMajor = unit:year increment:100 start:1200
ScaleMinor = unit:year increment:10 start:1200

# there is no automatic collision detection,
# so shift texts up or down manually to avoid overlap

Define $dx = 5 # shift text to right side of bar

PlotData=

    bar:History color:red width:25 mark:(line,black) align:left fontsize:M

   at:1204 shift:($dx,5) text:"Maastricht krijgt stadsrechten (1204)"
   at:1579 shift:($dx,-15) text:"Maastricht wordt door de Hertog van Parma veroverd (1579)"
   at:1632 shift:($dx,-15) text:"Frederik Hendrik verovert Maastricht (1632)"
   at:1673 shift:($dx,-15) text:"Lodewijk XIV verovert Maastricht (1673)"
   at:1678 shift:($dx,5) text:"Maastricht weer bij Nederland (1678)"
   at:1794 shift:($dx,-15) text:"Maastricht wordt weer Frans (1794)"
   at:1814 shift:($dx,-12) text:"Maastricht wordt bij de Nederlanden gevoegd (1814)"
   at:1830 shift:($dx,5) text:"Generaal Dibbets behoudt Maastricht voor de Nederlanden (1830-1839)"
   at:1867 shift:($dx,5) text:"Ontmanteling van de Vesting Maastricht (1867)"
   at:1944 shift:($dx,5) text:"Bevrijding van Maastricht op 13/14 september (1944)"
   at:1992 shift:($dx,5) text:"Verdrag van Maastricht (1992)"
| Oeren | top next |

First version by Zonneschijn on Thursday, June 1, 2006, last update on Saturday, June 3, 2006
Colors=
  id:a value:gray(0.9)
  id:b value:gray(0.7)
  id:c value:rgb(1,1,1)
  id:d value:rgb(0.6,0.7,0.8)

ImageSize  = width:700 height:373
PlotArea   = left:50 bottom:30 top:30 right:30
DateFormat = x.y
Period     = from:0 till:200
TimeAxis   = orientation:vertical
AlignBars  = justify
ScaleMajor = gridcolor:b increment:25 start:0
ScaleMinor = gridcolor:a increment:5 start:0
BackgroundColors = canvas:c

BarData=
  bar:1688 text:1688
  bar:1759 text:1759
  bar:1794 text:1794
  bar:1806 text:1806
  bar:1816 text:1816
  bar:1830 text:1830
  bar:1846 text:1846
  bar:1856 text:1856
  bar:1866 text:1866
  bar:1876 text:1876
  bar:1880 text:1880
  bar:1890 text:1890
  bar:1900 text:1900
  bar:1910 text:1910
  bar:1920 text:1920
  bar:1930 text:1930
  bar:1947 text:1947
  bar:1961 text:1961
  bar:1970 text:1970
  bar:2006 text:2006

PlotData=
  color:d width:20 align:left

  bar:1688 from:0 till: 159
  bar:1759 from:0 till: 167
  bar:1794 from:0 till: 144
  bar:1806 from:0 till: 173
  bar:1816 from:0 till: 161
  bar:1830 from:0 till: 194
  bar:1846 from:0 till: 180
  bar:1856 from:0 till: 180
  bar:1866 from:0 till: 153
  bar:1876 from:0 till: 161
  bar:1880 from:0 till: 172
  bar:1890 from:0 till: 170
  bar:1900 from:0 till: 155
  bar:1910 from:0 till: 131
  bar:1920 from:0 till: 137
  bar:1930 from:0 till: 116
  bar:1947 from:0 till: 95
  bar:1961 from:0 till: 76
  bar:1970 from:0 till: 68
  bar:2006 from:0 till: 40

PlotData=

  bar:1688 at: 159 fontsize:s text: 159 shift:(-10,5)
  bar:1759 at: 167 fontsize:s text: 167 shift:(-10,5)
  bar:1794 at: 144 fontsize:s text: 144 shift:(-10,5)
  bar:1806 at: 173 fontsize:s text: 173 shift:(-10,5)
  bar:1816 at: 161 fontsize:S text: 161 shift:(-10,5)
  bar:1830 at: 194 fontsize:S text: 194 shift:(-10,5)
  bar:1846 at: 180 fontsize:S text: 180 shift:(-10,5)
  bar:1856 at: 180 fontsize:S text: 180 shift:(-10,5)
  bar:1866 at: 153 fontsize:S text: 153 shift:(-10,5)
  bar:1876 at: 161 fontsize:S text: 161 shift:(-10,5)
  bar:1880 at: 172 fontsize:S text: 172 shift:(-10,5)
  bar:1890 at: 170 fontsize:S text: 170 shift:(-10,5)
  bar:1900 at: 155 fontsize:S text: 155 shift:(-10,5)
  bar:1910 at: 131 fontsize:S text: 131 shift:(-10,5)
  bar:1920 at: 137 fontsize:S text: 137 shift:(-10,5)
  bar:1930 at: 116 fontsize:S text: 116 shift:(-10,5)
  bar:1947 at: 95 fontsize:S text: 95 shift:(-10,5)
  bar:1961 at: 76 fontsize:S text: 76 shift:(-10,5)
  bar:1970 at: 68 fontsize:S text: 68 shift:(-10,5)
  bar:2006 at: 40 fontsize:S text: 40 shift:(-10,5)
| Template:LuxemburgseTV | top next |

Initial version by Mystro82 on Monday, June 12, 2006
ImageSize  = width:730 height:185
PlotArea   = left:90 right:20 top:30 bottom:30
TimeAxis   = orientation:horizontal
DateFormat = yyyy

Period     = from:1950 till:2007
AlignBars  = early
ScaleMajor = unit:year increment:5 start:1950


Colors =
    id:RTL1 value:rgb(1,0.7,0.7) # light red
    id:RTL2 value:rgb(1,0.7,0.7) # light red
    id:RTL9 value:rgb(1,0.7,0.7) # light red
    id:T.TV value:rgb(1,0.7,0.7) # light red
    id:Nordliicht value:rgb(1,0.7,0.7) # light red
    id:Uelzechtkanal value:rgb(1,0.7,0.7) # light red
    id:DOK value:rgb(1,0.7,0.7) # light red

Define $dx=-3

PlotData =
  bar:RTL1 width:20 color:red shift:($dx,-20)
  from:1991 till:2001  color:yellow
  from:2001 till:2007  color:redorange
  at:1992 text:" [[RTL Télé Lëtzebuerg|RTL Hei Elei]]" shift:($dx,-5)
  at:1999 text:" [[RTL Télé Lëtzebuerg]]" shift:($dx,-5)

  bar:RTL2 width:20 color:red shift:($dx,-20)
  from:2004 till:2007  color:orange
  at:2003 text:" [[Den 2. RTL]]" shift:($dx,-5)

  bar:RTL9 width:20 color:red shift:($dx,-20)
  from:1955 till:1982  color:yellow
  from:1982 till:1991  color:redorange
  from:1991 till:1996  color:yellow
  from:1996 till:2007  color:redorange
  at:1964 text:" [[RTL 9|Télé Luxembourg]]" shift:($dx,-5)
  at:1983 text:" [[RTL 9|RTL Télévision]]" shift:($dx,-5)
  at:1992 text:" [[RTL 9|RTL TV]]" shift:($dx,-5)
  at:2000 text:" [[RTL 9]]" shift:($dx,-5)

  bar:T.TV width:20 color:red shift:($dx,-20)
  from:2004 till:2007  color:yellow
  at:2005 text:" [[T.TV]]" shift: ($dx,-5)

  bar:Nordliicht width:20 color:red shift:($dx,-20)
  from:1997 till:2007  color:powderblue2
  at:1999 text:" Nordliicht TV" shift:($dx,-5)

  bar:Uelzechtkanal width:20 color:red shift:($dx,-20)
  from:1996 till:2007  color:yellowgreen
  at:1998 text:" Uelzechtkanal" shift:($dx,-5)
| Template:WaalseTV | top next |

Initial version by Mystro82 on Monday, June 12, 2006
ImageSize  = width:730 height:290
PlotArea   = left:90 right:20 top:30 bottom:30
TimeAxis   = orientation:horizontal
DateFormat = yyyy

Period     = from:1950 till:2007
AlignBars  = early
ScaleMajor = unit:year increment:5 start:1950


Colors =
    id:RTBF1 value:rgb(1,0.7,0.7) # light red
    id:RTBF2 value:rgb(1,0.7,0.7) # light red
    id:RTBF3 value:rgb(1,0.7,0.7) # light red
    id:BRF value:rgb(1,0.7,0.7) # light red
    id:RTL-TVI value:rgb(1,0.7,0.7) # light red
    id:Club-RTL value:rgb(1,0.7,0.7) # light red
    id:Plug-TV value:rgb(1,0.7,0.7) # light red
    id:AB3 value:rgb(1,0.7,0.7) # light red
    id:AB4 value:rgb(1,0.7,0.7) # light red
    id:MCM value:rgb(1,0.7,0.7) # light red
    id:CanalZ value:rgb(1,0.7,0.7) # light red

Define $dx=-3

PlotData =
  bar:RTBF1 width:20 color:red shift:($dx,-20)
  from:1953 till:1960  color:redorange
  from:1960 till:1977  color:yellow
  from:1977 till:1998  color:redorange
  from:1998 till:2007  color:yellow
  at:1954 text:" [[NIR|INR]]" shift:($dx,-5)
  at:1965 text:" [[RTB]]" shift:($dx,-5)
  at:1985 text:" [[RTBF1]]" shift:($dx,-5)
  at:2001 text:" [[La Une]]" shift:($dx,-5)

  bar:RTBF2 width:20 color:red shift:($dx,-20)
  from:1976 till:1980  color:yellow
  from:1980 till:1998  color:redorange
  from:1998 till:2007  color:yellow
  at:1977 text:" La bis" shift:($dx,-5)
  at:1985 text:" [[RTBF2]]" shift:($dx,-5)
  at:2001 text:" [[La Deux]]" shift:($dx,-5)

  bar:RTBF3 width:20 color:red shift:($dx,-20)
  from:2001 till:2007  color:yellow
  at:2002 text:" [[RTBF|RTBF Sat]]" shift:($dx,-5)

  bar:BRF width:20 color:red shift:($dx,-20)
  from:1977 till:2007  color:yellow
  at:1990 text:" [[BRF|BRF TV]]" shift:($dx,-5)

  bar:RTL-TVI width:20 color:red shift:($dx,-20)
  from:1982 till:1987  color:yellowgreen
  from:1987 till:2007  color:green
  at:1980 text:" [[RTL TVI|RTL Télévision]]" shift: ($dx,-5)
  at:1997 text:" [[RTL TVI]]" shift: ($dx,-5)

  bar:Club-RTL width:20 color:red shift:($dx,-20)
  from:1995 till:2007  color:green
  at:2000 text:" [[Club RTL]]" shift:($dx,-5)

  bar:Plug-TV width:20 color:red shift:($dx,-20)
  from:2003 till:2007  color:green
  at:2003 text:" [[Plug TV]]" shift:($dx,-5)

  bar:AB3 width:20 color:red shift:($dx,-20)
  from:2000 till:2001  color:skyblue
  from:2001 till:2007  color:powderblue2
  at:1999 text:" YCT" shift:($dx,-5)
  at:2004 text:" AB3" shift:($dx,-5)

  bar:AB4 width:20 color:red shift:($dx,-20)
  from:2002 till:2007  color:powderblue2
  at:2004 text:" AB4" shift:($dx,-5)

  bar:MCM width:20 color:red shift:($dx,-20)
  from:2003 till:2007  color:coral
  at:2002 text:" MCM Belgique" shift:($dx,-5)

  bar:CanalZ width:20 color:red shift:($dx,-20)
  from:1999 till:2007  color:red
  at:2001 text:" [[Kanaal Z|Canal Z]]" shift:($dx,-5)
| Ronde van Frankrijk 2007 | top next |

Initial version by Ckoelma on Wednesday, July 5, 2006
ImageSize  = width:600 height:600
PlotArea   = left:25 right:0 bottom:20 top:10
DateFormat = yyyy
Period     = from:0 till:21
TimeAxis   = orientation:vertical order:reverse
ScaleMajor = gridcolor:white unit:year increment:1 start:1

Colors =
  id:alggeel    value:rgb(1,1,0.4)
  id:bergrood   value:rgb(1,0.5,0.5)
  id:puntgroen  value:rgb(0.7,1,0.5)
  id:lichtgrijs value:rgb(0.95,0.95,0.95)
  id:lichtpaars value:rgb(0.85,0.9,1)

PlotData=

  bar:Algemeen color:alggeel width:110 mark:(line,black) align:center fontsize:S shift:(0,2)
  # shift texts up or down manually to avoid overlap
  from:0  till:21  text:Nog geen gegevens

  bar:Puntenklassement color:puntgroen
  # shift texts up or down manually to avoid overlap
  from:0  till:21  text:Nog geen gegevens

  bar:Bergklassement color:bergrood
  # shift texts up or down manually to avoid overlap
  from:0  till:21  text:Nog geen gegevens

  bar:Jongerenklassement color:lichtgrijs
  # shift texts up or down manually to avoid overlap
  from:0  till:21  text:Nog geen gegevens

  bar:Ploegenklassement color:lichtpaars
  # shift texts up or down manually to avoid overlap
  from:0  till:21 text:Nog geen gegevens
| Hannêche | top next |

Initial version by Zonneschijn on Tuesday, July 18, 2006
Colors=
  id:a value:gray(0.9)
  id:b value:gray(0.7)
  id:c value:rgb(1,1,1)
  id:d value:rgb(0.6,0.7,0.8)

ImageSize  = width:650 height:373
PlotArea   = left:50 bottom:30 top:30 right:30
DateFormat = x.y
Period     = from:0 till:600
TimeAxis   = orientation:vertical
AlignBars  = justify
ScaleMajor = gridcolor:b increment:75 start:0
ScaleMinor = gridcolor:a increment:15 start:0
BackgroundColors = canvas:c

BarData=
  bar:1806 text:1806
  bar:1816 text:1816
  bar:1830 text:1830
  bar:1846 text:1846
  bar:1856 text:1856
  bar:1866 text:1866
  bar:1876 text:1876
  bar:1880 text:1880
  bar:1890 text:1890
  bar:1900 text:1900
  bar:1910 text:1910
  bar:1920 text:1920
  bar:1930 text:1930
  bar:1947 text:1947
  bar:1961 text:1961
  bar:1970 text:1970
  bar:1976 text:1976

PlotData=
  color:d width:20 align:left

  bar:1806 from:0 till: 244
  bar:1816 from:0 till: 284
  bar:1830 from:0 till: 340
  bar:1846 from:0 till: 379
  bar:1856 from:0 till: 457
  bar:1866 from:0 till: 471
  bar:1876 from:0 till: 432
  bar:1880 from:0 till: 443
  bar:1890 from:0 till: 408
  bar:1900 from:0 till: 404
  bar:1910 from:0 till: 353
  bar:1920 from:0 till: 348
  bar:1930 from:0 till: 350
  bar:1947 from:0 till: 306
  bar:1961 from:0 till: 285
  bar:1970 from:0 till: 236
  bar:1976 from:0 till: 224

PlotData=

  bar:1806 at: 244 fontsize:s text: 244 shift:(-10,5)
  bar:1816 at: 284 fontsize:S text: 284 shift:(-10,5)
  bar:1830 at: 340 fontsize:S text: 340 shift:(-10,5)
  bar:1846 at: 379 fontsize:S text: 379 shift:(-10,5)
  bar:1856 at: 457 fontsize:S text: 457 shift:(-10,5)
  bar:1866 at: 471 fontsize:S text: 471 shift:(-10,5)
  bar:1876 at: 432 fontsize:S text: 432 shift:(-10,5)
  bar:1880 at: 443 fontsize:S text: 443 shift:(-10,5)
  bar:1890 at: 408 fontsize:S text: 408 shift:(-10,5)
  bar:1900 at: 404 fontsize:S text: 404 shift:(-10,5)
  bar:1910 at: 353 fontsize:S text: 353 shift:(-10,5)
  bar:1920 at: 348 fontsize:S text: 348 shift:(-10,5)
  bar:1930 at: 350 fontsize:S text: 350 shift:(-10,5)
  bar:1947 at: 306 fontsize:S text: 306 shift:(-10,5)
  bar:1961 at: 285 fontsize:S text: 285 shift:(-10,5)
  bar:1970 at: 236 fontsize:S text: 236 shift:(-10,5)
  bar:1976 at: 224 fontsize:S text: 224 shift:(-10,5)
| Avernas-le-Bauduin | top next |

Initial version by Zonneschijn on Tuesday, July 18, 2006
Colors=
  id:a value:gray(0.9)
  id:b value:gray(0.7)
  id:c value:rgb(1,1,1)
  id:d value:rgb(0.6,0.7,0.8)

ImageSize  = width:650 height:373
PlotArea   = left:50 bottom:30 top:30 right:30
DateFormat = x.y
Period     = from:0 till:800
TimeAxis   = orientation:vertical
AlignBars  = justify
ScaleMajor = gridcolor:b increment:100 start:0
ScaleMinor = gridcolor:a increment:20 start:0
BackgroundColors = canvas:c

BarData=
  bar:1806 text:1806
  bar:1816 text:1816
  bar:1830 text:1830
  bar:1846 text:1846
  bar:1856 text:1856
  bar:1866 text:1866
  bar:1876 text:1876
  bar:1880 text:1880
  bar:1890 text:1890
  bar:1900 text:1900
  bar:1910 text:1910
  bar:1920 text:1920
  bar:1930 text:1930
  bar:1947 text:1947
  bar:1961 text:1961
  bar:1970 text:1970
  bar:2005 text:2005

PlotData=
  color:d width:20 align:left

  bar:1806 from:0 till: 242
  bar:1816 from:0 till: 242
  bar:1830 from:0 till: 330
  bar:1846 from:0 till: 456
  bar:1856 from:0 till: 492
  bar:1866 from:0 till: 548
  bar:1876 from:0 till: 630
  bar:1880 from:0 till: 642
  bar:1890 from:0 till: 681
  bar:1900 from:0 till: 675
  bar:1910 from:0 till: 683
  bar:1920 from:0 till: 661
  bar:1930 from:0 till: 634
  bar:1947 from:0 till: 648
  bar:1961 from:0 till: 569
  bar:1970 from:0 till: 530
  bar:2005 from:0 till: 721

PlotData=

  bar:1806 at: 242 fontsize:s text: 242 shift:(-10,5)
  bar:1816 at: 242 fontsize:S text: 242 shift:(-10,5)
  bar:1830 at: 330 fontsize:S text: 330 shift:(-10,5)
  bar:1846 at: 456 fontsize:S text: 456 shift:(-10,5)
  bar:1856 at: 492 fontsize:S text: 492 shift:(-10,5)
  bar:1866 at: 548 fontsize:S text: 548 shift:(-10,5)
  bar:1876 at: 630 fontsize:S text: 630 shift:(-10,5)
  bar:1880 at: 642 fontsize:S text: 642 shift:(-10,5)
  bar:1890 at: 681 fontsize:S text: 681 shift:(-10,5)
  bar:1900 at: 675 fontsize:S text: 675 shift:(-10,5)
  bar:1910 at: 683 fontsize:S text: 683 shift:(-10,5)
  bar:1920 at: 661 fontsize:S text: 661 shift:(-10,5)
  bar:1930 at: 634 fontsize:S text: 634 shift:(-10,5)
  bar:1947 at: 648 fontsize:S text: 648 shift:(-10,5)
  bar:1961 at: 569 fontsize:S text: 569 shift:(-10,5)
  bar:1970 at: 530 fontsize:S text: 530 shift:(-10,5)
  bar:2005 at: 721 fontsize:S text: 721 shift:(-10,5)
| Omroep siris | top next |

Initial version by Timhanssen on Friday, July 21, 2006
TimeAxis = orientation:horizontal format:yyyy
ImageSize = width:1000 height:400
PlotArea = width:850 height:300 bottom:20 left:20

Colors =
  id:canvas value:rgb(0.97,0.97,0.97)
  id:grid1  value:rgb(0.86,0.86,0.86)
  id:grid2  value:gray(0.8)
  id:bars   value:rgb(0.96,0.96,0.6)

BackgroundColors = canvas:canvas

Period     = from:1988 till:2007
ScaleMajor = unit:year increment:1 start:1988 gridcolor:grid1

BarData=
  barset:Bands

LineData =
  at:1988 color:grid2 layer:back
  at:1992 color:grid2 layer:back
  at:1998 color:grid2 layer:back

PlotData=

# set defaults
  width:25 fontsize:L textcolor:black align:left anchor:from shift:(10,-4) color:bars

  barset:Bands

  from:1988 till:1998 text:"Lokale omroep voor Someren (SIRIS)"
  from:1998 till:2006 text:"Stichting Omroep Asten Someren (SIRIS)"
  from:1992 till:1998 text:"Lokale omroep voor Asten (Asten Lokaal)"
  from:1998 till:1998 text:"Fusie met Asten Lokaal"
  from:1999 till:2006 text:"Start SIRIS Tekst-tv"
  from:2000 till:2006 text:"Start SIRIS Teletekst"
  from:2003 till:2006 text:"Start SIRIS TV"
  from:2005 till:2006 text:"Start website"
  from:2006 till:2006 text:"100000 bezoeker website"
| Lamontzée | top next |

Initial version by Zonneschijn on Friday, July 28, 2006
Colors=
  id:a value:gray(0.9)
  id:b value:gray(0.7)
  id:c value:rgb(1,1,1)
  id:d value:rgb(0.6,0.7,0.8)

ImageSize  = width:650 height:373
PlotArea   = left:50 bottom:30 top:30 right:30
DateFormat = x.y
Period     = from:0 till:400
TimeAxis   = orientation:vertical
AlignBars  = justify
ScaleMajor = gridcolor:b increment:50 start:0
ScaleMinor = gridcolor:a increment:10 start:0
BackgroundColors = canvas:c

BarData=
  bar:1806 text:1806
  bar:1816 text:1816
  bar:1830 text:1830
  bar:1846 text:1846
  bar:1856 text:1856
  bar:1866 text:1866
  bar:1876 text:1876
  bar:1880 text:1880
  bar:1890 text:1890
  bar:1900 text:1900
  bar:1910 text:1910
  bar:1920 text:1920
  bar:1930 text:1930
  bar:1947 text:1947
  bar:1961 text:1961
  bar:1970 text:1970
  bar:1976 text:1976

PlotData=
  color:d width:20 align:left

  bar:1806 from:0 till: 196
  bar:1816 from:0 till: 254
  bar:1830 from:0 till: 298
  bar:1846 from:0 till: 312
  bar:1856 from:0 till: 311
  bar:1866 from:0 till: 371
  bar:1876 from:0 till: 354
  bar:1880 from:0 till: 360
  bar:1890 from:0 till: 339
  bar:1900 from:0 till: 326
  bar:1910 from:0 till: 312
  bar:1920 from:0 till: 269
  bar:1930 from:0 till: 251
  bar:1947 from:0 till: 224
  bar:1961 from:0 till: 211
  bar:1970 from:0 till: 204
  bar:1976 from:0 till: 206

PlotData=

  bar:1806 at: 196 fontsize:s text: 196 shift:(-10,5)
  bar:1816 at: 254 fontsize:S text: 254 shift:(-10,5)
  bar:1830 at: 298 fontsize:S text: 298 shift:(-10,5)
  bar:1846 at: 312 fontsize:S text: 312 shift:(-10,5)
  bar:1856 at: 311 fontsize:S text: 311 shift:(-10,5)
  bar:1866 at: 371 fontsize:S text: 371 shift:(-10,5)
  bar:1876 at: 354 fontsize:S text: 354 shift:(-10,5)
  bar:1880 at: 360 fontsize:S text: 360 shift:(-10,5)
  bar:1890 at: 339 fontsize:S text: 339 shift:(-10,5)
  bar:1900 at: 326 fontsize:S text: 326 shift:(-10,5)
  bar:1910 at: 312 fontsize:S text: 312 shift:(-10,5)
  bar:1920 at: 269 fontsize:S text: 269 shift:(-10,5)
  bar:1930 at: 251 fontsize:S text: 251 shift:(-10,5)
  bar:1947 at: 224 fontsize:S text: 224 shift:(-10,5)
  bar:1961 at: 211 fontsize:S text: 211 shift:(-10,5)
  bar:1970 at: 204 fontsize:S text: 204 shift:(-10,5)
  bar:1976 at: 206 fontsize:S text: 206 shift:(-10,5)
| Kroniek van het orkaanseizoen van de Grote Oceaan 2006 | top next |

Initial version by Tropische Storm Sven on Monday, July 31, 2006
ImageSize = width:800 height:150
PlotArea  = top:10 bottom:30 right:20 left:20
AlignBars = early

DateFormat = dd/mm/yyyy
Period     = from:01/05/2006 till:01/08/2006
TimeAxis   = orientation:horizontal
ScaleMinor = grid:black unit:month increment:1 start:01/05/2006

Colors     =
  id:canvas value:gray(0.88)
  id:GP     value:red
  id:TD     value:rgb(0.38,0.73,1)
  id:TS     value:rgb(0,0.98,0.96)
  id:C1     value:rgb(1,1,0.80)
  id:C2     value:rgb(1,0.91,0.46)
  id:C3     value:rgb(1,0.76,0.25)
  id:C4     value:rgb(1,0.56,0.13)
  id:C5     value:rgb(1,0.38,0.38)

Backgroundcolors = canvas:canvas

BarData =
  barset:Hurricane
  bar:Month

PlotData=

  barset:Hurricane width:10 align:left fontsize:S shift:(4,-4) anchor:till
  from:27/05/2006 till:30/05/2006 color:TS text:"Aletta"
  from:03/06/2006 till:04/06/2006 color:TD text:"Twee-E"
  from:11/07/2006 till:15/07/2006 color:C3 text:"Bud"
  from:12/07/2006 till:16/07/2006 color:C1 text:"Carlotta"
  from:15/07/2006 till:26/07/2006 color:C4 text:"Daniel"
  from:21/07/2006 till:28/07/2006 color:TS text:"Emilia"
    barset:skip

  bar:Month width:5 align:center fontsize:S shift:(0,-20) anchor:middle color:canvas
  from:01/05/2006 till:01/06/2006 text:mei
  from:01/06/2006 till:01/07/2006 text:juni
  from:01/07/2006 till:01/08/2006 text:juli
| Generated on Friday, August 11, 2006 from SQL dump files of Monday, July 31, 2006 | |
| Note: only timelines on article and template pages are shown. Timelines on discussion pages, user pages, etc are ignored. | Top |