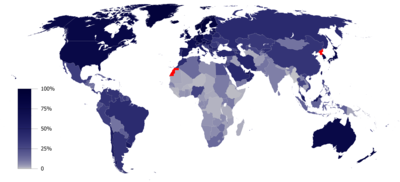
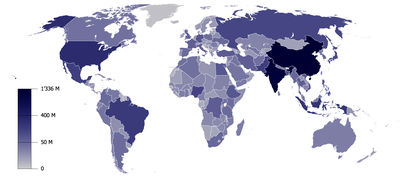
Wikimedia Traffic Analysis Report - Wikipedia Page Edits Per Country - OverviewMonthly requests or daily averages, for period: 1 Jul 2009 - 30 Sep 2013 (last 12 months) |
Unresolved Bugzilla bugs: 55443
Recently resolved bugs: 46205 (Aug 2013)
Page Views Per Country - Overview / Breakdown / Trends, Page Views Per Wikipedia Language - Breakdown
Page Edits Per Country - Overview / Breakdown / Trends, Page Edits Per Wikipedia Language - Breakdown
, and notes about reliability of these data
Portal is www.wikipedia.org
Show index | |||||||||||||||||||||||||||||||||||||||||||||||||||||||||||||||||||||||||||||||||||||||||||||||||||||
| |||||||||||||||||||||||||||||||||||||||||||||||||||||||||||||||||||||||||||||||||||||||||||||||||||||
Location | Population absolute count and percentage of world population | Internet Users absolute count and percentage of country population | Monthly Page Edits | ||||||||||||||||||||||||||||||||||||||||||||||||||||||||||||||||||||||||||||||||||||||||||||||||||
Country | Region | N/S | absolute count and monthly Page Editss per internet user | share of global total note:blue and red bars have different scale | |||||||||||||||||||||||||||||||||||||||||||||||||||||||||||||||||||||||||||||||||||||||||||||||||
All countries in | World | 7040 M | 100% | 2485 M | 35% | 5.5 M | 0.0022 | 100% | |||||||||||||||||||||||||||||||||||||||||||||||||||||||||||||||||||||||||||||||||||||||||||||
---|---|---|---|---|---|---|---|---|---|---|---|---|---|---|---|---|---|---|---|---|---|---|---|---|---|---|---|---|---|---|---|---|---|---|---|---|---|---|---|---|---|---|---|---|---|---|---|---|---|---|---|---|---|---|---|---|---|---|---|---|---|---|---|---|---|---|---|---|---|---|---|---|---|---|---|---|---|---|---|---|---|---|---|---|---|---|---|---|---|---|---|---|---|---|---|---|---|---|---|---|---|
All countries in | Global North | 1296 M | 18.4% | 949 M | 73% | 4.3 M | 0.0045 | 78.3% | |||||||||||||||||||||||||||||||||||||||||||||||||||||||||||||||||||||||||||||||||||||||||||||
All countries in | Global South | 5744 M | 81.6% | 1536 M | 27% | 1.2 M | 0.0008 | 21.7% | |||||||||||||||||||||||||||||||||||||||||||||||||||||||||||||||||||||||||||||||||||||||||||||
All countries in | Africa | 1072 M | 15.2% | 201 M | 19% | 50 K | 0.0003 | 0.9% | |||||||||||||||||||||||||||||||||||||||||||||||||||||||||||||||||||||||||||||||||||||||||||||
All countries in | Asia | 4234 M | 60.1% | 1216 M | 29% | 1.0 M | 0.0009 | 19.0% | |||||||||||||||||||||||||||||||||||||||||||||||||||||||||||||||||||||||||||||||||||||||||||||
All countries in | Europe | 738 M | 10.5% | 501 M | 68% | 2.9 M | 0.0058 | 52.8% | |||||||||||||||||||||||||||||||||||||||||||||||||||||||||||||||||||||||||||||||||||||||||||||
All countries in | Central-America | 85 M | 1.2% | 23 M | 27% | 26 K | 0.0011 | 0.5% | |||||||||||||||||||||||||||||||||||||||||||||||||||||||||||||||||||||||||||||||||||||||||||||
All countries in | North-America | 471 M | 6.7% | 328 M | 70% | 1.0 M | 0.0032 | 18.9% | |||||||||||||||||||||||||||||||||||||||||||||||||||||||||||||||||||||||||||||||||||||||||||||
All countries in | South-America | 402 M | 5.7% | 192 M | 48% | 326 K | 0.0017 | 5.9% | |||||||||||||||||||||||||||||||||||||||||||||||||||||||||||||||||||||||||||||||||||||||||||||
All countries in | Oceania | 38 M | 0.5% | 23 M | 61% | 108 K | 0.0047 | 2.0% | |||||||||||||||||||||||||||||||||||||||||||||||||||||||||||||||||||||||||||||||||||||||||||||
Remainder | Unknown | 2 K | 0.04% | ||||||||||||||||||||||||||||||||||||||||||||||||||||||||||||||||||||||||||||||||||||||||||||||||||
United States | North-America | N | 317 M | 4.5% | 254 M | 80% | 831 K | 0.0033 | 15.1% | ||||||||||||||||||||||||||||||||||||||||||||||||||||||||||||||||||||||||||||||||||||||||||||
Germany | Europe | N | 81 M | 1.1% | 68 M | 85% | 408 K | 0.0060 | 7.4% | ||||||||||||||||||||||||||||||||||||||||||||||||||||||||||||||||||||||||||||||||||||||||||||
France | Europe | N | 66 M | 0.9% | 54 M | 83% | 343 K | 0.0063 | 6.2% | ||||||||||||||||||||||||||||||||||||||||||||||||||||||||||||||||||||||||||||||||||||||||||||
United Kingdom | Europe | N | 64 M | 0.9% | 55 M | 86% | 343 K | 0.0062 | 6.2% | ||||||||||||||||||||||||||||||||||||||||||||||||||||||||||||||||||||||||||||||||||||||||||||
Italy | Europe | N | 60 M | 0.8% | 36 M | 59% | 310 K | 0.0087 | 5.6% | ||||||||||||||||||||||||||||||||||||||||||||||||||||||||||||||||||||||||||||||||||||||||||||
Russia | Europe | N | 144 M | 2.0% | 76 M | 53% | 285 K | 0.0038 | 5.2% | ||||||||||||||||||||||||||||||||||||||||||||||||||||||||||||||||||||||||||||||||||||||||||||
Japan | Asia | N | 127 M | 1.8% | 101 M | 79% | 236 K | 0.0023 | 4.3% | ||||||||||||||||||||||||||||||||||||||||||||||||||||||||||||||||||||||||||||||||||||||||||||
Spain | Europe | N | 47 M | 0.7% | 34 M | 73% | 189 K | 0.0056 | 3.4% | ||||||||||||||||||||||||||||||||||||||||||||||||||||||||||||||||||||||||||||||||||||||||||||
Canada | North-America | N | 35 M | 0.5% | 30 M | 85% | 154 K | 0.0052 | 2.8% | ||||||||||||||||||||||||||||||||||||||||||||||||||||||||||||||||||||||||||||||||||||||||||||
Brazil | South-America | S | 201 M | 2.9% | 99 M | 49% | 133 K | 0.0013 | 2.4% | ||||||||||||||||||||||||||||||||||||||||||||||||||||||||||||||||||||||||||||||||||||||||||||
India | Asia | S | 1235 M | 17.5% | 152 M | 12% | 128 K | 0.0008 | 2.3% | ||||||||||||||||||||||||||||||||||||||||||||||||||||||||||||||||||||||||||||||||||||||||||||
Poland | Europe | N | 39 M | 0.5% | 25 M | 65% | 114 K | 0.0045 | 2.1% | ||||||||||||||||||||||||||||||||||||||||||||||||||||||||||||||||||||||||||||||||||||||||||||
Netherlands | Europe | N | 17 M | 0.2% | 16 M | 93% | 107 K | 0.0069 | 1.9% | ||||||||||||||||||||||||||||||||||||||||||||||||||||||||||||||||||||||||||||||||||||||||||||
Ukraine | Europe | N | 45 M | 0.6% | 15 M | 33% | 101 K | 0.0067 | 1.8% | ||||||||||||||||||||||||||||||||||||||||||||||||||||||||||||||||||||||||||||||||||||||||||||
Australia | Oceania | N | 23 M | 0.3% | 18 M | 78% | 89 K | 0.0049 | 1.6% | ||||||||||||||||||||||||||||||||||||||||||||||||||||||||||||||||||||||||||||||||||||||||||||
Sweden | Europe | N | 9.6 M | 0.1% | 8.6 M | 89% | 72 K | 0.0084 | 1.3% | ||||||||||||||||||||||||||||||||||||||||||||||||||||||||||||||||||||||||||||||||||||||||||||
South Korea | Asia | N | 50 M | 0.7% | 41 M | 82% | 71 K | 0.0017 | 1.3% | ||||||||||||||||||||||||||||||||||||||||||||||||||||||||||||||||||||||||||||||||||||||||||||
Taiwan | Asia | S | 23 M | 0.3% | 18 M | 76% | 65 K | 0.0037 | 1.2% | ||||||||||||||||||||||||||||||||||||||||||||||||||||||||||||||||||||||||||||||||||||||||||||
Argentina | South-America | S | 40 M | 0.6% | 24 M | 59% | 58 K | 0.0025 | 1.1% | ||||||||||||||||||||||||||||||||||||||||||||||||||||||||||||||||||||||||||||||||||||||||||||
Belgium | Europe | N | 11 M | 0.2% | 8.6 M | 77% | 58 K | 0.0068 | 1.1% | ||||||||||||||||||||||||||||||||||||||||||||||||||||||||||||||||||||||||||||||||||||||||||||
Israel | Asia | S | 8.1 M | 0.1% | 5.6 M | 69% | 58 K | 0.0104 | 1.1% | ||||||||||||||||||||||||||||||||||||||||||||||||||||||||||||||||||||||||||||||||||||||||||||
Mexico | North-America | S | 118 M | 1.7% | 44 M | 37% | 54 K | 0.0012 | 1.0% | ||||||||||||||||||||||||||||||||||||||||||||||||||||||||||||||||||||||||||||||||||||||||||||
Turkey | Asia | S | 76 M | 1.1% | 36 M | 48% | 54 K | 0.0015 | 1.0% | ||||||||||||||||||||||||||||||||||||||||||||||||||||||||||||||||||||||||||||||||||||||||||||
Hong Kong | Asia | S | 7.2 M | 0.1% | 5.2 M | 73% | 50 K | 0.0095 | 0.9% | ||||||||||||||||||||||||||||||||||||||||||||||||||||||||||||||||||||||||||||||||||||||||||||
Czech Republic | Europe | N | 11 M | 0.1% | 7.6 M | 73% | 48 K | 0.0063 | 0.9% | ||||||||||||||||||||||||||||||||||||||||||||||||||||||||||||||||||||||||||||||||||||||||||||
Hungary | Europe | N | 9.9 M | 0.1% | 7.2 M | 72% | 47 K | 0.0065 | 0.8% | ||||||||||||||||||||||||||||||||||||||||||||||||||||||||||||||||||||||||||||||||||||||||||||
China | Asia | S | 1360 M | 19.3% | 568 M | 42% | 46 K | 0.0001 | 0.8% | ||||||||||||||||||||||||||||||||||||||||||||||||||||||||||||||||||||||||||||||||||||||||||||
Norway | Europe | N | 5.1 M | 0.07% | 4.5 M | 88% | 46 K | 0.0102 | 0.8% | ||||||||||||||||||||||||||||||||||||||||||||||||||||||||||||||||||||||||||||||||||||||||||||
Finland | Europe | N | 5.4 M | 0.08% | 4.8 M | 88% | 45 K | 0.0094 | 0.8% | ||||||||||||||||||||||||||||||||||||||||||||||||||||||||||||||||||||||||||||||||||||||||||||
Indonesia | Asia | S | 238 M | 3.4% | 38 M | 16% | 43 K | 0.0011 | 0.8% | ||||||||||||||||||||||||||||||||||||||||||||||||||||||||||||||||||||||||||||||||||||||||||||
Switzerland | Europe | N | 8.1 M | 0.1% | 6.8 M | 84% | 39 K | 0.0058 | 0.7% | ||||||||||||||||||||||||||||||||||||||||||||||||||||||||||||||||||||||||||||||||||||||||||||
Chile | South-America | S | 17 M | 0.2% | 10 M | 63% | 38 K | 0.0036 | 0.7% | ||||||||||||||||||||||||||||||||||||||||||||||||||||||||||||||||||||||||||||||||||||||||||||
Iran | Asia | S | 77 M | 1.1% | 21 M | 27% | 37 K | 0.0018 | 0.7% | ||||||||||||||||||||||||||||||||||||||||||||||||||||||||||||||||||||||||||||||||||||||||||||
Colombia | South-America | S | 47 M | 0.7% | 22 M | 47% | 35 K | 0.0016 | 0.6% | ||||||||||||||||||||||||||||||||||||||||||||||||||||||||||||||||||||||||||||||||||||||||||||
Greece | Europe | N | 11 M | 0.2% | 6.0 M | 56% | 35 K | 0.0058 | 0.6% | ||||||||||||||||||||||||||||||||||||||||||||||||||||||||||||||||||||||||||||||||||||||||||||
Thailand | Asia | S | 66 M | 0.9% | 18 M | 27% | 35 K | 0.0019 | 0.6% | ||||||||||||||||||||||||||||||||||||||||||||||||||||||||||||||||||||||||||||||||||||||||||||
Philippines | Asia | S | 98 M | 1.4% | 38 M | 38% | 35 K | 0.0009 | 0.6% | ||||||||||||||||||||||||||||||||||||||||||||||||||||||||||||||||||||||||||||||||||||||||||||
Austria | Europe | N | 8.5 M | 0.1% | 6.7 M | 79% | 33 K | 0.0050 | 0.6% | ||||||||||||||||||||||||||||||||||||||||||||||||||||||||||||||||||||||||||||||||||||||||||||
Serbia | Europe | N | 7.2 M | 0.1% | 3.5 M | 49% | 29 K | 0.0082 | 0.5% | ||||||||||||||||||||||||||||||||||||||||||||||||||||||||||||||||||||||||||||||||||||||||||||
Bulgaria | Europe | N | 7.3 M | 0.1% | 3.9 M | 53% | 28 K | 0.0072 | 0.5% | ||||||||||||||||||||||||||||||||||||||||||||||||||||||||||||||||||||||||||||||||||||||||||||
Portugal | Europe | N | 11 M | 0.2% | 6.9 M | 65% | 27 K | 0.0040 | 0.5% | ||||||||||||||||||||||||||||||||||||||||||||||||||||||||||||||||||||||||||||||||||||||||||||
Malaysia | Asia | S | 30 M | 0.4% | 19 M | 64% | 24 K | 0.0013 | 0.4% | ||||||||||||||||||||||||||||||||||||||||||||||||||||||||||||||||||||||||||||||||||||||||||||
Ireland | Europe | N | 4.6 M | 0.07% | 3.7 M | 81% | 24 K | 0.0063 | 0.4% | ||||||||||||||||||||||||||||||||||||||||||||||||||||||||||||||||||||||||||||||||||||||||||||
Denmark | Europe | N | 5.6 M | 0.08% | 5.2 M | 92% | 22 K | 0.0043 | 0.4% | ||||||||||||||||||||||||||||||||||||||||||||||||||||||||||||||||||||||||||||||||||||||||||||
Romania | Europe | N | 20 M | 0.3% | 11 M | 54% | 21 K | 0.0019 | 0.4% | ||||||||||||||||||||||||||||||||||||||||||||||||||||||||||||||||||||||||||||||||||||||||||||
Vietnam | Asia | S | 89 M | 1.3% | 36 M | 41% | 20 K | 0.0005 | 0.4% | ||||||||||||||||||||||||||||||||||||||||||||||||||||||||||||||||||||||||||||||||||||||||||||
Peru | South-America | S | 30 M | 0.4% | 11 M | 37% | 20 K | 0.0017 | 0.4% | ||||||||||||||||||||||||||||||||||||||||||||||||||||||||||||||||||||||||||||||||||||||||||||
New Zealand | Oceania | N | 4.5 M | 0.06% | 3.9 M | 87% | 18 K | 0.0047 | 0.3% | ||||||||||||||||||||||||||||||||||||||||||||||||||||||||||||||||||||||||||||||||||||||||||||
Saudi Arabia | Asia | S | 29 M | 0.4% | 14 M | 49% | 17 K | 0.0012 | 0.3% | ||||||||||||||||||||||||||||||||||||||||||||||||||||||||||||||||||||||||||||||||||||||||||||
Egypt | Africa | S | 84 M | 1.2% | 37 M | 44% | 15 K | 0.0004 | 0.3% | ||||||||||||||||||||||||||||||||||||||||||||||||||||||||||||||||||||||||||||||||||||||||||||
Estonia | Europe | N | 1.3 M | 0.02% | 1.0 M | 78% | 15 K | 0.0151 | 0.3% | ||||||||||||||||||||||||||||||||||||||||||||||||||||||||||||||||||||||||||||||||||||||||||||
Croatia | Europe | N | 4.3 M | 0.06% | 2.8 M | 66% | 15 K | 0.0053 | 0.3% | ||||||||||||||||||||||||||||||||||||||||||||||||||||||||||||||||||||||||||||||||||||||||||||
Pakistan | Asia | S | 184 M | 2.6% | 19 M | 10% | 15 K | 0.0008 | 0.3% | ||||||||||||||||||||||||||||||||||||||||||||||||||||||||||||||||||||||||||||||||||||||||||||
Venezuela | South-America | S | 29 M | 0.4% | 12 M | 43% | 15 K | 0.0012 | 0.3% | ||||||||||||||||||||||||||||||||||||||||||||||||||||||||||||||||||||||||||||||||||||||||||||
Belarus | Europe | N | 9.5 M | 0.1% | 4.5 M | 48% | 15 K | 0.0033 | 0.3% | ||||||||||||||||||||||||||||||||||||||||||||||||||||||||||||||||||||||||||||||||||||||||||||
Azerbaijan | Asia | S | 9.2 M | 0.1% | 5.1 M | 56% | 14 K | 0.0027 | 0.3% | ||||||||||||||||||||||||||||||||||||||||||||||||||||||||||||||||||||||||||||||||||||||||||||
Kazakhstan | Asia | S | 17 M | 0.2% | 9.3 M | 55% | 13 K | 0.0014 | 0.2% | ||||||||||||||||||||||||||||||||||||||||||||||||||||||||||||||||||||||||||||||||||||||||||||
Uruguay | South-America | S | 3.3 M | 0.05% | 1.8 M | 56% | 13 K | 0.0072 | 0.2% | ||||||||||||||||||||||||||||||||||||||||||||||||||||||||||||||||||||||||||||||||||||||||||||
Slovakia | Europe | N | 5.4 M | 0.08% | 4.4 M | 81% | 12 K | 0.0028 | 0.2% | ||||||||||||||||||||||||||||||||||||||||||||||||||||||||||||||||||||||||||||||||||||||||||||
Slovenia | Europe | N | 2.1 M | 0.03% | 1.4 M | 68% | 10 K | 0.0074 | 0.2% | ||||||||||||||||||||||||||||||||||||||||||||||||||||||||||||||||||||||||||||||||||||||||||||
Latvia | Europe | N | 2.0 M | 0.03% | 1.6 M | 81% | 10 K | 0.0063 | 0.2% | ||||||||||||||||||||||||||||||||||||||||||||||||||||||||||||||||||||||||||||||||||||||||||||
South Africa | Africa | S | 53 M | 0.8% | 20 M | 38% | 10 K | 0.0005 | 0.2% | ||||||||||||||||||||||||||||||||||||||||||||||||||||||||||||||||||||||||||||||||||||||||||||
Lithuania | Europe | N | 3.0 M | 0.04% | 2.4 M | 81% | 10 K | 0.0040 | 0.2% | ||||||||||||||||||||||||||||||||||||||||||||||||||||||||||||||||||||||||||||||||||||||||||||
Georgia | Asia | S | 4.5 M | 0.06% | 2.1 M | 46% | 9 K | 0.0043 | 0.2% | ||||||||||||||||||||||||||||||||||||||||||||||||||||||||||||||||||||||||||||||||||||||||||||
Singapore | Asia | S | 5.4 M | 0.08% | 4.0 M | 74% | 9 K | 0.0022 | 0.2% | ||||||||||||||||||||||||||||||||||||||||||||||||||||||||||||||||||||||||||||||||||||||||||||
Bosnia and Herzegovina | Europe | N | 3.8 M | 0.05% | 2.5 M | 66% | 8 K | 0.0032 | 0.1% | ||||||||||||||||||||||||||||||||||||||||||||||||||||||||||||||||||||||||||||||||||||||||||||
Armenia | Asia | S | 3.0 M | 0.04% | 1.2 M | 38% | 8 K | 0.0068 | 0.1% | ||||||||||||||||||||||||||||||||||||||||||||||||||||||||||||||||||||||||||||||||||||||||||||
Bangladesh | Asia | S | 153 M | 2.2% | 10 M | 7% | 8 K | 0.0007 | 0.1% | ||||||||||||||||||||||||||||||||||||||||||||||||||||||||||||||||||||||||||||||||||||||||||||
Ecuador | South-America | S | 16 M | 0.2% | 5.3 M | 34% | 7 K | 0.0014 | 0.1% | ||||||||||||||||||||||||||||||||||||||||||||||||||||||||||||||||||||||||||||||||||||||||||||
United Arab Emirates | Asia | S | 8.3 M | 0.1% | 4.5 M | 55% | 7 K | 0.0016 | 0.1% | ||||||||||||||||||||||||||||||||||||||||||||||||||||||||||||||||||||||||||||||||||||||||||||
Macedonia | Europe | N | 2.1 M | 0.03% | 1.3 M | 64% | 7 K | 0.0053 | 0.1% | ||||||||||||||||||||||||||||||||||||||||||||||||||||||||||||||||||||||||||||||||||||||||||||
Algeria | Africa | S | 38 M | 0.5% | 5.7 M | 15% | 6 K | 0.0010 | 0.1% | ||||||||||||||||||||||||||||||||||||||||||||||||||||||||||||||||||||||||||||||||||||||||||||
Sri Lanka | Asia | S | 20 M | 0.3% | 3.9 M | 19% | 5 K | 0.0014 | 0.10% | ||||||||||||||||||||||||||||||||||||||||||||||||||||||||||||||||||||||||||||||||||||||||||||
Morocco | Africa | S | 33 M | 0.5% | 18 M | 54% | 5 K | 0.0003 | 0.10% | ||||||||||||||||||||||||||||||||||||||||||||||||||||||||||||||||||||||||||||||||||||||||||||
Costa Rica | Central-America | S | 4.7 M | 0.07% | 2.2 M | 47% | 4 K | 0.0020 | 0.08% | ||||||||||||||||||||||||||||||||||||||||||||||||||||||||||||||||||||||||||||||||||||||||||||
Kuwait | Asia | S | 3.6 M | 0.05% | 2.1 M | 58% | 4 K | 0.0021 | 0.08% | ||||||||||||||||||||||||||||||||||||||||||||||||||||||||||||||||||||||||||||||||||||||||||||
Puerto Rico | Central-America | S | 3.7 M | 0.05% | 1.9 M | 52% | 4 K | 0.0021 | 0.07% | ||||||||||||||||||||||||||||||||||||||||||||||||||||||||||||||||||||||||||||||||||||||||||||
Moldova | Europe | N | 3.6 M | 0.05% | 1.6 M | 45% | 4 K | 0.0025 | 0.07% | ||||||||||||||||||||||||||||||||||||||||||||||||||||||||||||||||||||||||||||||||||||||||||||
Europe Unspecified | Europe | N | .. | .. | .. | 4 K | .. | 0.07% | |||||||||||||||||||||||||||||||||||||||||||||||||||||||||||||||||||||||||||||||||||||||||||||
Albania | Europe | N | 2.8 M | 0.04% | 1.6 M | 58% | 4 K | 0.0023 | 0.07% | ||||||||||||||||||||||||||||||||||||||||||||||||||||||||||||||||||||||||||||||||||||||||||||
Dominican Republic | Central-America | S | 9.4 M | 0.1% | 4.5 M | 48% | 4 K | 0.0008 | 0.07% | ||||||||||||||||||||||||||||||||||||||||||||||||||||||||||||||||||||||||||||||||||||||||||||
Paraguay | South-America | S | 6.6 M | 0.09% | 1.8 M | 27% | 3 K | 0.0018 | 0.06% | ||||||||||||||||||||||||||||||||||||||||||||||||||||||||||||||||||||||||||||||||||||||||||||
Macau | Asia | S | 582 K | 0.008% | 372 K | 64% | 3 K | 0.0087 | 0.06% | ||||||||||||||||||||||||||||||||||||||||||||||||||||||||||||||||||||||||||||||||||||||||||||
Tunisia | Africa | S | 11 M | 0.2% | 4.4 M | 41% | 3 K | 0.0007 | 0.06% | ||||||||||||||||||||||||||||||||||||||||||||||||||||||||||||||||||||||||||||||||||||||||||||
Cyprus | Europe | N | 862 K | 0.01% | 694 K | 81% | 3 K | 0.0046 | 0.06% | ||||||||||||||||||||||||||||||||||||||||||||||||||||||||||||||||||||||||||||||||||||||||||||
Guatemala | Central-America | S | 15 M | 0.2% | 2.3 M | 15% | 3 K | 0.0014 | 0.06% | ||||||||||||||||||||||||||||||||||||||||||||||||||||||||||||||||||||||||||||||||||||||||||||
Qatar | Asia | S | 1.9 M | 0.03% | 1.7 M | 92% | 3 K | 0.0018 | 0.06% | ||||||||||||||||||||||||||||||||||||||||||||||||||||||||||||||||||||||||||||||||||||||||||||
Iceland | Europe | N | 324 K | 0.005% | 301 K | 93% | 3 K | 0.0094 | 0.05% | ||||||||||||||||||||||||||||||||||||||||||||||||||||||||||||||||||||||||||||||||||||||||||||
Nepal | Asia | S | 26 M | 0.4% | 3.3 M | 13% | 3 K | 0.0009 | 0.05% | ||||||||||||||||||||||||||||||||||||||||||||||||||||||||||||||||||||||||||||||||||||||||||||
El Salvador | Central-America | S | 6.3 M | 0.09% | 1.6 M | 24% | 3 K | 0.0018 | 0.05% | ||||||||||||||||||||||||||||||||||||||||||||||||||||||||||||||||||||||||||||||||||||||||||||
Luxembourg | Europe | N | 537 K | 0.008% | 468 K | 87% | 3 K | 0.0059 | 0.05% | ||||||||||||||||||||||||||||||||||||||||||||||||||||||||||||||||||||||||||||||||||||||||||||
Palestine | Asia | S | 4.4 M | 0.06% | 1.8 M | 40% | 3 K | 0.0015 | 0.05% | ||||||||||||||||||||||||||||||||||||||||||||||||||||||||||||||||||||||||||||||||||||||||||||
Jordan | Asia | S | 6.5 M | 0.09% | 2.7 M | 41% | 2 K | 0.0009 | 0.04% | ||||||||||||||||||||||||||||||||||||||||||||||||||||||||||||||||||||||||||||||||||||||||||||
Malta | Europe | N | 416 K | 0.006% | 287 K | 69% | 2 K | 0.0084 | 0.04% | ||||||||||||||||||||||||||||||||||||||||||||||||||||||||||||||||||||||||||||||||||||||||||||
Mongolia | Asia | S | 2.8 M | 0.04% | 522 K | 19% | 2 K | 0.0045 | 0.04% | ||||||||||||||||||||||||||||||||||||||||||||||||||||||||||||||||||||||||||||||||||||||||||||
Iraq | Asia | S | 35 M | 0.5% | 2.2 M | 6% | 2 K | 0.0011 | 0.04% | ||||||||||||||||||||||||||||||||||||||||||||||||||||||||||||||||||||||||||||||||||||||||||||
Honduras | Central-America | S | 8.4 M | 0.1% | 1.5 M | 18% | 2 K | 0.0014 | 0.04% | ||||||||||||||||||||||||||||||||||||||||||||||||||||||||||||||||||||||||||||||||||||||||||||
Kyrgyzstan | Asia | S | 5.6 M | 0.08% | 1.2 M | 22% | 2 K | 0.0017 | 0.04% | ||||||||||||||||||||||||||||||||||||||||||||||||||||||||||||||||||||||||||||||||||||||||||||
Kenya | Africa | S | 44 M | 0.6% | 14 M | 31% | 2 K | 0.0001 | 0.03% | ||||||||||||||||||||||||||||||||||||||||||||||||||||||||||||||||||||||||||||||||||||||||||||
Bolivia | South-America | S | 10 M | 0.1% | 3.5 M | 35% | 2 K | 0.0005 | 0.03% | ||||||||||||||||||||||||||||||||||||||||||||||||||||||||||||||||||||||||||||||||||||||||||||
Panama | Central-America | S | 3.4 M | 0.05% | 1.6 M | 47% | 2 K | 0.0011 | 0.03% | ||||||||||||||||||||||||||||||||||||||||||||||||||||||||||||||||||||||||||||||||||||||||||||
Lebanon | Asia | S | 4.8 M | 0.07% | 2.5 M | 53% | 2 K | 0.0007 | 0.03% | ||||||||||||||||||||||||||||||||||||||||||||||||||||||||||||||||||||||||||||||||||||||||||||
Cambodia | Asia | S | 15 M | 0.2% | 739 K | 5% | 2 K | 0.0021 | 0.03% | ||||||||||||||||||||||||||||||||||||||||||||||||||||||||||||||||||||||||||||||||||||||||||||
Yemen | Asia | S | 25 M | 0.3% | 4.3 M | 18% | 2 K | 0.0003 | 0.03% | ||||||||||||||||||||||||||||||||||||||||||||||||||||||||||||||||||||||||||||||||||||||||||||
Montenegro | Europe | N | 620 K | 0.009% | 374 K | 60% | 1 K | 0.0033 | 0.02% | ||||||||||||||||||||||||||||||||||||||||||||||||||||||||||||||||||||||||||||||||||||||||||||
Faroe Islands | Europe | N | 48 K | 0.0007% | 42 K | 87% | 1 K | 0.0296 | 0.02% | ||||||||||||||||||||||||||||||||||||||||||||||||||||||||||||||||||||||||||||||||||||||||||||
Angola | Africa | S | 21 M | 0.3% | 3.1 M | 15% | 1 K | 0.0004 | 0.02% | ||||||||||||||||||||||||||||||||||||||||||||||||||||||||||||||||||||||||||||||||||||||||||||
Ghana | Africa | S | 25 M | 0.4% | 4.2 M | 17% | 1 K | 0.0003 | 0.02% | ||||||||||||||||||||||||||||||||||||||||||||||||||||||||||||||||||||||||||||||||||||||||||||
Satellite Provider | Unknown | X | .. | .. | .. | 1 K | .. | 0.02% | |||||||||||||||||||||||||||||||||||||||||||||||||||||||||||||||||||||||||||||||||||||||||||||
Anonymous Proxy | Unknown | X | .. | .. | .. | 1 K | .. | 0.02% | |||||||||||||||||||||||||||||||||||||||||||||||||||||||||||||||||||||||||||||||||||||||||||||
Jersey | Europe | N | 98 K | 0.001% | 39 K | 40% | 916 | 0.0235 | 0.02% | ||||||||||||||||||||||||||||||||||||||||||||||||||||||||||||||||||||||||||||||||||||||||||||
Uzbekistan | Asia | S | 30 M | 0.4% | 10 M | 34% | 833 | 0.0001 | 0.02% | ||||||||||||||||||||||||||||||||||||||||||||||||||||||||||||||||||||||||||||||||||||||||||||
Nicaragua | Central-America | S | 6.1 M | 0.09% | 773 K | 13% | 833 | 0.0011 | 0.02% | ||||||||||||||||||||||||||||||||||||||||||||||||||||||||||||||||||||||||||||||||||||||||||||
Jamaica | Central-America | S | 2.7 M | 0.04% | 1.3 M | 50% | 750 | 0.0006 | 0.01% | ||||||||||||||||||||||||||||||||||||||||||||||||||||||||||||||||||||||||||||||||||||||||||||
Oman | Asia | S | 3.8 M | 0.05% | 1.9 M | 48% | 750 | 0.0004 | 0.01% | ||||||||||||||||||||||||||||||||||||||||||||||||||||||||||||||||||||||||||||||||||||||||||||
Bahrain | Asia | S | 1.2 M | 0.02% | 1.1 M | 89% | 666 | 0.0006 | 0.01% | ||||||||||||||||||||||||||||||||||||||||||||||||||||||||||||||||||||||||||||||||||||||||||||
Sudan | Africa | S | 38 M | 0.5% | 7.2 M | 19% | 666 | 0.0001 | 0.01% | ||||||||||||||||||||||||||||||||||||||||||||||||||||||||||||||||||||||||||||||||||||||||||||
Maldives | Asia | S | 317 K | 0.005% | 154 K | 48% | 666 | 0.0043 | 0.01% | ||||||||||||||||||||||||||||||||||||||||||||||||||||||||||||||||||||||||||||||||||||||||||||
Mauritius | Africa | S | 1.3 M | 0.02% | 544 K | 43% | 583 | 0.0011 | 0.01% | ||||||||||||||||||||||||||||||||||||||||||||||||||||||||||||||||||||||||||||||||||||||||||||
Tanzania | Africa | S | 45 M | 0.6% | 6.1 M | 14% | 583 | 0.0001 | 0.01% | ||||||||||||||||||||||||||||||||||||||||||||||||||||||||||||||||||||||||||||||||||||||||||||
Isle of Man | Europe | N | 84 K | 0.001% | .. | 0% | 500 | .. | 0.009% | ||||||||||||||||||||||||||||||||||||||||||||||||||||||||||||||||||||||||||||||||||||||||||||
Haiti | Central-America | S | 10 M | 0.1% | 1.1 M | 10% | 500 | 0.0005 | 0.009% | ||||||||||||||||||||||||||||||||||||||||||||||||||||||||||||||||||||||||||||||||||||||||||||
Libya | Africa | S | 6.2 M | 0.09% | 1.1 M | 18% | 500 | 0.0004 | 0.009% | ||||||||||||||||||||||||||||||||||||||||||||||||||||||||||||||||||||||||||||||||||||||||||||
Ethiopia | Africa | S | 87 M | 1.2% | 1.4 M | 2% | 500 | 0.0004 | 0.009% | ||||||||||||||||||||||||||||||||||||||||||||||||||||||||||||||||||||||||||||||||||||||||||||
Guadeloupe | Central-America | S | 403 K | 0.006% | .. | 0% | 500 | .. | 0.009% | ||||||||||||||||||||||||||||||||||||||||||||||||||||||||||||||||||||||||||||||||||||||||||||
Trinidad and Tobago | Central-America | S | 1.3 M | 0.02% | 730 K | 55% | 416 | 0.0006 | 0.008% | ||||||||||||||||||||||||||||||||||||||||||||||||||||||||||||||||||||||||||||||||||||||||||||
Namibia | Africa | S | 2.1 M | 0.03% | 280 K | 13% | 416 | 0.0015 | 0.008% | ||||||||||||||||||||||||||||||||||||||||||||||||||||||||||||||||||||||||||||||||||||||||||||
Guam | Oceania | S | 159 K | 0.002% | 98 K | 62% | 416 | 0.0042 | 0.008% | ||||||||||||||||||||||||||||||||||||||||||||||||||||||||||||||||||||||||||||||||||||||||||||
Asia/Pacific Region Unspecified | Asia | S | .. | .. | .. | 416 | .. | 0.008% | |||||||||||||||||||||||||||||||||||||||||||||||||||||||||||||||||||||||||||||||||||||||||||||
Nigeria | Africa | S | 174 M | 2.5% | 56 M | 32% | 333 | 0.0000 | 0.006% | ||||||||||||||||||||||||||||||||||||||||||||||||||||||||||||||||||||||||||||||||||||||||||||
United States Virgin Islands | Central-America | S | 106 K | 0.002% | 43 K | 40% | 333 | 0.0078 | 0.006% | ||||||||||||||||||||||||||||||||||||||||||||||||||||||||||||||||||||||||||||||||||||||||||||
Madagascar | Africa | S | 21 M | 0.3% | 452 K | 2% | 333 | 0.0007 | 0.006% | ||||||||||||||||||||||||||||||||||||||||||||||||||||||||||||||||||||||||||||||||||||||||||||
Aruba | South-America | S | 101 K | 0.001% | 80 K | 78% | 333 | 0.0042 | 0.006% | ||||||||||||||||||||||||||||||||||||||||||||||||||||||||||||||||||||||||||||||||||||||||||||
Réunion | Asia | S | 821 K | 0.01% | .. | 0% | 333 | .. | 0.006% | ||||||||||||||||||||||||||||||||||||||||||||||||||||||||||||||||||||||||||||||||||||||||||||
Ivory Coast | Africa | S | 23 M | 0.3% | 522 K | 2% | 333 | 0.0006 | 0.006% | ||||||||||||||||||||||||||||||||||||||||||||||||||||||||||||||||||||||||||||||||||||||||||||
Uganda | Africa | S | 34 M | 0.5% | 4.9 M | 14% | 333 | 0.0001 | 0.006% | ||||||||||||||||||||||||||||||||||||||||||||||||||||||||||||||||||||||||||||||||||||||||||||
Mozambique | Africa | S | 24 M | 0.3% | 1.1 M | 5% | 250 | 0.0002 | 0.005% | ||||||||||||||||||||||||||||||||||||||||||||||||||||||||||||||||||||||||||||||||||||||||||||
Unknown | Unknown | .. | .. | .. | 250 | .. | 0.005% | ||||||||||||||||||||||||||||||||||||||||||||||||||||||||||||||||||||||||||||||||||||||||||||||
Andorra | Europe | N | 76 K | 0.001% | 74 K | 96% | 250 | 0.0034 | 0.005% | ||||||||||||||||||||||||||||||||||||||||||||||||||||||||||||||||||||||||||||||||||||||||||||
Saint Lucia | Central-America | S | 167 K | 0.002% | 79 K | 47% | 250 | 0.0032 | 0.005% | ||||||||||||||||||||||||||||||||||||||||||||||||||||||||||||||||||||||||||||||||||||||||||||
Bermuda | North-America | N | 64 K | 0.0009% | 63 K | 98% | 250 | 0.0040 | 0.005% | ||||||||||||||||||||||||||||||||||||||||||||||||||||||||||||||||||||||||||||||||||||||||||||
Brunei | Asia | S | 393 K | 0.006% | 246 K | 63% | 250 | 0.0010 | 0.005% | ||||||||||||||||||||||||||||||||||||||||||||||||||||||||||||||||||||||||||||||||||||||||||||
Zimbabwe | Africa | S | 13 M | 0.2% | 2.2 M | 17% | 250 | 0.0001 | 0.005% | ||||||||||||||||||||||||||||||||||||||||||||||||||||||||||||||||||||||||||||||||||||||||||||
Rwanda | Africa | S | 11 M | 0.1% | 938 K | 9% | 250 | 0.0003 | 0.005% | ||||||||||||||||||||||||||||||||||||||||||||||||||||||||||||||||||||||||||||||||||||||||||||
Burma | Asia | S | 53 M | 0.8% | 584 K | 1% | 250 | 0.0004 | 0.005% | ||||||||||||||||||||||||||||||||||||||||||||||||||||||||||||||||||||||||||||||||||||||||||||
Monaco | Europe | N | 36 K | 0.0005% | 27 K | 73% | 166 | 0.0063 | 0.003% | ||||||||||||||||||||||||||||||||||||||||||||||||||||||||||||||||||||||||||||||||||||||||||||
Liechtenstein | Europe | N | 37 K | 0.0005% | 33 K | 89% | 166 | 0.0051 | 0.003% | ||||||||||||||||||||||||||||||||||||||||||||||||||||||||||||||||||||||||||||||||||||||||||||
Fiji | Oceania | S | 858 K | 0.01% | 300 K | 35% | 166 | 0.0006 | 0.003% | ||||||||||||||||||||||||||||||||||||||||||||||||||||||||||||||||||||||||||||||||||||||||||||
Guernsey | Europe | N | 62 K | 0.0009% | .. | 0% | 166 | .. | 0.003% | ||||||||||||||||||||||||||||||||||||||||||||||||||||||||||||||||||||||||||||||||||||||||||||
Laos | Asia | S | 6.6 M | 0.09% | 708 K | 11% | 166 | 0.0002 | 0.003% | ||||||||||||||||||||||||||||||||||||||||||||||||||||||||||||||||||||||||||||||||||||||||||||
Guyana | South-America | S | 785 K | 0.01% | 255 K | 32% | 166 | 0.0007 | 0.003% | ||||||||||||||||||||||||||||||||||||||||||||||||||||||||||||||||||||||||||||||||||||||||||||
Antigua and Barbuda | Central-America | S | 86 K | 0.001% | 75 K | 86% | 166 | 0.0022 | 0.003% | ||||||||||||||||||||||||||||||||||||||||||||||||||||||||||||||||||||||||||||||||||||||||||||
Barbados | South-America | S | 274 K | 0.004% | 211 K | 77% | 166 | 0.0008 | 0.003% | ||||||||||||||||||||||||||||||||||||||||||||||||||||||||||||||||||||||||||||||||||||||||||||
Bahamas | North-America | N | 351 K | 0.005% | .. | 0% | 166 | .. | 0.003% | ||||||||||||||||||||||||||||||||||||||||||||||||||||||||||||||||||||||||||||||||||||||||||||
Cuba | Central-America | S | 11 M | 0.2% | 2.8 M | 25% | 166 | 0.0001 | 0.003% | ||||||||||||||||||||||||||||||||||||||||||||||||||||||||||||||||||||||||||||||||||||||||||||
Tajikistan | Asia | S | 8.0 M | 0.1% | 1.1 M | 14% | 166 | 0.0001 | 0.003% | ||||||||||||||||||||||||||||||||||||||||||||||||||||||||||||||||||||||||||||||||||||||||||||
San Marino | Europe | S | 32 K | 0.0005% | 16 K | 50% | 166 | 0.0102 | 0.003% | ||||||||||||||||||||||||||||||||||||||||||||||||||||||||||||||||||||||||||||||||||||||||||||
Democratic Republic of the Congo | Africa | S | 68 M | 1.0% | 1.2 M | 2% | 166 | 0.0001 | 0.003% | ||||||||||||||||||||||||||||||||||||||||||||||||||||||||||||||||||||||||||||||||||||||||||||
Greenland | Europe | N | 56 K | 0.0008% | 37 K | 66% | 166 | 0.0044 | 0.003% | ||||||||||||||||||||||||||||||||||||||||||||||||||||||||||||||||||||||||||||||||||||||||||||
Zambia | Africa | S | 13 M | 0.2% | 1.9 M | 14% | 166 | 0.0001 | 0.003% | ||||||||||||||||||||||||||||||||||||||||||||||||||||||||||||||||||||||||||||||||||||||||||||
Tonga | Oceania | S | 103 K | 0.001% | 37 K | 36% | 83 | 0.0022 | 0.002% | ||||||||||||||||||||||||||||||||||||||||||||||||||||||||||||||||||||||||||||||||||||||||||||
Curaçao | Unknown | 151 K | 0.002% | .. | 0% | 83 | .. | 0.002% | |||||||||||||||||||||||||||||||||||||||||||||||||||||||||||||||||||||||||||||||||||||||||||||
Afghanistan | Asia | S | 26 M | 0.4% | 1.7 M | 7% | 83 | 0.0001 | 0.002% | ||||||||||||||||||||||||||||||||||||||||||||||||||||||||||||||||||||||||||||||||||||||||||||
Grenada | Central-America | S | 103 K | 0.001% | 46 K | 44% | 83 | 0.0018 | 0.002% | ||||||||||||||||||||||||||||||||||||||||||||||||||||||||||||||||||||||||||||||||||||||||||||
Suriname | South-America | S | 534 K | 0.008% | 194 K | 36% | 83 | 0.0004 | 0.002% | ||||||||||||||||||||||||||||||||||||||||||||||||||||||||||||||||||||||||||||||||||||||||||||
Gambia | Africa | S | 1.8 M | 0.03% | 229 K | 12% | 83 | 0.0004 | 0.002% | ||||||||||||||||||||||||||||||||||||||||||||||||||||||||||||||||||||||||||||||||||||||||||||
Somalia | Africa | S | 10 M | 0.1% | 139 K | 1% | 83 | 0.0006 | 0.002% | ||||||||||||||||||||||||||||||||||||||||||||||||||||||||||||||||||||||||||||||||||||||||||||
Liberia | Africa | S | 4.3 M | 0.06% | 148 K | 3% | 83 | 0.0006 | 0.002% | ||||||||||||||||||||||||||||||||||||||||||||||||||||||||||||||||||||||||||||||||||||||||||||
Mali | Africa | S | 15 M | 0.2% | 336 K | 2% | 83 | 0.0002 | 0.002% | ||||||||||||||||||||||||||||||||||||||||||||||||||||||||||||||||||||||||||||||||||||||||||||
Dominica | Central-America | S | 71 K | 0.001% | 40 K | 57% | 83 | 0.0021 | 0.002% | ||||||||||||||||||||||||||||||||||||||||||||||||||||||||||||||||||||||||||||||||||||||||||||
French Guiana | South-America | S | 229 K | 0.003% | .. | 0% | 83 | .. | 0.002% | ||||||||||||||||||||||||||||||||||||||||||||||||||||||||||||||||||||||||||||||||||||||||||||
Gabon | Africa | S | 1.7 M | 0.02% | 139 K | 8% | 83 | 0.0006 | 0.002% | ||||||||||||||||||||||||||||||||||||||||||||||||||||||||||||||||||||||||||||||||||||||||||||
Samoa | Oceania | S | 188 K | 0.003% | 25 K | 13% | 83 | 0.0033 | 0.002% | ||||||||||||||||||||||||||||||||||||||||||||||||||||||||||||||||||||||||||||||||||||||||||||
Benin | Africa | S | 10 M | 0.1% | 365 K | 4% | 83 | 0.0002 | 0.002% | ||||||||||||||||||||||||||||||||||||||||||||||||||||||||||||||||||||||||||||||||||||||||||||
Bhutan | Asia | S | 739 K | 0.01% | 182 K | 25% | 83 | 0.0005 | 0.002% | ||||||||||||||||||||||||||||||||||||||||||||||||||||||||||||||||||||||||||||||||||||||||||||
Turks and Caicos Islands | Central-America | S | 31 K | 0.0004% | .. | 0% | 83 | .. | 0.002% | ||||||||||||||||||||||||||||||||||||||||||||||||||||||||||||||||||||||||||||||||||||||||||||
Åland Islands | Europe | N | 29 K | 0.0004% | .. | 0% | 83 | .. | 0.002% | ||||||||||||||||||||||||||||||||||||||||||||||||||||||||||||||||||||||||||||||||||||||||||||
Burkina Faso | Africa | S | 17 M | 0.2% | 644 K | 4% | 83 | 0.0001 | 0.002% | ||||||||||||||||||||||||||||||||||||||||||||||||||||||||||||||||||||||||||||||||||||||||||||
Turkmenistan | Asia | S | 5.2 M | 0.07% | 364 K | 7% | 83 | 0.0002 | 0.002% |
Countries are only included if the number of page edits in the period exceeds 100,000 (100 matching records in 1:1000 sampled log)
Page edits by bots are not included. Also all ip addresses that occur more than once on a given day are discarded for that day.
A few false negatives are taken for granted. Country meta data collected from English Wikipedia (population, internet users)).
Errata: WMF traffic logging service suffered from server capacity problems in Aug/Sep/Oct 2011. From mid September till late November squid log records for mobile traffic were in invalid format. In a an unrelated server outage precisely half of traffic to WMF mobile sites was not counted from Oct 16 - Nov 29 (one of two load-balanced servers did not report traffic). Generated on Wed, Oct 9, 2013 16:22
Note: page may load slower on Microsoft Internet explorer than on other major browsers
Absolute traffic counts for October 2011 are approximatly 7% too low.
Data loss only occurred during peak hours. It therefore may have had somewhat different impact for traffic from different parts of the world.
and may have also skewed relative figures like share of traffic per browser or operating system.
Data could be repaired for logs from mid October onwards. Older logs were no longer available.
WMF has since improved server monitoring, so that similar outages should be detected and fixed much faster from now on.
Author:Erik Zachte (Web site)
Mail: ezachte@### (no spam: ### = wikimedia.org)
All data on this page are in the public domain.