|
|
|
|
| Reach |
| |
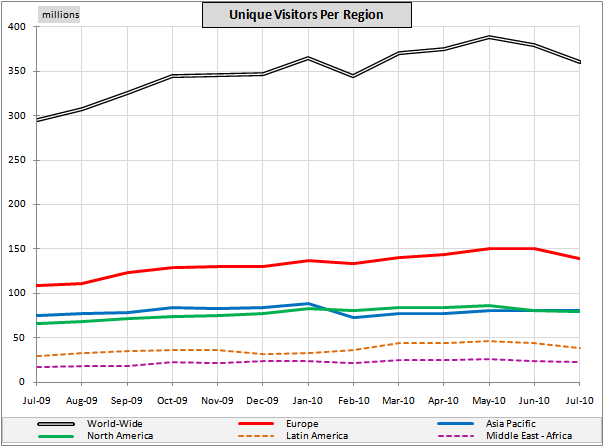
| 360 million |
Unique Visitors
|
| Y 7/9⇒7/10 |
+21.9% |
| M 6/10⇒7/10 |
-5.0% |
|
|
|
| 13.1 billion |
Page Requests
|
| Y 7/9⇒7/10 |
+27.2% |
| M 6/10⇒7/10 |
-6.0% |
|
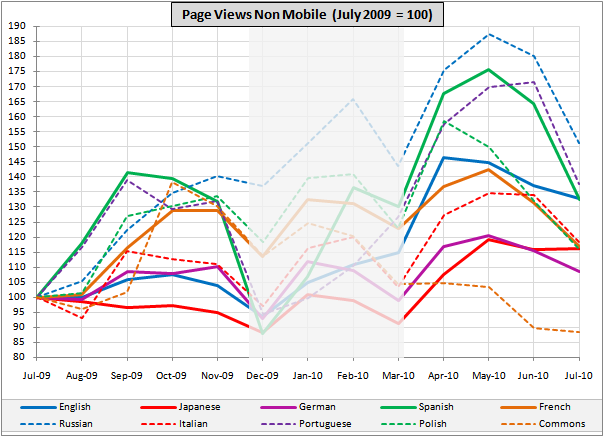
source: Squid logs ; see also wikistats report
view counts for all months have been normalized to 30 days (Jan*30/31, Feb*30/28, Mar*30/31, etc), this mainly shows in Jan⇒Feb and Feb⇒Mar
|
|
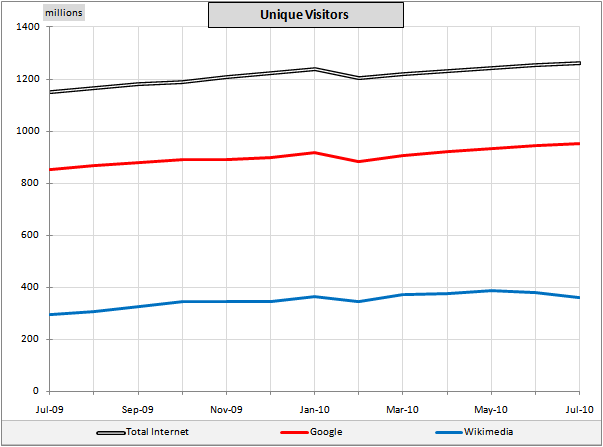
| Reach |
| |
| 5th in rank |
Web Properties - Unique Visitors
|
| Y 7/9⇒7/10 |
+0 |
| M 6/10⇒7/10 |
+0 |
|
|
|
| Content |
| |
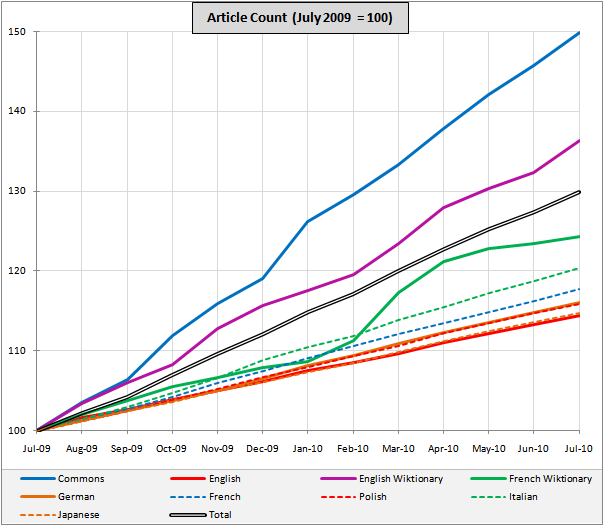
| 7.1 million |
Commons Files *
|
| Y 7/9⇒7/10 |
+49.1% |
| M 6/10⇒7/10 |
+2.9% |
|

|
|
| Content |
| |
| 34.2 million |
Articles On All Projects + Commons Files *
|
| Y 7/9⇒7/10 |
+29.9% |
| M 6/10⇒7/10 |
+2% |
|
|
|
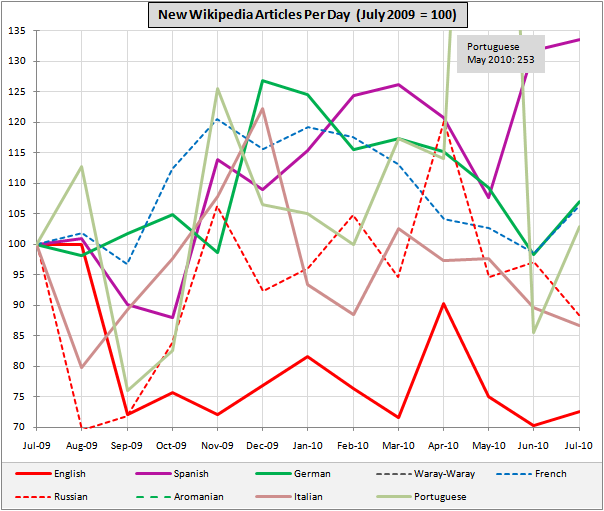
| 7,642 |
New Wikipedia Articles Per Day *
|
| Y 7/9⇒7/10 |
+4.2% |
| M 6/10⇒7/10 |
-0.6% |
|
|
|
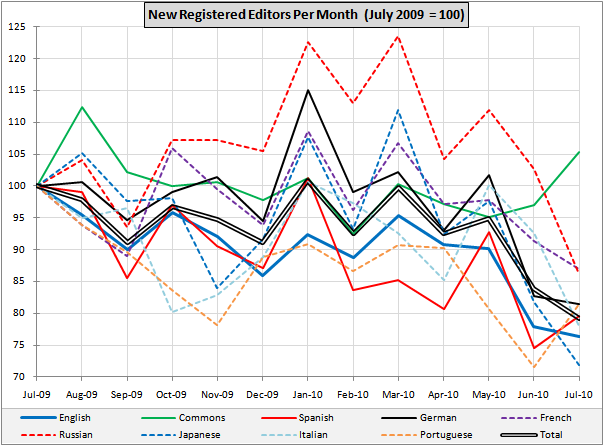
| Community |
| |
| 16,661 |
New Editors Per Month *
|
| Y 7/9⇒7/10 |
-20.8% |
| M 6/10⇒7/10 |
-5.6% |
|
|
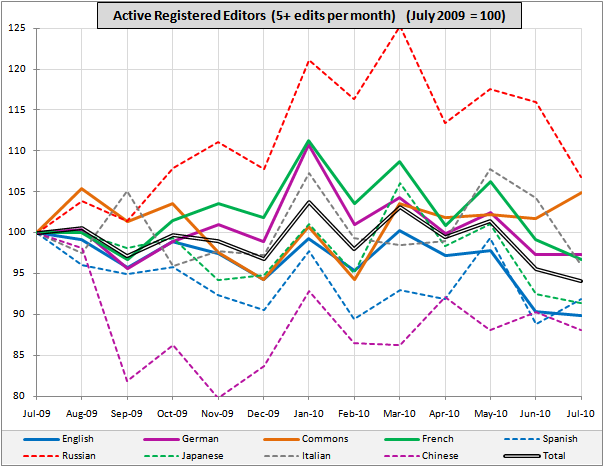
|
| 90,554 |
Active Editors (5+ edits per month) *
|
| Y 7/9⇒7/10 |
-5.9% |
| M 6/10⇒7/10 |
-1.6% |
|
|
|