|
|
|
|
| Metric | Now
07/10 | Yearly change
07/09 ⇒ 07/10 | Monthly change
6/10 ⇒ 07/10 | Notes |
|---|
| Unique Visitors | 360 M | +21.9% | -5.0% | |
| Page Requests | 13.1 B | +27.2% | -6.0% | 1,2,3,4 |
| Site Rank | 5th | +0 | +0 | 5 |
| Commons Files * | 7.1 M | +49.1% | +2.9% | 6 |
| Article Count * | 34.2 M | +29.9% | +2% | |
| New Articles Per Day * | 7.6 k | +4.2% | -0.6% | 7 |
| Edits * | 10.7 M | -5.5% | -9.8% | |
| New Editors * | 16.7 k | -20.8% | -5.6% | |
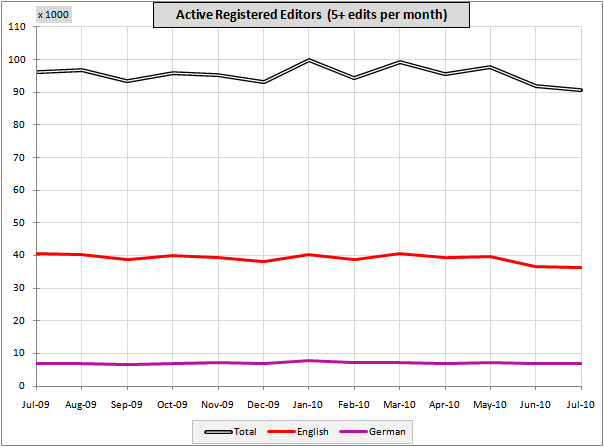
| Active Editors * | 90.6 k | -5.9% | -1.6% | 8,9 |
| Very Active Editors * | 11.8 k | -2.1% | -1.8% | 9 |
| |
| Repeated observations are grayed |
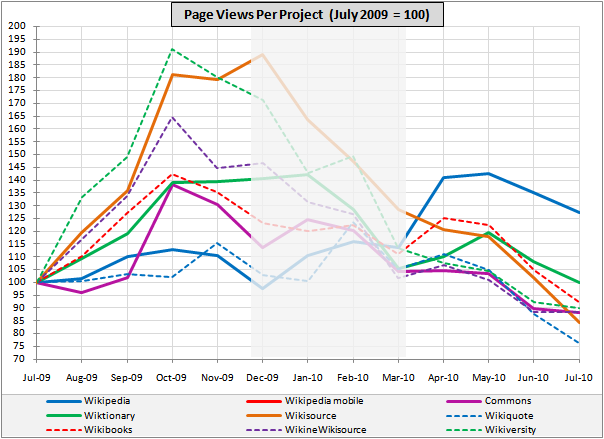
Page Requests
1: Due to server problems counts from squid logs for December 2009 - March 2010 are too low,
estimated underreporting 10%-25%. Counts for April - July 2010 have been patched..
2: August : Mobile traffic (401M): 3.0% of total traffic (13367M)
Trend data for mobile will be added when more history is available.
3: Many projects show peak traffic late 2009: see chart
4: Page requests are now normalized to 30 days (Jan*30/31, Feb*30/28, Mar*30/31, etc)
| Site Rank
5: 5th position will be stable for long time: differences with those ranked 4th and 6th are considerable. | Commons Files
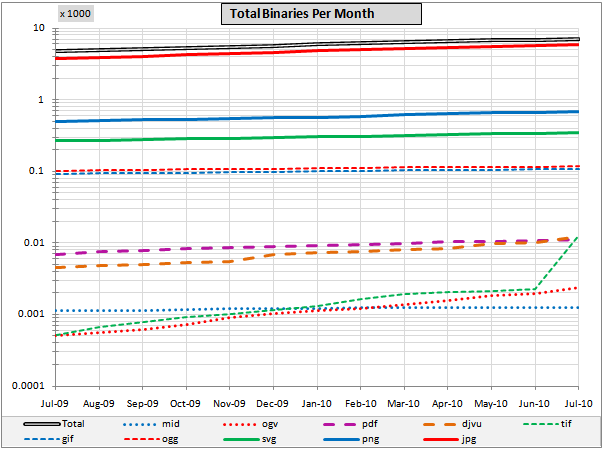
6: Tiff uploads increased 5-fold in July 2010, 25-fold in a year. | New Articles Per Day
7: Peak in April and May by massive activity on Aromanian and Waray-Waray Wp's, each by single user.
In May 20% of all new articles were created on these two small wikis (April 7%, June 11%) | (Very) Active Editors
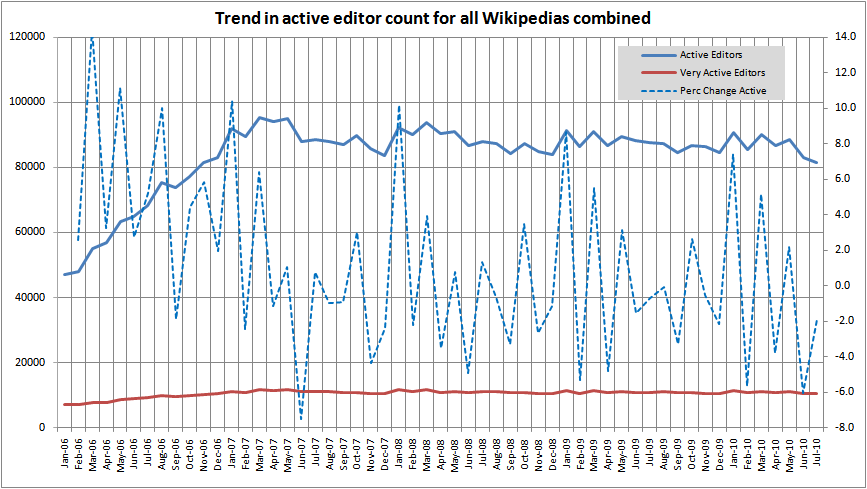
8: The 6% drop in active editors for all Wikipias in June was relatively large,
but from a wider perspective still within normal bandwidth, largest drop was in June 2006.
There might be a seasonal component in fluctuations.
9: Bug fix: in earlier RC editions editors from Commons (6k active editors) were counted double.
This has been fixed for all months in this RC. | | B = billion, M = million, k = thousand |
|
Author Erik Zachte - mail: ezachte@###.org (nospam: ###=wikimedia)
|
|